Construct Validity, Dimensionality and Factorial Invariance of
the Rosenberg Self Esteem Scale: A Bifactor Modelling Approach
among Children of Prisoners
Kathryn Sharratt, Daniel Boduszek, Adele Jones and Bernard Gallagher
University of Huddersfield, Huddersfield, United Kingdom
ABSTRACT
The Rosenberg Self Esteem Scale (RSES; Rosenberg, 1989) has traditionally been conceptualised as a unidimensional measure of self-esteem but empirical evidence is equivocal, with some studies supporting a one-factor solution and others favouring multidimensional models. The aim of this study was to examine the factor structure, factorial invariance and composite reliability of the RSES within a European sample of children affected by parental imprisonment (N = 724). The study specified and tested six alternative factor models using conventional confirmatory factor analytic (CFA) techniques and a confirmatory bifactor modelling approach. The RSES was most effectively represented by a bifactor model including a general self-esteem factor comprising of all ten scale items and separate method effects for the positively and negatively phrased items. This model was found to be factorially invariant among boys and girls. Composite reliability indicated good internal consistency for the general self-esteem dimension but slightly less so for the positive and negative methods effects. Results are discussed in terms resolving the debate surrounding the appropriate factor structure and scoring of the RSES.
INTRODUCTION
Qualitative studies have variously demonstrated that children affected by parental imprisonment suffer feelings of sadness, despair, loss, rejection, confusion, anxiety (e.g. Bocknek, Sanderson & Britner, 2009; Jones et al., 2013). Combined with exposure to secondary stigma, social isolation, bullying and victimization (e.g. Cunningham, 2001; Murray, 2007), it would not be surprising if parental imprisonment was found to have deleterious consequences to self-esteem. Indeed, during the course of interviews, children of prisoners have been reported to express feelings such as shame, guilt and embarrassment that could be considered synonymous with low self-esteem (Brown, Dibb, Shenton & Elson, 2000; Hissel, Bijleveld & Kruttschnitt, 2011). This is cause for concern given that empirical evidence suggests lower levels of self-esteem play an important role in the development of clinical depression, whereas higher levels of self-esteem can promote resilience in response to adverse life events (see Pyszczynski et al., 2004 for a review). Taking into consideration research that has demonstrated that boys and girls react differently to parental imprisonment, with boys displaying more externalising problems and girls more internalising problems (Murray et al, 2009; Murray & Farrington, 2008), gender differences in self-esteem might also be anticipated in response to parental imprisonment.
children’s positive adjustment was a consequence of the consistent and nurturing environment provided by their caregiver (mostly grandmothers). Conversely, Springer, Lynch and Rubin (2000) administered the Hare Self-Esteem Scale (Hare, 1980), to children of prisoners who had participated in a group-based intervention and revealed no significant improvement in self-esteem. Utilising the Self-Perception Profile for Children and for Adolescents (Harter, 1985; 1988), Harrison (1997) demonstrated that a parenting programme for prisoners had no significant impact on the self-esteem of the participants’ children.
As illustrated above, a variety of instruments have been designed to measure self-esteem amongst children and young people, but the Rosenberg Self-Esteem Scale (RSES; Rosenberg, 1989) remains one of the most commonly used. Rosenberg (1965) initially described self-esteem as a component of the self-concept in which individuals hold favourable or unfavourable perceptions about themselves in terms of their worth and importance. The RSES was originally designed to measure self-esteem as a single construct, but despite its widespread use, there remains uncertainty with regards to the number of latent variables that effectively explain the underlying structure of the instrument.
In an attempt to provide clarification, Marsh (1996) tested six possible model solution and found support for a single common factor and a method factor primarily comprising of the negatively worded items. Marsh (1996) suggested that the younger, less verbally able students in the sample might have experienced more difficulties responding to the negatively phrased items. However, this study utilised a 7-item version of the scale, limiting the number of items per factor and the comparability of the instrument to the full 10-item version. In an extension to the previous study, Corwyn (2000), Tomás and Oliver (1999) and Quilty, Oakman and Risko (2006) administered the full ten-item version of the scale to high school students and young people, and confirmed the presence of a single latent variable with negative item method effects.
More recently, investigators have administered the RSES to representative samples of adolescents (Marsh, Scalas & Nagengast, 2010) and adults (Hyland, Boduszek, Dhingra, Shevlin & Egan, 2014) and have comprehensively tested a series of traditional CFA models
(2014) found no support the one factor models, and similarly, very little support for the two-factor model. There was, however, strong support for a bitwo-factor solution comprising of a single general self-esteem factor and two method/grouping factors reflecting positive and negative method effects.
Boduszek and colleagues have also tested a series of conventional CFA models and bifactor models of the RSES amongst samples of prisoners, and found that superior fit was achieved with a two-factor model comprising of separate positive and negative latent variables (Boduszek, Hyland, Dhingra & Mallet, 2013; Boduszek, Shevlin, Mallet, Hyland & O’Kane, 2012). Carmines and Zeller (1979) argue that if the positive and negative dimensions are indeed measuring substantially different aspects of self-esteem, then they should differentially relate to external variables. In further support of the two-factor model, positive (but not negative) self-esteem was found to be a significant predictor of recidivism (Boduszek et al., 2013), and negative (but not positive) self-esteem a significant predictor of criminal cognitions (Boduszek et al., 2012).
modelling approach. It was also apparent from the literature review that there are a growing number of studies concerned with identifying differential reactions to parental imprisonment among boys and girls. This underscores the importance of identifying instruments that can provide a reliable indication of differences in the psychological adjustment of boys and girls. Therefore, the second aim of the paper was to examine the factorial invariance of the RSES among boys and girls. The third aim of the paper was to examine the composite reliability of the RSES among children of prisoners, thereby providing a more robust indication of internal reliability than the more frequently used Cronbach’s alpha scores.
METHODS
Participants
Measure
The Rosenberg Self-Esteem Scale (RSES; Rosenberg, 1989) consists of 10 Likert-type scale items designed to assess positive and negative evaluations of self. Respondents indicate their level of agreement ranging from 1 (strongly disagree) to 4 (strongly agree). Thus, the possible total score can range from a minimum of 10 to a maximum of 40, with higher scores reflecting more positive evaluations of self. This study utilised the English, German, Swedish and Romanian translation of the scale as appropriate.
Analysis
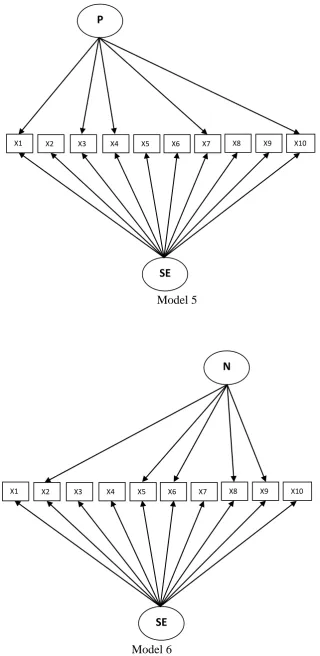
The dimensionality of the RSES was investigated through the use of conventional confirmatory factor analytic (CFA) techniques, along with the utilization of a confirmatory bifactor modelling approach (see Reise et al., 2010; Reise et al., 2007). Six alternative models of the latent factor structure of the RSES were specified and estimated using Mplus version 6.0 (Muthen & Muthen, 1998–2010) with maximum likelihood (ML) estimation. Three of these models were traditional CFA conceptualizations with items restricted to load only onto a single factor. In the bifactor models, each item was allowed to load onto a general factor (self-esteem) and one grouping factor (positive self-esteem or negative self-esteem). Within a bifactor model, the grouping factors are restricted to be uncorrelated with each other and uncorrelated with the general self-esteem factor. For the purposes of model identification, the variance of each factor is set to 1.0.
items on the other; (e) Model 5, one global self-esteem factor and one method factor that includes the positive items; (f) Model 6, one global self-esteem factor and one method factor that includes the negative items (see Fig. 1). In all cases measurement error terms remained uncorrelated as per recommendations (Brown, 2006).
[INSERT FIGURE 1 HERE]
RESULTS
The mean RSES score for the entire sample was 30.58 (SD = 4.88). The mean scores for boys (M = 30.82, SD = 4.75) and girls (M = 30.31, SD = 5.02) were similar and not significantly different, t(657) = 1.33, p = .18.
Model Results and Test of Factorial Invariance
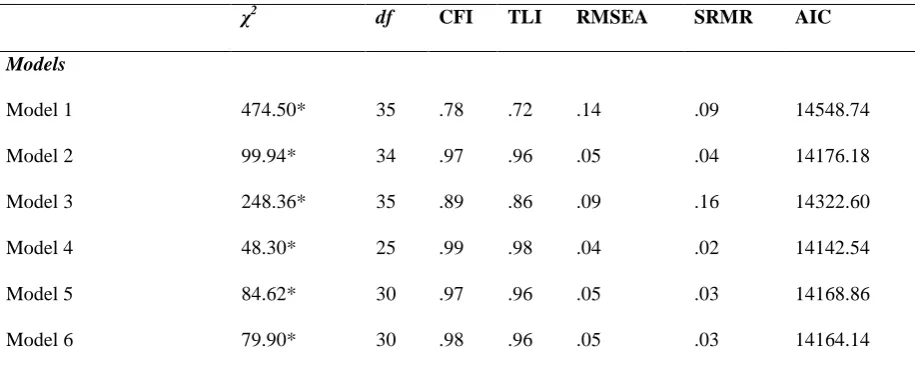
Table 1 reports the fit indices and comparative fit indices of the six alternative models of the RSES. Based on these results, Model 1 and 3 were rejected as a poor approximation of the data. The model 2, 4, 5, and 6 were found to be a good representation of the data, however, substantial improvements were observed across all fit indices for the Model 4. This model which includes a single SE factor and two grouping factors (P and N) was determined to be the best approximation of the covariation matrix in the obtained data based upon all fit indices. This model also displayed a considerably lower AIC value than the alternative models further indicating its statistical superiority.
[INSERT TABLE 1 HERE]
[INSERT TABLE 2 HERE]
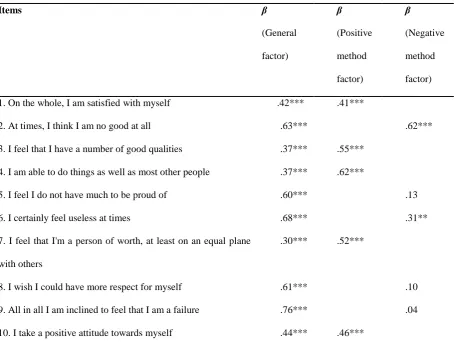
load strongly onto a general factor, and comparatively weaker on each of the grouping factors, this provides support for consideration of a unidimensional scoring scheme. Alternatively when items load as strongly, or more strongly, onto each of the respective grouping factors than they do the general factor, creation of subscales is appropriate.
As outlined in Table 2, factor loadings on the general SE factor were in the expected direction and were comparatively stronger than those on the grouping factors. Most of the negatively worded items (N factor) have statistically non-significant factor loadings (p > .05); however the P factor in particular displayed robust factor loadings. These parameter estimate results provide strong support for the supremacy of a single SE latent factor, and the presence of two meaningful method effect factors.
Subsequently tests of factorial invariance were conducted between boys (N = 393) and girls (N = 331) using the bifactor solution as the baseline model. Following the procedure of Bollen (1989), a hierarchy of increasingly restrictive models was specified and tested. The test of invariance of form, or that the bifactor model held in both samples, was supported, χ2 = 80.91, df = 50, p = .004 (RMSEA = .04 [90% CI = .02/.06]; CFI = .99; TLI = .97; SRMR = .03), as was the test of equal factor loadings, χ2
= 94.85, df = 70, p = .03 (RMSEA = .03 [90% CI = .01/.05]; CFI = .98; TLI = .98; SRMR = .05). Assessment of invariance in factor variances could not be conducted due to the necessity to constrain factor variances to 1 in order that a bifactor solution could be identified. These results indicate that the RSES is factorially invariant between boys and girls.
Reliability Analysis
assessment of the internal reliability of the RSES the current study investigated the composite reliability of the measurement properties of the scale. Composite reliability was calculated using the formula:
Where ρc = reliability of the factor score, λi = standardized factor loading, and θi = standardised error variance. Values greater than .60 are generally considered acceptable (Bagozzi & Yi, 1988; Diamantopoulos & Siguaw, 2000). Current results indicate that the general SE factor of the RSES possesses good internal consistency (ρc = .84). In contrast, the
internal reliability for the two grouping factors were lower (P, ρc = .68; N, ρc = .38).
DISCUSSION
was considered to provide an adequate fit, and was superior to alternative solutions. Item loadings and composite reliability scores were comparatively better for the single factor than the grouping factors, further reinforcing the supremacy of a general self-esteem factor.
These findings are consistent with Rosenberg’s (1965) initial unidimensional conceptualisation of self-esteem, and also previous research conducted within general population samples of children and young people that has revealed superior fit for solutions incorporating a unidimensional self-esteem factor with the addition of either positive and/or negative method effects (e.g. Corwyn, 2000; Marsh, Scalas & Nagengast, 2010; Tomás & Oliver, 1999). In contrast, little support was found for the existence of two distinct positive and negative self-esteem factors as evidenced among samples of prisoners (Boduszek et al., 2013; Boduszek et al., 2012). Therefore, the underlying latent variable structure of the RSES amongst the present sample of children of prisoners was found to be more similar to that of their peers than that of their imprisoned parents.
It follows that the calculation of total RSES scores is appropriate for children of prisoners (and children more generally), but researchers should be aware that results might be contaminated by the presence of method effects. Simply calculating a unidimensional score with no consideration of method effects might give rise to false interpretations, for example, in relation to the effectiveness of interventions in mediating the impact of parental imprisonment on children’s self-esteem. This study has highlighted the importance of allowing for methods effects by appropriately including them in latent variable models, and has demonstrated the application of a bifactorial modelling approach as a potential solution.
provided an adequate fit for both boys and girls, therefore permitting the comparison of RSES scores between girls and boys affected by parental imprisonment.
This study has provided further clarification of the factor structure of the RSES and offers important directions for furthering research with children of prisoners; however it is not without limitations. The present study was unable to confirm the applicability of the measure to other sub-samples of children of prisoners. In particular, due to the lower rates of imprisonment of women in the four countries (approximately 5%; Aebi & Delgrande, 2013) it was comparatively more difficult to recruit children with a mother in prison. Also, since most children were recruited by NGOs designed to facilitate contact between children and their imprisoned parent, most children in the sample had contact on a regular basis.
In summary, the RSES was most effectively represented by a single common self-esteem factor and positive and negative grouping factors. This solution was found to be factorially invariant among boys and girls, facilitating the comparison of gender differences in responses to parental imprisonment. However, neglecting to take into consideration the potential for method effects by allowing for the method variance to be removed from the model might result in inaccurate conclusions.
ACKNOWLEDGEMENTS
REFERENCES
Aebi, M.F., & Delgrande, N. (2013). Council of Europe Annual Penal Statistics SPACE 1, 2011 Survey on Prison Populations. Strasbourg: Council of Europe.
Akaike, H. (1974). A new look at the statistical model identification. IEEE Transactions on Automatic Control, 19(6), 716–723.
Bachman, J.G., & O’Malley, P.M. (1986). Self-concept, self-esteem, and experiences: The frog pond revisited (again). Journal of Personality and Social Psychology, 50(1), 35– 46.
Bagozzi, R.P. (1993). Assessing construct validity in personality research: Applications to measures of self-esteem. Journal of Research in Personality, 27, 49-87.
Bagozzi, R.P., & Yi, Y. (1988). On the evaluation of structural equation models. Journal of the Academy of Marketing Science, 16(1), 74–94.
Bentler, P.M. (1990). Comparative fit indices in structural models. Psychological Bulletin, 107(2), 238–246.
Bocknek, E.L., Sanderson, J., & Britner, P.A. (2009). Ambiguous Loss and Posttraumatic Stress in School-Age Children of Prisoners. Journal of Child and Family Studies, 18(3), 323-333.
Boduszek, D., Hyland, P., Dinghra, K., & Mallet, J. (2013). The factor structure and composite reliability of the Rosenberg Self-Esteem Scale among ex-prisoners.
Personality and Individual Differences, 55(8), 877-887.
Boduszek, D., Shevlin, M., Mallett, J., Hyland, P., & O’Kane, D. (2012). Dimensionality and construct validity of the Rosenberg Self-Esteem Scale within a sample of recidivistic prisoners. Journal of Criminal Psychology, 2(1), 19–25.
Brown, T.A. (2006). Confirmatory factor analysis for applied research. New York: The Guilford Press.
Brown, K., Dibb, L., Shenton, F., & Elson, N. (2000). No-One’s Ever Asked Me: Young People with a Prisoner in the Family. London: Action for Prisoners Families.
Carmines, E.G., & Zeller, R.A. (1979). Reliability and validity assessment. Beverly Hills, CA: Sage.
Corwyn, R.F. (2000). The Factor Structure of Global Self-Esteem among Adolescents and Adults. Journal of Research in Personality, 34, 357–379.
Cunningham, A. (2001). Forgotten Families - the impacts of imprisonment. Family Matters, 59(Winter), 36-37.
Diamantopoulos, A., & Siguaw, J.A. (2000). Introducing LISREL. London: Sage Publications.
Dunbar, M., Ford, G., Hunt, K., & Der, G. (2000). Question wording effects in the assessment of global self-esteem. European Journal of Psychological Assessment, 16(1), 13–19.
Gana, K., Alaphilippe, D., & Bailly, N. (2005). Factorial Structure of the French Version of the Rosenberg Self-Esteem Scale Among the Elderly. International Journal of Testing, 5(2), 169-176.
Hanlon, T.E., Blatchley, Bennett-Sears, T., O’Grady, K.E., Rose, M., & Callaman, J.M. (2005). Vulnerability of children of incarcerated addict mothers: Implications for preventive intervention. Children and Youth Services Review, 27(1), 67-84.
Harrison, K. (1997). Parental Training for Incarcerated Fathers: Effects on Attitudes, Self-Esteem, and Children's Self-Perceptions. The Journal of Social Psychology, 137(5), 588-593.
Harter, S. (1988). Manual for the Self-Perception Profile for Adolescents. Denver: University of Denver.
Harter, S. (1985). Manual for the Self-Perception Profile for Children. Denver: University of Denver.
Hissel, S., Bijleveld, C., & Kruttschnitt, C. (2011). The well-being of children of incarcerated mothers: An exploratory study for the Netherlands. European Journal of Criminology, 8(5), 346-360.
Hu, L., & Bentler, P.M. (1999). Cutoff criteria for fit indexes in covariance structure analysis: Conventional criteria versus new alternatives. Structural Equation Modelling, 6(1), 1– 55.
Huang, C., & Dong, N. (2012). Factor structures of the Rosenberg Self-Esteem Scale: A meta-analysis of pattern matrices. European Journal of Psychological Assessment, 28(2), 132–138.
Hyland, P., Boduszek, D., Dhingra, K. Shevlin, M., & Egan, A. (2014). A bifactor approach to modelling the Rosenberg Self-Esteem Scale. Personality and Individual Differences, 66, 188-192.
Jones, A., Gallagher, B., Manby, M., Robertson, O., Schützwohl, M., Berman, A., Hirschfield, A., Ayre, L., Urban, M., Sharratt, K., & Christmann, K. (2013). Children of Prisoners: Interventions and mitigations to strengthen mental health. Huddersfield: University of Huddersfield.
Kaufman, P., Rasinski, K. A., Lee, R., & West, J. (1991). National Education Longitudinal Study of 1988. Quality of the responses of eighth-grade students in NELS88. Washington, DC: US Department of Education.
Kline, P. (1994). An easy guide to factor analysis. New York: Routledge.
Marsh, H.M. (1996). Positive and negative global self-esteem: A substantial meaningful distinction or artifactors? Journal of Personality and Social Psychology, 70, 810–819. Marsh, H.W., Scalas, L.F., & Nagengast, B. (2010). Longitudinal tests of competing factor
structures for the Rosenberg Self-Esteem Scale: Traits, ephemeral artifacts, and stable response styles. Psychological Assessment, 22(2), 366-381.
Murray, J. (2007). The cycle of punishment: Social Exclusion of Prisoners and their children.
Criminology and Criminal Justice, 7(1), 55-81.
Murray, J., & Farrington, D.P. (2008). Parental imprisonment: Long-lasting effects on boys’ internalizing problems through the life course. Development and Psychopathology, 20(1), 273–290.
Murray, J., Farrington, D.P., Sekol, I., & Olsen, R.F. (2009). Effects of parental imprisonment on child antisocial behaviour and mental health: a systematic review. Campbell Systematic Reviews.
Muthen, L. K., & Muthen, B. O. (1998). Mplus – Statistical analysis with latent variables. User’s guide (6th ed.). Los Angeles: Muthen and Muthen.
Piers, E.V. (1984). Piers–Harris children’s self-concept scale revised manual. Los Angeles, CA7 Western Psychological Services.
Quilty, L.C., Oakman, J.M., & Risko, E. (2006). Correlates of the Rosenberg Self-Esteem Scale Method Effects, Structural Equation Modeling: A Multidisciplinary Journal, 13(1), 99-117.
Raykov, T. (1998). Coefficient alpha and composite reliability with interrelated nonhomogeneous items. Applied Psychological Measurement, 22(4), 375–385.
Reise, S.P., Morizot, J., & Hays, R.D. (2007). The role of the bifactor model in resolving dimensionality issues in health outcomes measures. Quality of Life Research, 16(1), 19–31.
Reise, S.P., Moore, T.M., & Haviland, M.G. (2010). Bifactor models and rotations: Exploring the extent to which multidimensional data yield univocal scale scores. Journal of Personality Assessment, 92(6), 544–559.
Rock, D.A., Werts, C.E., & Flaugher, R.L. (1978). The use of analysis of covariance structures for comparing the psychometric properties of multiple variables across populations. Multivariate Behavioural Research, 13, 403-418.
Rosenberg, M. (1965). Society and the adolescent self-image. Princeton, NJ: Princeton University Press.
Rosenberg, M. (1989). Society and the adolescent self-image (Rev. Ed.). Middeltown, CT: Wesleyan University Press.
Shevlin, M., Bunting, B. P., & Lewis, C. A. (1995). Confirmatory factor analysis of the Rosenberg Self-Esteem Scale. Psychological Reports, 76(3), 707–710.
Springer, D.W., Lynch, C., & Rubin, A. (2000). Effects of a solution-focused mutual aid group for Hispanic children of incarcerated parents. Child and Adolescent Social Work Journal, 17(6), 431-442.
Tanaka, J. S. (1987). How big is big enough? Sample size and goodness of fit in structural equation models with latent variables. Child Development, 58, 134–146.
Tomás, J. M., & Oliver, A. (1999). Rosenberg’s Self-Esteem Scale: Two factors or method effects. Structural Equation Modeling, 6, 84–98.
Model 1
Model 2
SE
X3
X1 X2 X4 X5 X6 X7 X8 X9 X10
P
X3
X1 X2
N
Model 3
Model 4
P
X3
X1 X2
N
X4 X5 X6 X7 X8 X9 X10
P
X3
X1 X2
N
X4 X5 X6 X7 X8 X9 X10
Model 5
Model 6
P
X3
X1 X2 X4 X5 X6 X7 X8 X9 X10
SE
X3
X1 X2
N
X4 X5 X6 X7 X8 X9 X10
[image:24.595.120.441.68.726.2]Table 1: Fit Indices for Six Alternative Models of the Rosenberg Self-Esteem Scale
χ2 df CFI TLI RMSEA SRMR AIC
Models
Model 1 474.50* 35 .78 .72 .14 .09 14548.74
Model 2 99.94* 34 .97 .96 .05 .04 14176.18
Model 3 248.36* 35 .89 .86 .09 .16 14322.60
Model 4 48.30* 25 .99 .98 .04 .02 14142.54
Model 5 84.62* 30 .97 .96 .05 .03 14168.86
Model 6 79.90* 30 .98 .96 .05 .03 14164.14
Note: N = 724; χ2 = chi square goodness of fit statistic; df = degrees of freedom; RMSEA = Root-Mean-Square
Error of Approximation; CI = Confidence Interval; AIC = Akaike Information Criterion; CFI = Comparative Fit
Index; TLI = Tucker Lewis Index; SRMR = Standardized Square Root Mean Residual. * Indicates χ2 are
Table 2: Standardized Factor Loadings for the General Factor and two Method Factors of the Rosenberg
Self-Esteem Scale
Items β
(General
factor)
β
(Positive
method
factor)
β
(Negative
method
factor)
1. On the whole, I am satisfied with myself .42*** .41***
2. At times, I think I am no good at all .63*** .62***
3. I feel that I have a number of good qualities .37*** .55***
4. I am able to do things as well as most other people .37*** .62***
5. I feel I do not have much to be proud of .60*** .13
6. I certainly feel useless at times .68*** .31**
7. I feel that I'm a person of worth, at least on an equal plane
with others
.30*** .52***
8. I wish I could have more respect for myself .61*** .10
9. All in all I am inclined to feel that I am a failure .76*** .04
10. I take a positive attitude towards myself .44*** .46***