MEMS for Diabetic Retinopathy
Thesis by Dongyang Kang
In Partial Fulfillment of the Requirements for the Degree of
Doctor of Philosophy
California Institute of Technology Pasadena, California
2015
ACKNOWLEDGEMENTS
thinking is exceedingly imperative for solving formidable research problems, writing lucid and compelling scientific papers, making articulate academic speeches, and improving interpersonal skills. I feel so lucky that I have this chance to learn and get well trained by example, which is the most precious, cherished and rewarding experience throughout my life.
the rest of my collaborators at USC, Dr. Amir H. Kashani, Dr. Hossein Nazari Khanamiri, and Mr. Karthik Murali, for their assistance in the animal trials. I would specially thank Karthik for his diligent work on testing devices on animals day and night, as well as his original and vital suggestions in terms of the device design.
I would like to express my warmest thanks and gratitude to Prof. Tzung K. Hsiai, director of the UCLA Cardiovascular Engineering Research Laboratory, for leading the NIH zebrafish project. The central theme of his research is primarily on hemodynamics, mechanobiology, and vascular biology via Bio-MEMS and nanotechnology. I worked with Prof. Hsiai and Mr. Juhyun Lee closely on hemodynamics to elucidate cardiac morphogenesis underlying congenital heart disease using a zebrafish heart model. Prof. Hsiai always listened carefully and patiently to our demands. Under his leadership, we made rapid progress through timely meetings, coordinated teamwork, and mutual understanding, which produced a wealth of synergetic effects. Mr. Juhyun Lee is one of the most hard-working and wonderful partners I have been working with. I am greatly indebted to him for his endless efforts of collecting extremely small quantities of adult and embryo zebrafish blood using his superb experimental skills, for the testing of our MEMS viscometer at Caltech. He assisted me in the preparation of academic talks with his specialties in biological sciences unreservedly.
I would like to deeply thank Prof. Yi-Kuen Lee (HKUST), Prof. Qiang (John) Chen (Kumamoto University), and Prof. Wei Wang (Peking University), for working on the DMA testing and characterization of parylene polymers with me for so long time. I would especially thank Prof. Wei Wang. We have been working on so many projects together. He is a meticulous and industrious researcher, always working hard to produce very accurate, consistent, repeatable, and convincing experimental data. His active attitude always impelled us to proceed with fast pace, high quality, and firm understanding of fundamental physics. He is such a smart, decisive, and reliable person. I strongly believe that he will achieve huge success and make great achievements in the future.
Wendian Shi, Dr. Justin Kim, Dr. Jay Chang, Dr. Yu (Joy) Zhao, Dr. Mandheerej (Monty) Nandra, Dr. Yi-Kuen Lee, Dr. Honglong Chang, Dr. Qiang (John) Chen, Dr. Wei Wang, Dr. Ming Xu, Dr. Lei Xu, Dr. Jungwook (Jun) Park, Dr. Yuan Luo, Yang Liu, Nick Scianmarello, Xiaoxiao (Shell) Zhang, Aubrey Shapero, Tzu-Chieh (Jake) Chou, Ji Luo, Debbie Yu, and Jeff Han, for their assistance, encouragement and trust. I give special thanks to Dr. Jeffrey Lin and Dr. Jay Chang, who were my mentors when I joined the team at the beginning, and guided me into the MEMS world through countless trainings for the parylene viscoelasticity and NSF retinal prosthetics projects. In addition, I would like to thank all my talented summer research students, Andrew Standley, Sanae Matsuki, and Kai-Tang Chang, for their excellent contributions to my experiments and research projects. It was so memorable to work with these talented and brilliant young undergraduates during the whole summer. I would like to appreciate the collaborative efforts from Mr. Chun-Hui Wu, an exchange student from National Taiwan University to our lab. We have worked together on designing and making ultrasensitive thermal flow sensors. He is a fast learner and hard worker. It took only two weeks for him to learn and master AutoCAD and COMSOL, very professional softwares for mask layout design and finite element modeling, respectively. I feel so proud to be able to work with him in the lab day in and day out, moving the project forward so rapidly.
unforgettable. I am extremely obliged to them and will never forget them for the rest of my life.
I want to thank all my friends and relatives in my life. Their unconditional trust and support are the greatest gift I have ever got. They give me tremendous support and trust in the past many years. I have benefited greatly from our many conversations in person and over the phone. My life will become colorless and empty without them. They are the reason why I have enthusiasm for life.
Finally, I would like to express my deepest gratitude to my parents, for giving me almost three decades of love, support, encouragement, and inspiration. Their love, wisdom, and generosity have enriched my life. Whenever I experience obstacles and difficulties in my life, they give me enormous comfort. I will strive for making them feel proud and happy in the rest of my life.
ABSTRACT
MEMS for Diabetic Retinopathy
Thesis by Dongyang Kang
Doctor of Philosophy in Electrical Engineering California Institute of Technology
As the worldwide prevalence of diabetes mellitus continues to increase, diabetic retinopathy remains the leading cause of visual impairment and blindness in many developed countries. Between 32 to 40 percent of about 246 million people with diabetes develop diabetic retinopathy. Approximately 4.1 million American adults 40 years and older are affected by diabetic retinopathy. This glucose-induced microvascular disease progressively damages the tiny blood vessels that nourish the retina, the light-sensitive tissue at the back of the eye, leading to retinal ischemia (i.e., inadequate blood flow), retinal hypoxia (i.e., oxygen deprivation), and retinal nerve cell degeneration or death. It is a most serious sight-threatening complication of diabetes, resulting in significant irreversible vision loss, and even total blindness.
responsible for sharp, clear, central vision, by sacrificing the peripheral retina since there is only limited oxygen supply. Therefore, laser therapy results in a constricted peripheral visual field, reduced color vision, delayed dark adaptation, and weakened night vision. Vitrectomy surgery increases the risk of neovascular glaucoma, another devastating ocular disease, characterized by the proliferation of fibrovascular tissue in the anterior chamber angle. Anti-VEGF agents have potential adverse effects, and currently there is insufficient evidence to recommend their routine use.
In this work, for the first time, a paradigm shift in the treatment of diabetic retinopathy is proposed: providing localized, supplemental oxygen to the ischemic tissue via an implantable MEMS device. The retinal architecture (e.g., thickness, cell densities, layered structure, etc.) of the rabbit eye exposed to ischemic hypoxic injuries was well preserved after targeted oxygen delivery to the hypoxic tissue, showing that the use of an external source of oxygen could improve the retinal oxygenation and prevent the progression of the ischemic cascade.
To prevent too fast or too slow permeation of oxygen through the device that is made of parylene and silicone (two widely used biocompatible polymers in medical devices), the material properties of the hybrid parylene/silicone were investigated, including mechanical behaviors, permeation rates, and adhesive forces. Then the thicknesses of parylene and silicone became important design parameters that were fine-tuned to reach the optimal oxygen permeation rate.
The passive MEMS oxygen transporter devices were designed, built, and tested in both bench-top artificial eye models and in-vitro porcine cadaver eyes. The 3D unsteady saccade-induced laminar flow of water inside the eye model was modeled by computational fluid dynamics to study the convective transport of oxygen inside the eye induced by saccade (rapid eye movement). The saccade-enhanced transport effect was also demonstrated experimentally. Acute in-vivo animal experiments were performed in rabbits and dogs to verify the surgical procedure and the device functionality. Various hypotheses were confirmed both experimentally and computationally, suggesting that both the two types of devices are very promising to cure diabetic retinopathy. The chronic implantation of devices in ischemic dog eyes is still underway.
TABLE OF CONTENTS
ACKNOWLEDGEMENTS ... v
ABSTRACT ... xi
TABLE OF CONTENTS ... xv
LIST OF FIGURES ... xix
LIST OF TABLES ... xxxiii
CHAPTER 1 INTRODUCTION ... 1
1.1 INTRODUCTION TO BLINDNESS AND DIABETIC RETINOPATHY ... 1
1.1.1 Stages of Diabetic Retinopathy ... 4
1.1.2 Causes of Vision Loss and Risk Factors ... 9
1.1.3 Symptoms ... 10
1.1.4 Diagnosis and Detection ... 11
1.2 CURRENT TREATMENTS OF DIABETIC RETINOPATHY ... 12
1.2.1 Laser Surgery ... 12
1.2.2 Vitrectomy ... 13
1.2.3 Anti-VEGF Therapy ... 13
1.2.4 Severe Drawbacks of Current Treatments ... 14
1.2.5 Proposed Oxygen Therapy ... 14
1.3 IDEAL MATERIALS FOR MEDICAL IMPLANTS ... 16
1.3.1 Parylene... 16
1.3.2 Silicone ... 18
CHAPTER 2 STUDY OF PAYRLENE AND SILICONE ... 21
2.1 OVERVIEW ... 21
2.2 EFFECTS OF DEPOSITION TEMPERATURE ON PARYLENE PROPERTIES ... 23
2.2.1 Sample Preparation ... 25
2.2.2 Experiments, Testing Results and Discussion ... 26
2.2.2.1 DMA Tests ... 26
2.2.2.2 Dielectric Measurement ... 28
2.2.2.3 XRD Tests ... 30
2.2.2.4 Uniaxial Tensile Tests... 32
2.2.2.5 Discussion ... 33
2.3 HYBRID PARYLENE/PDMS MATERIAL ... 35
2.3.1 Mechanical Behavior ... 36
2.3.2 Barrier Property ... 37
2.3.3 Enhanced Parylene Penetration into PDMS ... 40
2.3.3.1 Experimental Results ... 40
2.3.3.2 Theoretical Modeling ... 48
2.4 PARYLENE PENETRATION INTO MICROFLUIDIC CHANNELS ... 53
2.4.1 Theoretical Modeling ... 54
2.4.2 Experimental Procedure ... 56
2.4.3 Results and Discussion ... 57
2.5 APPLICATION OF PARYLENE AND SILICONE IN A CAPILLARY PRESSURE-DRIVEN VISCOMETER ... 63
2.5.2 Theoretical Modeling ... 68
2.5.2.1 Analytical Derivation ... 71
2.5.2.2 Numerical Algorithm and Simulation ... 73
2.5.3 Device Design and Fabrication ... 76
2.5.4 Characterization Results and Discussions ... 79
2.6 SUMMARY AND CONCLUSION ... 91
CHAPTER 3 OXYGEN TRANSPORTER ... 95
3.1 OVERVIEW ... 95
3.2 DEVICE DESIGN AND FABRICATION ... 97
3.2.1 Device Design ... 97
3.2.2 Device Fabrication ... 98
3.3 EXPERIMENTS, CHARACTERIZATION, AND COMPUTATIONAL MODELING ... 100
3.3.1 Oxygen Permeability of Silicone ... 100
3.3.2 Flow Resistances of the Proposed Oxygen Delivery System ... 103
3.3.3 Artificial Eye Model Experiments ... 106
3.3.3.1 In the Atmosphere ... 106
3.3.3.2 In the Nitrogen Glove Box ... 110
3.3.4 Porcine Cadaver Eye Experiments ... 112
3.4 3D SIMULATION OF OXYGEN TRANSPORT PROCESSES IN THE HUMAN EYE ... 114
3.4.1 Modeling of Oxygen Transport in the Vitreous ... 116
3.4.2 Saccade-Induced Convective Transport of Oxygen ... 119
3.4.3 Modeling of Oxygen Consumption by the Lens ... 121
3.4.5 Simulation Results ... 126
3.4.5.1 The Oxygenation in the Normal and Ischemic Human Eyes ... 127
3.4.5.2 The Design of the Device Diffuser: Shape, Size and Control of Permeability... 131
3.4.5.3 The Atmospheric Oxygen as a Source to Treat Ischemic Retina ... 147
3.4.5.4 The Injected Pure Oxygen as a Source to Treat Ischemic Retina ... 152
3.5IN-VIVO ANIMAL EXPERIMENTS ... 157
3.6 SUMMARY AND CONCLUSION ... 161
CHAPTER 4 GENERAL CONCLUSION ... 164
LIST OF FIGURES
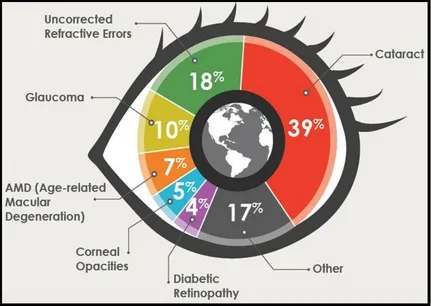
Figure 1-1: Global causes of blindness due to eye diseases and uncorrected refractive errors [4]. ... 3
Figure 1-2: (a) Normal vision. (b) The same scene viewed by a person with diabetic retinopathy [7]. ... 4
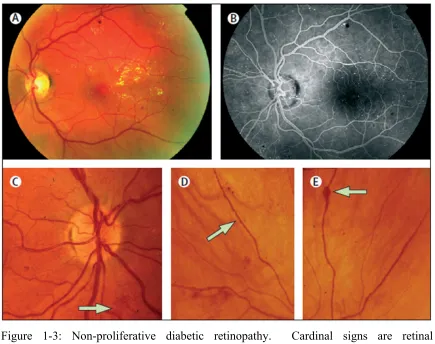
Figure 1-3: Non-proliferative diabetic retinopathy. Cardinal signs are retinal microaneurysms, hemorrhages, and hard exudates (A and B); and intraretinal microvascular abnormalities (C, arrow); venous beading (D, arrow); and venous loop formation (E, arrow). ... 6
Figure 1-4: Retinal anatomy and mechanisms of proliferative diabetic retinopathy [11]. A normal retina is shown in Panel A, and a retina from a patient with proliferative diabetic retinopathy is shown in Panel B. ... 7
Figure 1-5: Proliferative diabetic retinopathy [12]. Neovascularization, a hallmark of proliferative diabetic retinopathy (A, arrows), which can be identified on fluorescein retinal angiogram (B, arrows); resolution of retinopathy with panretinal photocoagulation (C); progression of retinopathy without treatment to fibroproliferative disease (D). ... 8
the ganglion cell layer (GCL), and cell loss and pigment clumping of the RPE. In contrast, the oxygenated eye shows good retinal thickness and well-preserved anatomy compared with the contralateral nonoperated normal rabbit eye. The RPE/choroid is shown at higher magnification in the lower panels. There is prominent choroidal atrophy in the non-treated group, whereas the oxygenated group shows only mild atrophy of the choroidal vasculature. Scale bar, 20µm. ... 15
Figure 1-7: The chemical structures of major types of parylene polymers ... 17
Figure 1-8: The parylene C vacuum deposition process [24]. ... 18
Figure 1-9: The chemical structure of the siloxane functional group [26], and the polydimethylsiloxane (PDMS) that belongs to the group of silicone [27]. ... 20
Figure 2-1: The experimental setup for the in-situ heated deposition to prepare parylene C deposited at elevated temperatures. ... 25
Figure 2-2: The DMA data of storage modulus E' vs. measurement temperature T at 1Hz for parylene C deposited at 20-80°C (T _ ' corresponds to the major inflection point of each curve). ... 27
Figure 2-3: The dielectric measurement of T _ ' of parylene C deposited at 20-80°C: the real part of the complex permittivity ε' vs. measurement temperature T at 100Hz and 10KHz, respectively. ... 29
Figure 2-4: The XRD spectra for parylene C samples deposited at 20-80°C. The peak represents (020) plane of the monoclinic unit cell. ... 31
3µm-thick films deposited at 20ºC, 60ºC and 80ºC are grouped on the top, and the results for 9µm-thick films deposited at 20ºC and 40ºC grouped at the bottom. ... 32
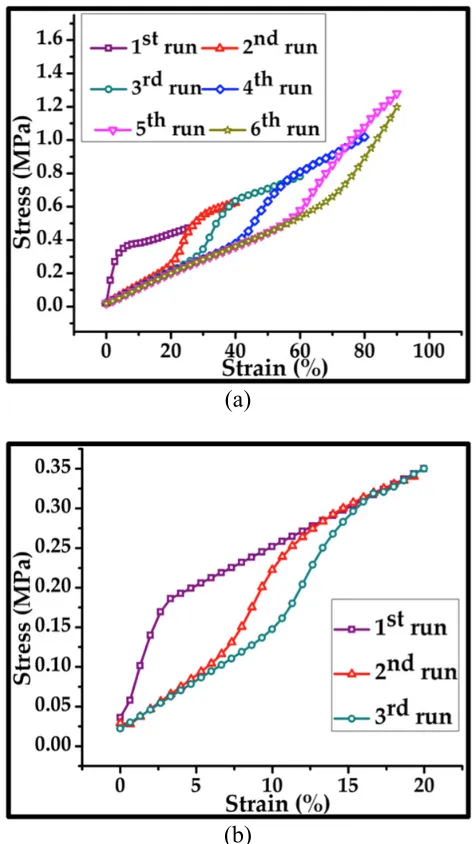
Figure 2-6: (a) The stress-strain relations for six successive uniaxial tensile tests of parylene/PDMS samples before RIE etching. (b) Stress-strain relations for three successive uniaxial tensile tests of parylene/PDMS samples after RIE etching. 0.3µm-thick surface PA-C was etched away. ... 36
Figure 2-7: The WVTR experimental data for various parylene/PDMS samples with and without annealing. A: 92µm-thick PDMS; B: 92µm-thick PDMS coated with 0.64µm-thick PA-C; C: 92µm-thick PDMS coated with 0.64µm-thick PA-C, followed by RIE to etch away 0.3µm-thick surface PA-C; and D: 92µm-thick PDMS coated with 0.64µm-thick PA-C, followed by RIE to etch away all the surface PA-C. ... 38
Figure 2-8: Parylene deposition process with an in-situ heating setup. Parylene N heated deposition process is shown as one example. ... 40
Figure 2-9: The SIMS data of the depth profiling of parylenes N, C, D, and HT inside PDMS for the deposition at 80°C. (a) The 12C profile represents the PA-N depth profile. (b) The 35Cl profile represents the PA-C depth profile. (c) The
35Cl profile represents the PA-D depth profile. (d) The 19F profile represents
the PA-HT depth profile. 28Si profiles represent PDMS depth profiles. ... 43
heated deposition at 80°C for each type of parylene. (a) PA-N. (b) PA-C. (c) PA-D. (d) PA-HT. ... 45
Figure 2-11: (a) A photo of the experimental setup. (b) The schematic of the 180º peel test. (c) The experimental data of the 180º peel tests for PDMS coated with parylene C, prepared by conventional RT deposition before and after post-deposition thermal annealing, and in-situ heated post-deposition at 80ºC without any post-deposition annealing. ... 47
Figure 2-12: The schematic of parylene deposition into the PDMS pore that is modeled as an infinitely long circular straight tube. The red line represents the parylene thickness profile inside a PDMS pore. The PDMS pore radius is a before parylene deposition, and h x, t as a function of both depth x and time t after deposition. ... 48
Figure 2-13: The theoretical modeling results of the normalized depth profiles of parylene N deposited at (a) room temperature, and (b) 80°C into PDMS pores at different times, compared with the experimental normalized depth profiles. 52
Figure 2-14: The illustration of the microfluidic channel. The channel width w, height h and half-length L/2 are indicated. ... 54
Figure 2-16: The variation of parylene deposition thickness inside microchannels for different dimer types. The right three figures show the photos of the deposited films on the silicon wafers. The scale bar is 1mm. ... 58
Figure 2-17: The variation of parylene deposition thickness inside microchannels for different loading weight of parylene N dimer. The inset figure is the numerical calculation based on the present theoretical model. The right three figures show the photos of the deposited films on the silicon wafers. The scale bar is 1mm. ... 59
Figure 2-18: The variation of parylene deposition thickness inside microchannels for different substrate temperatures. The right three figures show the photos of the deposited films on the silicon wafers. The scale bar is 1mm. ... 60
Figure 2-19: The variation of parylene deposition thickness inside microchannels for different geometric sizes of the channels. The right four figures show the photos of the deposited films on the silicon wafers. The scale bar is 1mm. 61
Figure 2-20: Rhodamine diffusion tests in microchannels made of pure PDMS (upper), PDMS coated with parylene HT at room temperature (middle), and PDMS coated with parylene HT at 60°C (bottom). ... 62
Figure 2-21: The comparison between normal heart and heart with left ventricular noncompaction. ... 64
Figure 2-23: (a) A scanning electron microscope image of a red blood cell. (b) The schematic of a RBC profile with average geometric parameters from 14 healthy subjects. ... 69
Figure 2-24: Whole blood behaves as a non-Newtonian fluid [79]. Whereas plasma has a constant viscosity regardless of the shear rate, the viscosity of whole blood depends on the shear rate of flow. This behavior is largely due to RBCs. ... 70
Figure 2-25: The view of RBCs from normal human blood [77]. In (a), they are seen forming rouleaux (interference microscopy). In (b) and (c), they have been fixed with glutaraldehyde while sheared in a viscometer under a shear stress of (b) 10Pa and (c) 300Pa. ... 71
Figure 2-26: The side view of the microfluidic channel as the capillary pressure-driven viscometer. The liquid column length L t , the velocity distribution u y, t , the mean liquid advancing velocity v t , the channel height h, and the contact angle θ are indicated. The dotted arrow indicates the flow direction. ... 71
Figure 2-27: The meandering microfluidic channel design. (a) Top view. The liquid column length L and the channel width w are denoted. The total length of the microfluidic channel is 10.5cm. (b) Isometric view. The channel width w
and height h are denoted. The fluid flows in the x direction. ... 77
Figure 2-28: (a) The device fabrication process involves two main steps: PDMS molding and PDMS-glass oxygen plasma bonding. (b) A photo of a finished device. ... 78
water advancing velocity v vs. time t. (c) The log-log plot of 1/L versus v. The slope gives the power law exponent n=1.05. (d) The viscosity of water vs. the shear rate at 20°C, using S=14.4 to let the measured water viscosity match with 1.002cP at 20°C. ... 80
Figure 2-30: A finger-stick device is used to obtain a few microliters of human whole blood sample. ... 81
Figure 2-31: The snapshots of human whole blood columns inside a meandering channel with h=60µm and w=240µm at (a) t=0.14s, (b) t=12.02s, and (c) t=73.32s. 83
Figure 2-32: The viscosity measurement of human whole blood in a channel with h=60µm and w=240µm at 20°C. (a) The blood column length L vs. time t. (b) The mean blood advancing velocity v vs. time t. (c) The log-log plot of 1/L versus v, giving n=0.745. (d) The blood viscosity vs. shear rate using
the power law model. Shear rates range from 69.4s-1 to 6642.0s-1. ... 84
Figure 2-33: The snapshots of the liquid columns inside the channels with h=30µm and w=120µm. L is measured by the ruler microfabricated together with the channel. (a) Water. (b) Human whole blood. (c) Adult zebrafish whole blood. ... 86
Figure 2-34: The viscosity measurement of water in a channel with h=30µm and w=120µm at 20°C. (a) The water column length L vs. time t. (b) The mean
Figure 2-35: The viscosity measurement of human whole blood in a channel with h=30µm and w=120µm at 20°C. (a) The blood column length L vs. time t.
(b) The mean blood advancing velocity v vs. time t. (c) The log-log plot of 1/L versus v, giving n=0.82183. (d) The blood viscosity vs. shear rate. Shear rates range from 77.5s-1 to 9868.6s-1. ... 88
Figure 2-36: The viscosity measurement of unadulterated adult zebrafish whole blood in a channel with h=30µm and w=120µm at 20°C. (a) The blood column length L vs. time t. (b) The mean blood advancing velocity v vs. time t. (c) The
log-log plot of 1/L versus v, giving n=0.99814. (d) The viscosity vs. shear rate. Shear rates range from 184.2s-1 to 15399.9s-1. ... 90
Figure 3-1: The eye anatomy. ... 96
Figure 3-2: (a) The device components and placement in the eye. The bag is placed underneath the conjunctiva and rests on the sclera; the cannula penetrates the sclera at the pars plana; the diffuser is placed in the posterior vitreous. (b) An example of a finished device with a cannula length of 12mm. ... 97
Figure 3-3: (a) The fabrication process for the oxygen transporter device. (b) The geometry and dimensions of the device. ... 99
Figure 3-4: A schematic drawing of the experimental setup to measure the oxygen permeability of silicone using the dynamical accumulation method. ... 100
Figure 3-5: A plot of ln pO ‐pO / pO ‐pO vs. time t from a test, in which the oxygen permeability p of the silicone MED4-4210 is determined to be 4.04104µL·µm/(mm2·day·atm). ... 103
Figure 3-6: (a) The four major oxygen transport processes of the oxygen delivery by the device and their corresponding flow resistances. (b) The circuit model for the four oxygen transport processes. The flow resistances R , R , and R are calculated by theory, and R by finite element simulation based on the Fick’s law of diffusion because of the complexity of the eyeball geometry. Oxygen diffusion to the retina through the vitreous turns out the most limiting transport process. ... 105
Figure 3-7: (a) The schematic of the measurement of pO in the eye model with the device exposed to the open air. (b) A photo of the custom setup. ... 107
Figure 3-8: (a) The experimental and simulation results of the pO 3mm away from the diffuser as a function of time for the static eye model and the eye model under 5Hz rotation with amplitudes of 5° and 20°, respectively. (b) The simulation results of pO profiles on the equatorial planes at t=0.8hr (upper) and 11.6hr (lower) for the static case. (c) The simulation results of average flow streamlines on the equatorial (upper) and vertical planes (lower) of the eye model for the 20° rotation. ... 109
Figure 3-9: (a) The schematic drawing of the experimental setup. (b) A photo of the setup. ... 110
Figure 3-11: The experimental data of oxygen consumption rate vs. pO in the vitreous gel of porcine cadaver eyes, curve-fitted by a first-order reaction rate model. ... 112
Figure 3-12: In-vitro porcine cadaver eye experiments. (a) A photo of a porcine cadaver eye with a device mounted into it. (b) The simulation result of the steady pO profile in the equatorial plane of the porcine cadaver eye. And d is the distance between the oxygen sensor tip and the device diffuser. (c) The measurement and simulation data of the pO in the vitreous of a porcine cadaver eye for d ranging from 0 to 5mm. ... 113
Figure 3-13: The anatomy of the human eye. ... 114
Figure 3-14: The schematic of the geometric model of the posterior eye. ... 115
Figure 3-15: The retina anatomy. ... 122
Figure 3-16: The geometric model of the retina. Regions 1, 2, and 3 belong to the outer retina (avascular) while region 4 encompasses the whole inner retina (vascular). ... 123
degrees of retinal ischemia. (c) The pO profile along the line A-C for various degrees of retinal ischemia. ... 129
Figure 3-18: The oxygen profiles in human eyes with diffusers filled up with 1atm of oxygen to treat 40% oxygen loss using ring-shaped diffusers of three different sizes. The three cross-sectional sizes of the ring-shaped diffusers are 1mm in diameter (indicated as 1mm O-ring), 1mm by 2.5mm (indicated as 2.5mm ring), and 1mm by 4mm (indicated as 4mm ring), respectively. 133
Figure 3-19: The oxygen profiles in human eyes with diffusers filled up with 1atm of oxygen to treat 40% oxygen loss using the 1mm O-ring diffusers shown in Figure 3-18, for which we chose three different percentages of surfaces to be sealed by parylene. The three sealing percentages are 0%, 50% and 75%, respectively. ... 134
Figure 3-20: The oxygen profiles in human eyes with diffusers filled up with 1atm of oxygen to treat 40% oxygen loss using the 2.5mm ring diffusers shown in Figure 3-18, for which we chose three different percentages of surfaces to be sealed by parylene. The three sealing percentages are 0%, 50% and 88%, respectively. ... 136
Figure 3-22: The oxygen profiles in human eyes with diffusers filled up with 1atm of oxygen to treat 40% oxygen loss usng ring-shaped diffusers of two different sizes. The two cross-sectional sizes of ring-shaped diffusers are 1mm in diameter (indicated as 1mm O-ring), and 1mm by 2.5mm (indicated as 2.5mm ring). ... 141
Figure 3-23: The oxygen profiles in human eyes with diffusers filled up with 1atm of oxygen to treat 40% oxygen loss using the 1mm O-ring diffusers shown in Figure 3-22, for which we chose three different percentages of surfaces to be sealed by parylene. The three sealing percentages are 0%, 50% and 75%, respectively. ... 142
Figure 3-24: The oxygen profiles in human eyes with diffusers filled up with 1atm of oxygen to treat 40% oxygen loss using the 2.5mm ring diffusers shown in Figure 3-22, for which we chose three different percentages of surfaces to be sealed by parylene. The three sealing percentages are 0%, 50% and 88%, respectively. ... 144
Figure 3-25: The optimal design of the diffuser for the MEMS oxygen transporter device. The ring diameter of the diffuser is 5mm, surrounding the 5mm-wide macula region. The diffuser is partially sealed with parylene such that oxygen can only permeate out at the corner of the diffuser that is closest to the macula. This optimal design can achieve an estimated oxygen delivery efficiency of 50%. ... 146
three-dimensional pO distribution in the eye with a 1mm O-ring-diffuser. (b) The pO distribution in the equatorial plane of the eye with a 1mm O-ring-diffuser. The magnified figure shows the detailed pO distribution in the 5mm-wide macula. The line AC is the middle line in the equatorial plane of the whole eye, and the line AB is the middle line in the equatorial plane of the macula. The point A is at the choroid-macular interface. The point B is at the vitreomacular interface. The point C is at the interface between the vitreous and the posterior lens. (c) The pO profile along the line A-B before and after device implantation. (d) The pO profile along the line A-C before and after device implantation. ... 150
necessary needle injections of oxygen is 13.45 days, and the corresponding optimal OP is OP /20. ... 156
Figure 3-28: A photo of a fabricated device for the in-vivo animal experiments. ... 157
Figure 3-29: The photos of a device implanted into a rabbit eye. (a) The bag part is inserted underneath the conjunctiva. (b) The cannula part penetrates the sclera at the pars plana. (c) The ring-shaped diffuser is placed close to the retina and surrounds the macula. ... 159
LIST OF TABLES
Table 1-1: Global estimate of the number of people visually impaired by age, 2010; for all ages in parenthesis the corresponding prevalence (%) [2]. ... 1
Table 1-2: Number of people visually impaired and corresponding percentage of the global impairment by WHO Region and country, 2010 [2]. ... 2
Table 1-3: International Clinical Diabetic Retinopathy Disease Severity Scale [10]. ... 5
Table 2-1: The summary of the XRD results for parylene C samples deposited from 20°C to 80°C. ... 34
Table 2-2: The summary of the T , the T , and the Young's modulus for parylene C samples deposited from 20°C to 80°C. ... 34
Table 2-3: The experimental data of the Young’s modulus and the WVTR of parylene, PDMS, and the hybrid parylene/PDMS material. A: 92µm-thick PDMS; B: 0.64µm-thick PA-C; C: 0.34µm-thick PA-C; D: 92µm-thick PDMS coated with thick PA-C; and E: 92µm-thick PDMS coated with 0.64µm-thick PA-C, followed by RIE to ethc away 0.3µm-0.64µm-thick surface PA-C. ... 39
Table 2-4: The theoretical results of the Young’s modulus and the WVTR of the hybrid parylene/PDMS material. D: 92µm-thick PDMS coated with 0.64µm-thick PA-C; and E: 92µm-thick PDMS coated with 0.64µm-thick PA-C, followed by RIE to ethc away 0.3µm-thick surface PA-C. ... 39
Table 2-5: The values of the parameters used in eq. (2-15), the parylene chemisorption deposition kinetic model [48]. ... 50
Table 2-7: The measured parameters m and n in the power law model for water at 20°C using a channel with h=60µm and w=240µm ... 81
Table 2-8: The values of the fitting parameters in the Carreau-Yasuda model for non-Newtonian human whole blood at 20°C based on the viscosity measurement in a microfluidic channel with h=60µm and w=240µm. ... 85
Table 2-9: The measurement data for the viscosities of human whole blood at room temperature at different shear rates based on the power law and Carreau-Yasuda non-Newtonian viscosity models, and the published data [81]. ... 85
Table 2-10: The measured viscosities of human whole blood at 20°C at different shear rates based on the power law and Carreau-Yasuda viscosity models, compared with the published data for 45% hematocrit [81]. ... 89
Table 2-11: The estimated values of the fitting parameters in the Carreau-Yasuda model for both human and zebrafish whole blood at 20°C. ... 91
Table 3-1: The values of a and b in the hyperbolic regressions that provide estimates for concentration-dependent rate of ascorbate-mediated oxygen consumption in the vitreous body with different conditions [88]. ... 118
Table 3-2: The equivalency between the vitreous motion velocity and the increasing oxygen diffusivity based on finite element simulation [88]. ... 120
Table 3-3: The list of parameters and their selected values used in the four-layer model for the retina [91]. ... 126
oxygen consumption rates in the inner and outer macula, and the oxygen loss percentage. ... 130
Table 3-5: The oxygen delivery efficiencies of the 1mm O-ring diffusers shown in Figure 3-18, for which we chose 0%, 50% and 75% of surfaces to be sealed by parylene. ... 135
Table 3-6: The flow rates of oxygen from diffusers that goes into the macula for the 1mm O-ring diffusers shown in Figure 3-18, for which we chose 0%, 50% and 75% of surfaces to be sealed by parylene. ... 135
Table 3-7: The oxygen delivery efficiencies of the 2.5mm ring diffusers shown in Figure 3-18, for which we chose 0%, 50% and 88% of surfaces to be sealed by parylene. ... 137
Table 3-8: The flow rates of oxygen from diffusers that goes into the macula for the 2.5mm ring diffusers shown in Figure 3-18, for which we chose 0%, 50% and 88% of surfaces to be sealed by parylene. ... 137
Table 3-9: The oxygen delivery efficiencies of the 4mm ring diffusers shown in Figure 3-18, for which we chose 0%, 50% and 92% of surfaces to be sealed by parylene. ... 139
Table 3-10: The flow rates of oxygen from diffusers that goes into the macula for the 4mm ring diffusers shown in Figure 3-18, for which we chose 0%, 50% and 92% of surfaces to be sealed by parylene. ... 139
Table 3-12: The flow rates of oxygen from diffusers that goes into the macula for the 1mm O-ring diffusers shown in Figure 3-22, for which we chose 0%, 50% and 75% of surfaces to be sealed by parylene. ... 143
Table 3-13: The oxygen delivery efficiencies of the 2.5mm ring diffusers shown in Figure 3-22, for which we chose 0%, 50% and 88% of surfaces to be sealed by parylene. ... 145
Table 3-14: The flow rates of oxygen from diffusers that goes into the macula for the 2.5mm ring diffusers shown in Figure 3-22, for which we chose 0%, 50% and 88% of surfaces to be sealed by parylene. ... 145
Table 3-15: The effects of the retinal blood flow rate bf on the oxygen consumption rates in the inner macula, the oxygen loss percentage, and the minimal pO in the inner macula. ... 148
Table 3-16: The maximal treatable oxygen loss percentage and the corresponding bf for each critical pO and degree of vitreous liquefaction are listed, as well as the corresponding minimal pO in the inner macula before and after device implantation. ... 151
CHAPTER 1
INTRODUCTION
1.1
Introduction to Blindness and Diabetic Retinopathy
The leading causes of chronic blindness include cataract, glaucoma, age-related macular degeneration, corneal opacities, diabetic retinopathy, trachoma, and eye conditions in children (e.g., caused by vitamin A deficiency) [1]. Age-related blindness is increasing throughout the world, as is blindness due to uncontrolled diabetes.
The estimated number of people visually impaired in the world is 285 million, with 39 million blind and 246 million having low vision; 65% of people visually impaired and 82% of all blind are aged 50 and above (Table 1-1) [2].
Table 1-1: Global estimate of the number of people visually impaired by age, 2010; for all ages in parenthesis the corresponding prevalence (%) [2].
Age (in years) Population (millions) (millions) Blind Low Vision (millions) Visually Impaired (millions)
0 – 14 1848.50 1.421 17.518 18.939
15 – 49 3548.2 5.784 74.463 80.248
50 and older 1340.80 32.16 154.043 186.203
The distribution of people visually impaired in the six WHO Regions is shown in Table 1-2 with the percentage of the global impairment shown in parentheses [2]. About 90% of the world's visually impaired live in low-income settings [3].
Table 1-2: Number of people visually impaired and corresponding percentage of the global impairment by WHO Region and country, 2010 [2].
Blind Low Vision Visually Impaired
WHO Region Total population (millions) No. in millions (percentage) No. in millions (percentage) No. in millions (percentage)
African 804.9 (11.9) 5.888 (15) 20.407 (8.3) 26.295 (9.2) The Americas 915.4 (13.6) 3.211(8) 23.401 (9.5) 26.612 (9.3)
Eastern
Mediterranean 580.2 (8.6) 4.918 (12.5) 18.581 (7.6) 23.499 (8.2) European 889.2 (13.2) 2.713 (7) 25.502 (10.4) 28.215 (9.9) South-East Asian
(India excluded) 579.1 (8.6) 3.974 (10.1) 23.938 (9.7) 27.913 (9.8) Western Pacific
(China excluded) 442.3 (6.6) 2.338 (6) 12.386 (5) 14.724 (5.2) India 1181.4 (17.5) 8.075 (20.5) 54.544 (22.2) 62.619 (21.9) China 1344.9 (20) 8.248 (20.9) 67.264 (27.3) 75.512 (26.5) World 6737.5 (100) 39.365 (100) 246.024 (100) 285.389 (100)
Figure 1-1: Global causes of blindness due to eye diseases and uncorrected refractive errors [4].
people diagnosed with diabetes age 18 or older. People with diabetes should have a complete eye exam through dilated pupils at least once a year.
1.1.1StagesofDiabeticRetinopathy
The retina is the light-sensitive tissue at the back of the eye. A healthy retina is necessary for good vision. Diabetic retinopathy is a gluocose-induced microvasuclar disease, leading to progressive damage to the tiny blood vessels that nourish the retina [8]. The damaged blood vessels may swell and leak blood and other fluids, causing clouding of vision [9]. This circulation problems cause retinal tissue to become oxygen deprived, resulting in retinal hypoxia (i.e., lack of oxygen) and irreversible retinal nerve cell degeneration and death. It is a serious sight-threatening complication of diabetes. Diabetic retinopathy usually affects both eyes, leading to significant vision loss if left untreated.
Normal vision and the same scene viewed by a person with diabetic retinopathy are compared in Figure 1-2 [7].
(a) (b)
Diabetic retinopathy has four stages or severity levels [7, 9, 10], which are summarized in Table 1-3 [10]:
1. Mild Nonproliferative Diabetic Retinopathy (NPDR). At this earliest stage, small areas of balloon-like bulges called microaneurysms may protrude from the walls of the retina’s tiny blood vessels.
2. Moderate NPDR. As the disease progresses, some blood vessels that nourish the retina are blocked.
3. Severe NPDR. Many more blood vessels are blocked, depriving several areas of the retina with their blood supply.
4. Proliferative Diabetic Retinopathy (PDR). At this advanced stage, the retina sends signals for nourishment, triggering the growth of new blood vessels that are abnormal and fragile. The new blood vessels grow along the retina and toward the vitreous, the gel-like fluid that fills the inside of the eye. They may leak blood into the vitreous, causing severe vision loss and blindness.
Table 1-3: International Clinical Diabetic Retinopathy Disease Severity Scale [10].
Proposed disease
severity level Findings observable upon dilated ophthalmoscopy
Mild NPDR Microaneurysms only
Moderate NPDR More than just microaneurysms but less than severe NPDR
Severe NPDR
No signs of PDR, with any of the following: 1. More than 20 intraretinal hemorrhages in each of four
quadrants
2. Definite venous beading in two or more quadrants 3. Prominent intraretinal microvascular abnormalities in
one or more quadrants
The classic retinal microvascular signs of nonproliferative diabetic retinopathy are microaneurysms, hemorrhages, hard exudates (lipid deposits), cotton wool spots (accumulations of axoplasmic debris within adjacent bundles of ganglion cell axons), venous dilation and beading, and intraretinal microvascular abnormalities (dilated pre-existing capillaries; Figure 1-3).
Figure 1-3: Non-proliferative diabetic retinopathy. Cardinal signs are retinal microaneurysms, hemorrhages, and hard exudates (A and B); and intraretinal microvascular abnormalities (C, arrow); venous beading (D, arrow); and venous loop formation (E, arrow).
Figure 1-4: Retinal anatomy and mechanisms of proliferative diabetic retinopathy [11]. A normal retina is shown in Panel A, and a retina from a patient with proliferative diabetic retinopathy is shown in Panel B.
always occurs away from the retinal pigment epithelium and toward the vitreous space. There is evidence that both VEGF and PEDF are produced in retinal neurons and in glial cells, such as the cells of Müller [11]. In the normal retina, VEGFR-1 is the predominant VEGF receptor on the surface of retinal vascular endothelial cells, but in diabetes, VEGFR-2 appears on the endothelial-cell plasma membrane (Figure 1-4) [11].
[image:42.612.73.503.293.600.2]The appearance of retinal neovascularization is a hallmark of PDR (Figure 1-5) [12]. Fibrovascular proliferation is a characteristic of advanced proliferative disease.
1.1.2CausesofVisionLossandRiskFactors
Blood vessels damaged from diabetic retinopathy can cause vision loss in two ways [7, 9]:
1. Fluid can leak into the macula, the area of the retina that is responsible for sharp, clear, central vision and allows us to see colors and fine detail. The fluid makes the macula swell, blurring vision. This condition is called macular edema [13]. It can occur at any stage of diabetic retinopathy, although it is more likely to occur as the disease progresses. About half of the people with proliferative diabetic retinopathy also have macular edema.
2. Fragile, abnormal blood vessels can develop and leak blood into the center of the eye, blocking vision. This is proliferative diabetic retinopathy and is the fourth and most advanced stage of the disease. Other complications include detachment of the retina due to scar tissue formation and the development of glaucoma, an eye disease causing progressive damage to the optic nerve. In cases of proliferative diabetic retinopathy, the cause of this nerve damage is extremely high pressure in the eye. If left untreated, proliferative diabetic retinopathy can cause severe vision loss and even blindness.
Pregnant women face a higher risk for developing diabetes and diabetic retinopathy [15]. If gestational diabetes develops, the patients are at much higher risk of developing diabetes as they age.
Everyone with diabetes is recommended to get a comprehensive dilated eye examination at least once a year, since macula edema and proliferative diabetic retinopathy can develop without symptoms, such that patients are at high risk for vision loss.
1.1.3Symptoms
Often there are no visual symptoms in the early stages of diabetic retinopathy. In the later stages, symptoms of the disease may include [9]:
1. Blurred vision. Prolonged periods of high blood sugar can lead to the accumulation of fluid at the lens inside the eye that controls eye focusing. This changes the curvature of the lens and results in the development of symptoms of blurred vision. Blurred vision may also occur when the macula (i.e., the part of the retina that provides sharp central vision) swells from leaking fluid.
1.1.4DiagnosisandDetection
Diabetic retinopathy and macular edema can be detected through a comprehensive eye examination that includes [7, 9]:
1. Visual acuity test. This eye chart test determines the extent to which central vision has been affected.
2. Dilated eye exam. Drops are placed in eyes to widen, or dilate, the pupils. This allows the eye care professional to see more of the inside of eyes to check for signs of the disease. The eye care professional uses a special magnifying lens to examine the retina and optic nerve for signs of damage and other eye problems. 3. Tonometry. An instrument measures the pressure within the eye. Numbing
drops may be applied to eyes for this test.
The eye care professional checks the retina for early signs of the disease, including [7]:
1. Leaking blood vessels.
2. Retinal swelling (macular edema).
3. Pale, fatty deposits on the retina (signs of leaking blood vessels). 4. Damaged nerve tissue.
5. Any changes to the blood vessels.
blood vessels in the retina. The test allows the evaluation and identification of any abnormal blood vessel growth and leaking blood vessels.
1.2
Current Treatments of Diabetic Retinopathy
Treatment of diabetic retinopathy depends on the stage of the disease. During the first three stages of diabetic retinopathy, no treatment is needed, unless macular edema occurs.
1.2.1LaserSurgery
If the disease advances, leakage of fluid from blood vessels can lead to macular edema, which is treated with laser surgery. This procedure is called focal laser treatment (photocoagulation) [7, 9]. Up to several hundred small laser burns are created in areas of the retina with abnormal blood vessels to try to seal the leaks and reduce the amount of fluid in the retina. A patient may need focal laser surgery more than once to control the leaking fluid.
1.2.2Vitrectomy
In more advanced cases such as severe bleeding, a surgical procedure called a vitrectomy may be needed to restore sight by removing significant amount of blood from the center of the eye (vitreous gel) [7, 18]. Retinal detachment, defined as separation of the light-receiving lining in the back of the eye, resulting from diabetic retinopathy, may also require surgical repair [9].
A vitrectomy is performed under either local or general anesthesia. A doctor makes a tiny incision in the eye of a patient. Next, a small instrument is used to remove the vitreous gel that is clouded with blood and replace it with a salt solution to maintain the normal shape and health of the eye. Since the vitreous gel is mostly water, the patient will notice no change between the salt solution and the original vitreous gel. The patient’s eye will be red and sensitive. The patient will need to wear an eye patch for a few days or weeks to protect the eye, and also need to use medicated eyedrops to protect against infection.
1.2.3Anti‐VEGFTherapy
Anti-VEGF therapies are important in the treatment of diabetic retinopathy. They can involve monoclonal antibodies such as bevacizumab, antibody derivatives such as ranibizumab, or orally-available small molecules that inhibit the tyrosine kinases stimulated by VEGF [19]. Both antibody-based compounds are commercialized.
1.2.4SevereDrawbacksofCurrentTreatments
Although current treatments of diabetic retinopathy (i.e., laser treatment, vitrectomy surgery and anti-VEGF therapy) can reduce vision loss, they only slow down but cannot stop the degradation of the retina. Patients require repeated treatment to protect their sight. Once some people develop proliferative diabetic retinopathy, they will always be at risk for new bleeding.
The current treatments also have significant drawbacks. Laser therapy is focused on preserving the macula, the area of the retina that is responsible for sharp, clear central vision, by sacrificing the peripheral retina since there is only limited oxygen supply. Therefore, laser therapy results in a constricted peripheral visual field, reduced color vision, delayed dark adaptation, and weakened night vision [20]. Vitrectomy surgery increases the risk of neovascular glaucoma, another devastating ocular disease, characterized by the proliferation of fibrovascular tissue in the anterior chamber angle [21]. Anti-VEGF agents have potential adverse effects, and currently there is insufficient evidence to recommend their routine use.
1.2.5ProposedOxygenTherapy
In this work, for the first time, a paradigm shift in the treatment of diabetic retinopathy is proposed: providing localized, supplemental oxygen to the ischemic tissue via an implantable MEMS device.
oxygen could improve the retinal oxygenation and prevent the progression of the ischemic cascade (Figure 1-6) [22].
Figure 1-6: Hematoxylin and eosin–stained vertical retinal sections from the region 4 disc diameters below the optic disc, comparing the retinal histology 2 weeks after retinal ischemia [22]. The no treatment eye shows reduced retinal thickness, disorganization, and loss of inner and outer nuclear layers (INL, ONL), loss of inner and outer segments (IS, OS) of the photoreceptors, vacuolization of the ganglion cell layer (GCL), and cell loss and pigment clumping of the RPE. In contrast, the oxygenated eye shows good retinal thickness and well-preserved anatomy compared with the contralateral nonoperated normal rabbit eye. The RPE/choroid is shown at higher magnification in the lower panels. There is prominent choroidal atrophy in the non-treated group, whereas the oxygenated group shows only mild atrophy of the choroidal vasculature. Scale bar, 20µm.
For the first type, the oxygen-rich space is underneath the conjunctiva, a membrane covering the sclera (white part of the eye), beneath the eyelids and highly permeable to oxygen in the atmosphere when the eye is open. Therefore, sub-conjunctival is very high during the daytime. For the second type, the oxygen-rich space is inside the device since pure oxygen is needle-injected into the device on a regular basis.
The proposed MEMS oxygen transporter devices can be also applied to treat other ocular and systemic diseases accompanied by retinal ischemia, such as central retinal artery occlusion, carotid artery disease, and some form of glaucoma.
1.3
Ideal Materials for Medical Implants
1.3.1Parylene
processes compatible with CMOS/MEMS technologies, such as photolithography and oxygen plasma dry etching.
Parylene C Parylene D Parylene N Parylene HT
Figure 1-7: The chemical structures of major types of parylene polymers
Among them, parylene C or poly(chloro-para-xylylene) is the most popular type because of its combination of excellent moisture barrier properties, cost, and accessible processing techniques. These advantages make parylene C a most popular choice for medical implants. The parylene C vacuum deposition process is illustrated in Figure 1-8. First, the powered parylene C raw dimer is vaporized at about 150°C, then the dimeric gas molecules are pyrolyzed at about 690°C and cleaved to monomer form. The chemically unstable and reactive monomer gas is subsequently introduced into an evacuated deposition chamber where it disperses and polymerizes spontaneously on substrate surfaces to form conformal films [24].
Figure 1-8: The parylene C vacuum deposition process [24].
The deposition temperature is usually room temperature (20°C), and the deposition pressure is in the range of 20–100mTorr. In this dissertation, we will study the effects of modification of deposition temperature on the physical properties of parylenes C, D, N, and HT, and study the deposition kinetics both experimentally and theoretically.
1.3.2Silicone
Siloxane PDMS
Figure 1-9: The chemical structure of the siloxane functional group [26], and the polydimethylsiloxane (PDMS) that belongs to the group of silicone [27].
1.4
Layout of the Dissertation
CHAPTER 2 STUDY OF
PAYRLENE AND
SILICONE
2.1
Overview
This chapter reports the study of in-situ deposition temperature (ranging from 20°C to 80°C) effects on the physical properties of parylene C in terms of glass transition temperature ( ), β-relaxation temperature ( ), Young’s modulus, and crystallinity (including crystallite size). The parylene C thin film deposited at higher deposition temperature exhibited higher and , revealing that the movement of molecular backbones was further frozen and restricted. It was consistent with the findings that higher deposition temperature induced greater degree of crystallinity and larger Young’s modulus. With the new knowledge, parylene C thin film with properties tailored to various requirements could be achieved by choosing the appropriate deposition temperature.
and barrier properties of the hybrid parylene/PDMS material is lacking. The repetitive uniaxial tensile tests were performed to characterize its mechanical behaviors and the water vapor transmission rate was measured to evaluate its barrier properties. The experimental data were in very good accordance with the composite material theory. A novel approach of facilitating the diffusion and penetration of parylene coatings into PDMS using in-situ heated deposition is presented. The parylene depth profiling in PDMS was produced using the second ion mass spectroscopy, and 180° peel tests were implemented using a commercial tensile testing equipment, both demonstrating that in-situ heated parylene deposition enhanced the pore sealing capability of parylene. A
theoretical deposition model was proposed, featuring a cylindrical PDMS pore model, a free molecular flow (Knudsen flow) model, and chemisorption deposition kinetics. There was only one unknown parameter in the model, that is, the PDMS pore diameter. By fitting the experimental parylene depth profiling curves to the nonlinear theoretical deposition model, the PDMS pore diameter was estimated to be about 6nm.
The penetration properties of various parylenes into long microfluidic channels were then studied. The work broadly covered the effects of the dimer type (i.e., parylenes C, N, and HT), loaded dimer mass, substrate temperature, and channel size on the penetration length of parylene into the microfluidic channel. Understanding the mechanism underlying parylene penetration into microchannels helps to design and develop the mass-producible inner surface protection process for microfluidic devices.
during a single run. After the device calibration with water, the viscosity measurement of human whole blood resulted in very good agreement with the published data, demonstrating the reliability of the device. The first experimental study on the non-Newtonian viscosity of adult zebrafish whole blood was also produced using this viscometer, and the whole blood viscosity of zebrafish was found smaller than that of human, likely attributed to the smaller hematocrit for zebrafish blood.
2.2
Effects of Deposition Temperature on Parylene Properties
Parylene C has been widely utilized as protective coating for microelectronic devices due to its exceptional properties such as conformal deposition, low dielectric constant, low moisture permeability and chemical stability. It has also become a well-known material for biomedical implants due to its superior biocompatibility [28]. Therefore it is important to fundamentally understand and then hopefully improve the physical properties of parylene C for better device performance and longer-term consistency.
treatment of parylene C has significant disadvantages. For example, annealing of parylene in the air over 120ºC can cause oxidation-induced brittleness to the film, which is detrimental to the robustness of parylene. The deposition temperature effects on the properties of parylene have not been well scrutinized since parylene is conventionally prepared by chemical vapor deposition (CVD) process at room temperature. We have previously found that parylene-on-parylene adhesion could be enhanced by increasing the in-situ deposition temperature [34]. Therefore it is intriguing to further investigate the
effects of deposition temperature on other aspects, such as the viscoelastic properties of parylene. Glass transition (also called -relaxation) is the primary relaxation process in amorphous polymers, associated with the cooperative segmental motions of the polymer backbone. The physical properties of polymers such as mechanical, electrical, and optical properties may be a strong function of glass transition temperature ( ), and change abruptly at . Polymers with amorphous phase can also exhibit a lower-temperature relaxation process usually referred to as the -relaxation process. This has been suggested to be associated with the localized conformational motion of the chain section of the size comparable with the Kuhn’s segment (the correlation part of the chain) [35]. It merges with the glass transition at temperatures somewhat above .
measurement data were summarized, including comparisons between thin films deposited at different temperatures.
2.2.1SamplePreparation
[image:59.612.110.543.382.657.2]The in-situ heating setup for parylene C deposition at elevated temperatures is schematically shown in Figure 2-1. Parylene C film was deposited onto a fresh silicon wafer while the silicon substrate was heated up during the deposition. The feedback from the heater based on a temperature sensor assisted in the adjustment of the power through a thermal controller to maintain the setting point. Four setting points of temperatures were chosen, which were 20°C (room temperature, thus not necessarily using the in-situ heating capability), 40°C, 60°C, and 80°C.
Because of the exponential decay of deposition rate with deposition temperature [34], it took much longer time to accumulate thickness at higher deposition temperature. So the 20°C and 40°C samples had thicknesses of about 9µm, while the 60°C and 80°C samples were about 3µm in thickness. Nevertheless, comparisons can still be made regardless of different thicknesses because the physical properties studied here are almost thickness-independent [36].
2.2.2Experiments,TestingResultsandDiscussion
2.2.2.1DMA Tests
Dynamical mechanical analysis (DMA) was performed using a commercial analytical instrument (DMA Q800, TA Instruments) to measure . The uniaxial tensile tests were also produced with the same instrument. For DMA and uniaxial tensile tests, parylene C films were cut into strips with a width of 5.8mm and a length of 8mm. Figure 2-2 shows the plots of the storage modulus ′ in response to the applied sinusoidal oscillation of the strain at 1Hz versus the measurement temperature for the 20°C, 40°C, 60°C, and 80°C samples.
temperature is denoted as _ , which is determined from the major inflection point on the - curve,
′
_
0. (2-1)
Figure 2-2: The DMA data of storage modulus ′ vs. measurement temperature at 1Hz for parylene C deposited at 20-80°C ( _ corresponds to the major inflection point of each curve).
curves for 9µm-thick films are a little bit higher than those for 3µm-thick films since the elastic modulus increases slowly with thickness.
2.2.2.2Dielectric Measurement
The impedance spectroscopy was used to perform the dielectric measurement. The 20°C, 40°C, 60°C, and 80°C parylene C samples were sandwiched between electrically conductive silver pastes that were dried at room temperature. Thus the undesired thermal effects from the conventional metal deposition process could be prevented.
The impedance of a material is complex in nature,
∗ i ", (2-2)
where ∗ is the complex impedance, and ′ and " denote the real part and the negative imaginary part of the complex impedance ∗, respectively.
From the measurement of the complex impedance, we can derive the complex relative permittivity ∗ of parylene,
∗ 1
i2 ∗, (2-3)
, (2-4)
where is the measurement frequency, is the equivalent capacitance of the free space, is the vacuum permittivity, 8.85×10⁻¹² F/m, and and are the surface area and the thickness of parylene C film, respectively.
∗ i ". (2-5) Based on eqns. (2-3) - (2-5), we can derive the following formulas for and ",
"
2 ′ " , (2-6)
" ′
2 ′ " . (2-7)
is also called the dielectric constant. Figure 2-3 shows the plots of versus the measurement temperature for parylene C samples.
_ denotes the -transition temperature measured from the - curve, determined from the major inflection point on the - curve,
′
_
0. (2-8)
The -relaxation mechanism for parylene C is that is low below _ since the rotational motion and the orientation polarization of C-Cl dipoles are restricted, with a big increase around _ [37].
For a higher deposition temperature, was also increased for both measurement frequencies, indicating that the thermal energy required for the activation of large localized C-Cl bond motions was increased as a result of more stabilized molecular arrangement and conformation. The higher-frequency curves are to the right and the bottom of the lower-frequency curves, because at a high frequency, the polar C-Cl bond has less time to align with the external electric field, so that the dielectric constant is smaller and the -relaxation occurs at a higher temperature.
2.2.2.3XRD Tests
The film crystallinity was studied by X-ray diffraction (XRD) using a diffractometer (Philips X’Pert PRO MRD Diffractometer).
The XRD spectra with the 2 ranging from 10° to 18° are presented in Figure 2-4. The XRD spectra show peaks at 2 equal to about 14º for all tested samples. The peak has been suggested to correspond to the (020) crystal plane [33]. The crystallite size is calculated using the Scherrer’s formula,
0.9
where is the wavelength of the X-ray beam, 1.5406 Å, is the Bragg angle, and is the full width at half maximum (FWHM) of the peak.
Figure 2-4: The XRD spectra for parylene C samples deposited at 20-80°C. The peak represents (020) plane of the monoclinic unit cell.
2.2.2.4Uniaxial Tensile Tests
Figure 2-5: The uniaxial tensile test results of parylene C films at a strain loading rate of 1%/min. The Young's modulus is thickness-dependent, so the results for 3µm-thick films deposited at 20ºC, 60ºC and 80ºC are grouped on the top, and the results for 9µm-thick films deposited at 20ºC and 40ºC grouped at the bottom.
four samples prepared in the same condition were tested, and the results were averaged. The Young’s modulus was determined from the slope of the elastic linear section of a stress-strain curve, which was after an initial toe region and before the yielding point. The Young's modulus is thickness-dependent, so the groups of stress-strain curves for 3µm-thick and 9µm-thick films are shown on the top and at the bottom of Figure 2-5, respectively.
The crystalline phase of parylene C features strong interactions between conjugated aromatic rings and thus a high elastic modulus. When the crystallites formed by ordered chains grow larger and larger, more phenyl groups are involved in the strongly attractive intermolecular interaction. So the greater Young’s modulus is also a result of the higher degree of crystallization.
2.2.2.5Discussion
The results of the , the , the XRD scanning data, and the Young’s modulus for parylene C samples deposited at 20ºC, 40ºC, 60ºC, and 80ºC are summarized in Table 2-1 and
interaction barriers to achieve sufficient segmental motion for conformational transition, resulting in higher and . Based on these new data, we conclude that it is possible to tailor parylene C’s properties to specific requirements by choosing the right deposition temperature. For example, depositing parylene C at a higher temperature gives a higher so that the film can operate at higher temperature without additional annealing, which can avoid the undesired oxidation of parylene C and the significant degradation of the mechanical properties.
Table 2-1: The summary of the XRD results for parylene C samples deposited from 20°C to 80°C.
Deposition
Temperature (°C) ° FWHM (° ) -spacing (Å) Crystallite size (Å)
20 14.07 1.19 6.29 67.3
40 13.92 0.91 6.36 88.0
60 13.89 0.73 6.37 109.7
80 13.98 0.65 6.33 123.2
Table 2-2: The summary of the , the , and the Young's modulus for parylene C samples deposited from 20°C to 80°C.
Deposition
temperature (°C) Thickness (µm) _
(°C) @1Hz
_ (°C) Young’s modulus (GPa) at a strain
rate of 1%/min 100Hz 10KHz
20 9 52.7 50.2 72.1 2.90
40 9 61.2 55.4 79.8 3.01
20 3 N/A 2.59
60 3 88.8 63.8 90.2 2.80
2.3
Hybrid Parylene/PDMS Material
Parylene is widely used in various industries because of its many excellent properties, such as the superior barrier property used to protect electronic devices against damages from moisture and corrosive etchants [38-40]. The hybrid parylene/PDMS material has also been investigated, such as parylene-caulked PDMS [41, 42] and parylene coatings inside PDMS microchannels [43], attempting to take advantage of the excellent barrier property of parylene. However, the mechanical behavior such as the uniaxial tensile stress-strain relation and the barrier property such as the water vapor transmission rate (WVTR) of the hybrid parylene/PDMS material have not been well documented. The understanding of these properties will be very important to the design and the application of this hybrid parylene/PDMS material.
pore at elevated deposition temperatures. The enhanced pore sealing capability of parylene at elevated deposition temperatures was verified by experiments.
2.3.1MechanicalBehavior
(a)
[image:70.612.169.407.177.599.2](b)
In order to investigate the mechanical behavior of the hybrid parylene/PDMS material, we first prepared 92µm-thick PDMS (Sylgard 184, Dow Corning, base:curing agent=10:1 by weight, cured at 70°C for 75min) samples coated with 0.64µm-thick parylene C (PA-C). Reactive ion etching (RIE) was performed to etch away 0.3µm-thick surface PA-C of the samples. Reiterated uniaxial tension tests were performed using a commercial tensile testing machine (DMA Q800, TA Instruments).
In each iteration, the sample was loaded till the strain was reached, then relaxed, preparing for the subsequent loading till the strain > was reached. Stress-strain relations for the hybrid parylene/PDMS samples before and after the RIE etching are shown in Figure 2-6.
2.3.2BarrierProperty
Based on the composite material theory, the Young’s modulus of the hybrid parylene/PDMS material is given by the “rule of mixtures”,
, (2-10)
and the WVTR of the hybrid material is given by,
1 1 1
, (2-11)
[image:72.612.160.414.356.562.2]where , , and are the Young’s modulus, the WVTR, and the thickness of PA-C, respectively, and , , and are the Young’s modulus, the WVTR, and the thickness of PDMS, respectively.
The experimental data of the Young’s modulus and the WVTR of parylene, PDMS and the hybrid parylene/PDMS material are summarized in Table 2-3, and the theoretical results of the Young’s modulus and the WVTR of the hybrid material are summarized in Table 2-4. Here, the experimental result of the Young’s modulus of the hybrid parylene/PDMS is calculated from the stress-strain curve for the first iteration in the repeated uniaxial tensile test run.
Table 2-3: The experimental data of the Young’s modulus and the WVTR of parylene, PDMS, and the hybrid parylene/PDMS material. A: 92µm-thick PDMS; B: 0.64µm-thick PA-C; C: 0.34µm-0.64µm-thick PA-C; D: 92µm-0.64µm-thick PDMS coated with 0.64µm-0.64µm-thick PA-C; and E: 92µm-thick PDMS coated with 0.64µm-thick PA-C, followed by RIE to ethc away 0.3µm-thick surface PA-C.
Physical property A B C D E
Young’s modulus (MPa) 0.82 1902 1780 13.52 7.15
WVTR (g/m2/day) 708.1 132.7 254.8 102.8 180.1
Table 2-4: The theoretical results of the Young’s modulus and the WVTR of the hybrid parylene/PDMS material. D: 92µm-thick PDMS coated with 0.64µm-thick PA-C; and E: 92µm-thick PDMS coated with 0.64µm-thick PA-C, followed by RIE to ethc away 0.3µm-thick surface PA-C.
Physical property D E
Young’s modulus (MPa) 13.95 7.37
The experimental data of the mechanical and the barrier properties of the hybrid parylene/PDMS material agree very well with the results derived from the composite material theory, suggesting that the parylene coatings inside PDMS pores contribute very little to the macroscopic mechanical or barrier properties of the hybrid parylene/PDMS material.
2.3.3EnhancedParylenePenetrationintoPDMS
2.3.3.1Experimental Results
[image:74.612.73.505.351.619.2]A closed-loop temperature control system was built and put inside a parylene coater (PDS 2035CR, Specialty Coating Systems, Inc) as shown in Figure 2-8.
![Figure 1-4: Retinal anatomy and mechanisms of proliferative diabetic retinopathy [11]](https://thumb-us.123doks.com/thumbv2/123dok_us/308354.1032089/41.612.108.542.72.405/figure-retinal-anatomy-mechanisms-proliferative-diabetic-retinopathy.webp)
![Figure 1-5: Proliferative diabetic retinopathy [12]. Neovascularization, a hallmark of](https://thumb-us.123doks.com/thumbv2/123dok_us/308354.1032089/42.612.73.503.293.600/figure-proliferative-diabetic-retinopathy-neovascularization-hallmark.webp)
![Figure 1-8: The parylene C vacuum deposition process [24].](https://thumb-us.123doks.com/thumbv2/123dok_us/308354.1032089/52.612.72.507.71.407/figure-parylene-c-vacuum-deposition-process.webp)