Internet Journal of Criminology © 2007
ANY NUMBER YOU WANT?
THE IMPACT OF DATA CLEANING
ON INTERNAL VALIDITY
By Aidan Wilcox
Abstract
Concerns about the internal validity of reconviction studies tend to focus on factors such as initial comparability of groups. Often overlooked is the impact that data preparation can have. Data preparation refers to the decisions taken by researchers regarding which offenders to retain in the sample for analysis. Using data relating to a sample of offenders in two police forces, it is shown that these decisions, even when applied equally to both groups, can impact differentially on reconviction rates, weakening a study s internal validity. Implications of the findings are considered and recommendations made to improve the transparency of the process.
Internet Journal of Criminology © 2007
www.internetjournalofcriminology.com 2
Introduction
In recent years the government has expressed a commitment to be guided by the evidence in criminal justice policy-making (e.g. Blunkett 2000), and this has come to be known as the what works approach (in contrast to the nothing works pessimism of the 1970s and 1980s). What the government means by what works is whether an intervention or policy successfully reduces crime, whether at the level of society, community or the individual. For interventions that seek to reduce crime by targeting individuals (rather than places, as in situational crime prevention), the reconviction study is the methodology of choice when it comes to assessing the question has it
worked? i The present what works era, which arguably began in 1998 (Wilcox 2005),
has been characterised by a significant increase in both funding for programmes aimed at changing offending behaviour,ii and reconviction studies commissioned to test their effectiveness.iii
As in any type of evaluation, a key concern for those commissioning and using research has been the strength of the research design. There are several criteria against which a research study could be judged; for example in the quality of the reporting of its data (descriptive validity), the generalisability of its findings (external validity) or the extent to which operational definitions of variables adequately reflect their theoretical constructs (construct validity) (Farrington 2002). However, for research which aims to ascertain whether an intervention (e.g. restorative justice) has reduced reconviction rates, internal validity is the prime concern. Internal validity addresses the truth of the question as to whether the intervention caused the outcome (Cook and Campbell 1979). In other words an internally valid reconviction study is one which is able to demonstrate a cause-effect relationship. In order to establish such a relationship, the researcher must be able to rule out plausible alternative explanations for the outcome, which are known as threats to validity.
It is worth briefly explicating the different threats to internal validity before considering how data cleaning might pose such a threat. Let us assume that a reconviction study involves, as a minimum, a treatment or intervention (for example, restorative cautioning), an outcome measure (in this case reconviction), and some form of comparison between different treatment conditions in order to allow an inference about the treatment to be drawn. Bias can be introduced to the results due to initial non-comparability of the groups, methods of analysis, or through attrition which is explained in-depth below. Specifically, the main threats to validity are as follows: iv
History. One way in which groups may differ is in their exposure to events other than the intervention, in which case, it may be that this history event may be responsible
Internet Journal of Criminology © 2007
Maturation. Whereas history refers to a particular event which groups may encounter,
maturation concerns normal, developmental processes occurring within them (Trochim 2000). We know from criminal career research (e.g. Farrington 1997), that offending is not constant throughout the life course, and tends to increase in late adolescence and decline through the twenties. It would be a maturation threat to validity, therefore, if individuals in the comparison and intervention groups were at different stages of their criminal careers.
Regression. Regression simply means that left to themselves things tend to return to
normal. An individual s involvement in offending tends to oscillate, such that periods of high offending are generally followed by lower rates of offending, regardless of any outside intervention (Maltz 1984). Treatment and comparison groups may experience different rates of regression to the mean simply because they were at different stages of this cycle to begin with, rather than because the intervention worked.
Instrumentation. There may be more than one way to measure the outcome of interest.
If different measures (instruments) are used for the intervention and comparison groups, then differences in outcome may be due to differences in the test rather than to the intervention itself. The two main sources of reconviction data are the Offenders Index (OI) and the Police National Computer (PNC) and they are known to vary in their completeness and accuracy (Francis, Crosland and Harman 2002). In the (admittedly unlikely event) that the OI were used to calculate a reconviction rate for the intervention group, while the PNC were used for the comparison group, this could threaten the internal validity of the study.
Attrition. Intervention attritionv generally refers to loss of cases in a study due to participants dropping out of the intervention, the danger being that those who drop out differ in some significant way from those who do not. For example, those who drop out of an anger management programme may be less motivated to desist from crime than those who attend. If rates of intervention attrition differ between intervention and comparison groups, it would be misleading to compare reconviction rates only of those who completed (Farrington 2002). One can protect against this attrition threat by including in the analysis all those originally assigned to the intervention and the
comparison groups when comparing reconviction rates.vi However, the higher the rate
of intervention attrition, the harder it becomes to detect a statistically significant effect of the intervention (if one exists).
There is a second type of attrition, which I term data attrition (Wilcox 2005), in which individuals are excluded from the study by the researchers, due to concerns about the accuracy of the data held on them. As in intervention attrition, it is possible that those excluded have different characteristics from those included. However, because they are excluded from the analysis, one cannot calculate their reconviction rate. Thus there is no way to guard against the threat to validity that data attrition poses (except to try to minimise its extent in the first place). It is this second type of attrition which is the concern of this article, and it is explained further below.
Social interaction threats. Due to the fact that social research involves reflexive
Internet Journal of Criminology © 2007
www.internetjournalofcriminology.com 4
itself (Cook and Campbell 1979). Resentful demoralisation or compensatory rivalry may result if one group becomes aware that it is receiving a less favourable treatment than another. Alternatively those involved with providing the less favourable treatment may try to compensate the offenders in some way. Such social interaction threats have been observed in a number of criminological experiments (e.g. Clarke and Cornish 1972).
The threats to internal validity are well known, and the seminal work of Cook and Campbell (1979) regarding social science research has been updated for criminological research (e.g. Farrington 2002). This has been accompanied by encouragement from the Home Office and other funding bodies to evaluators to adopt a more experimental approach. In their research standards for reconviction studies, the Home Office emphasises the importance of ensuring comparability between intervention and comparison groups (Home Office 2004). However, what is notable in both the academic literature and official documentation is that the possibility that data attrition may affect internal validity is not mentioned. This is perhaps because it is perceived as unlikely; in order to threaten internal validity the procedures for cleaning data would have to result in different rates of attrition (and reconviction) in the two groups. The assumption has been that as long as the same procedures are adopted for both groups this will not happen. The reasonableness of this assumption is tested in this article.
One of the reasons for conducting this research was that the possibility that data cleaning could affect internal validity had been raised by an evaluator I interviewed as part of my doctoral research (Wilcox 2005). In the interview she noted that the decisions she had taken regarding data cleaning affected the overall reconviction rate:
In the [ ] study I had six categories of cases, according to how sure I was about the accuracy of the match. I could have had any number in the final sample depending on which matching criteria were applied and I found they all gave different [reconviction] rates.vii
Internet Journal of Criminology © 2007
What is meant by data cleaning?
Data cleaning is the process by which the researcher decides which cases to keep in the final sample. This is based on the degree to which the cases appear to be accurate. For those unfamiliar with reconviction data, it might seem strange that the data need any cleaning or preparation before the statistical analysis can be carried out. It is worth, therefore, explaining briefly where reconviction data come from, and the potential sources of inaccuracy in them.
As mentioned above, the two main sources of reconviction data are the Offenders Index and the PNC. The process of obtaining the data are similar in both cases, in that researchers need to provide certain identifying variables, including the offender s name, gender and date of birth so that they can be traced. The reconviction data which are returned are messy and complex, reflecting the reality of offenders criminal careers. In the raw output from the OI or PNC, each offence for which someone is convicted or cautioned results in one row on a spreadsheet, containing details of the
offence and disposal.viii Depending on how many offences they have been sanctioned
Internet Journal of Criminology © 2007
www.internetjournalofcriminology.com 6
Methodology
In order to test the effect of data preparation on reconviction rates a random sample of 1000 intervention and 1000 comparison group cases from an evaluation of restorative cautions conducted by the author and colleagues (Wilcox, Young and Hoyle 2004) was selected.ix The cases were taken from the original reconviction data file sent by the Home Office, i.e. they had not yet been cleaned or prepared in any way. The file contained only those cases which Home Office staff had been able to trace on the
PNC on the basis of the identifiers sent to them.x It was decided to select 1000 cases
for each group as this would provide sufficient numbers for the different methods of data preparation to be carried out, and yet would be small enough so that the data could be prepared manually where needed (i.e. without the use of syntax).xi The dataset was anonymised by removing the names of the offenders. As mentioned in footnote 9, PNC data contain over 30 variables, most of which were irrelevant for the purposes of the current study (e.g. court at which offender was sentenced), and these were removed.
Internet Journal of Criminology © 2007
Results
The first calculation of reconviction rates is for offenders for whom we are most certain that the data are accurate. This is therefore based on offenders for whom the date of caution as recorded in the local police database exactly matches one of the dates of caution in their criminal history as recorded in the PNC. Adopting this criterion leaves us with a sample of 829 and 914 cases in the intervention and comparison groups respectively; the reconviction rates of these groups are 18.9 and 26.0 per cent. This first comparison shows that there is a far higher rate of attrition in the intervention group (17.1%) than in the comparison group (8.6%) (reasons for this are discussed later).
The question arises as to whether cases which do not match exactly should be included in the analysis. There could be two reasons why cases do not match. The first is that the reconviction data contained on the PNC does not in fact relate to the individual of interest. Although they have already been matched on name and date of birth, it is possible that they are not the same individual, and should therefore be excluded. The second possibility is that the reconviction data held on them are incomplete. It may have been that details of the target caution were incorrectly recorded on one or both of the databases,xiii or even not recorded at all. This means it would not be possible accurately to determine whether they have been reconvicted, and again such cases arguably should be excluded. On the other hand, it could be argued that insisting on an exact match between the two data sources (PNC and police records of cautions) is too stringent, and that the dates of some of the cautions may have been entered onto the PNC a day or so out. There is no right answer as to whether one should include only exact matches or close matches, and it is precisely this grey area which is the subject of the article. When researchers make decisions as to the acceptable parameters, they are also implicitly accepting that the rates of data attrition, and, as we shall see, of reconviction may differ as a result.
If we widen the criteria so that any caution recorded on the PNC within a day of the intervention date is included, a further 27 individuals are located (interestingly, 26 of these are from the intervention group), and the reconviction rate of the intervention group increases by 0.3 percentage points.
Obviously one can widen the criteria even further in an attempt to reduce the level of data attrition. Thus, if one decides that any caution recorded on the PNC within one month of the date of intervention is a match , then the sample size increases to 876 and 925 cases in the intervention and comparison groups, while the reconviction rates increase to 19.9 and 26.2 per cent respectively. One can further increase the sample size by substituting for those offences where the date of offence was missing, the date
of conviction this adds only nine more offenders (eight of whom were in the
intervention group).
Internet Journal of Criminology © 2007
www.internetjournalofcriminology.com 8
[image:8.595.53.543.319.455.2]example, a caution date may have been incorrectly entered on one database as 03/01/1999 instead of 03/11/1999, and this would not be identified as matching the intervention caution date if one used syntax which simply looked for cautions within a month either side of the target date. For this reason, a visual comparison was made of the remaining cases where there was no match within one month of the target date, and a judgment was made as to whether the case should be included (the example above was included). Such visual comparisons resulted in the addition of a further eight cases which had not been picked up by other methods, resulting in samples of 891 and 927 and reconviction rates of 20.8% and 26.3% in the intervention and comparison groups respectively.
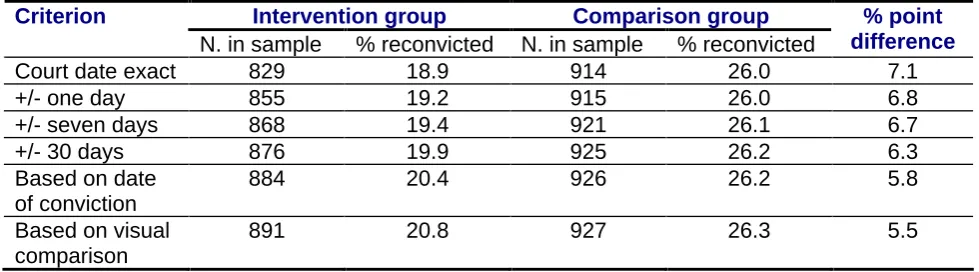
Table 1 summarises the results of the analyses previously described, and gives the sample size and reconviction rates for both groups.
T ABLE 1
Summary of results: sample size and reconviction rates by type of analysis
Intervention group Comparison group Criterion
N. in sample % reconvicted N. in sample % reconvicted
% point difference
Court date exact 829 18.9 914 26.0 7.1
+/- one day 855 19.2 915 26.0 6.8
+/- seven days 868 19.4 921 26.1 6.7
+/- 30 days 876 19.9 925 26.2 6.3
Based on date of conviction
884 20.4 926 26.2 5.8
Based on visual comparison
891 20.8 927 26.3 5.5
The first point to note is that even though identical procedures were applied to both groups, the rate of data attrition varied significantly. For example, 17.1% of cases in the intervention group could not be matched exactly, compared to just 8.6% in the comparison group. Thus even before any variations of approach to data cleaning were made, a differential rate of attrition existed.
Internet Journal of Criminology © 2007
The second finding from the table is that the difference in reconviction rates between the two groups varies according to which data cleaning criteria have been applied. For example, in the intervention group, the reconviction rate increased from 18.9% for exact matches to 20.8% for manual matches (an increase of 1.9 percentage points). By contrast, in the comparison group the respective rates changed from 26.0% to 26.3% (an increase of just 0.3 percentage points). This is because most of the additional cases included as a result of relaxing the criteria were from the intervention group, and most of these were also reconvicted. As can be seen from the final column, this meant that the difference in reconviction rates between the two groups declined from 7.1 to 5.5 percentage points, a decrease of 1.6 percentage points. While this may not seem a particularly large difference, the fact there is any difference at all provides evidence that data cleaning can reduce internal validity. Secondly, if one considers that interventions may reduce reconviction rates by just a few percentage points, it is clear that the spurious difference caused by data cleaning could result in a failure to detect a real intervention effect, or alternatively, result in the detection of an effect where one does not exist. The smaller the sample size of a study, the more likely this is to be a problem.
Internet Journal of Criminology © 2007
www.internetjournalofcriminology.com 10
Qualifications
Before considering the implications of the results, it should be noted that there are a number of potential limitations to the analysis. Firstly, the results are derived from the data set of one reconviction study relating to just two police forces, and it is possible that these results are unique to these two forces. However, the findings of the Home Office (2005) report referred to in the previous section suggest that this is unlikely to be an isolated example.
Secondly, the analysis was based on PNC data, and may not be generalisable to the other main source of reconviction data the Offenders Index. Again, there is no reason to believe that this should be the case. Following a comparison of the two data sources, Friendship et al found that neither source proved more reliable (Friendship et al 2001, p. 21). What we do not know, of course, is whether a greater or lesser effect would have been found had OI data been used instead.
Thirdly, the analysis presented above represents a considerably simplified version of the reality of conducting reconviction studies and of the impact that data attrition can have. I have concentrated solely on the effect that data cleaning by researchers can have on data attrition. I have not explored the attrition which can occur before researchers obtain their data. In the case of the reconviction study on which this analysis is based (Wilcox et al 2004), a substantial proportion of cases (between 12.7 and 17.7 per cent, depending on the police force) were lost to analysis because the Home Office PNC section were unable to trace some offenders on the basis of the identifiers (name, date or birth and PNC number) we had supplied. Given what we know about the characteristics of those lost to analysis (above), it is a distinct possibility that the attrition occurring at this early stage further reduces internal validity.
Finally, it should be recognised that the generalisability of these findings is somewhat limited, as this type of threat to validity is not inevitable. It is only likely to occur in studies where the intervention and comparison groups originate from different administrative areas; in other words where data relating to the two groups are collected by different organisations or branches of organisations. In the example used here they were different police forces. Similarly if the groups were from different probation service areas or local authorities one might expect to see a similar effect. However, if both groups were from the same area, as might be the case in a randomised trial, for example, data attrition would be a less plausible threat to internal validity. Although the analysis here related to reconviction studies, the threats to internal validity demonstrated here could apply to other types of evaluation which depend on the accuracy of different datasets. For example, many situational crime reduction initiatives are evaluated using geographic information systems (GIS) in which the geographic locations of crimes are compared to the locations of crime prevention initiatives such as CCTV (Hirschfield, 2005). Errors in either dataset could threaten internal validity in much the same way as in reconviction studies.
Internet Journal of Criminology © 2007
Internet Journal of Criminology © 2007
www.internetjournalofcriminology.com 12
Conclusions, Implications for research, and the way forward
Maltz noted over 20 years ago that: There are so many possible variations in the method of computing recidivism that one doubts if more than a handful of the hundreds of correctional evaluations are truly comparable (1984, p. 22). Seemingly, this finding holds true today: data preparation can make a difference to the reconviction rate. This may not necessarily be a large one, but the fact remains that even if identical criteria are applied to both groups, the rates of attrition and thus reconviction of one may be more affected than the other. This poses a threat to internal validity. The threat is likely to be significant if the overall differences in reconviction rates between groups are not themselves very large. In such cases data cleaning could result in a spurious finding of a treatment effect (or an obscuring of a real treatment effect).
The findings of this study have a number of implications for the conduct and interpretation of reconviction studies. Firstly, researchers should be more cautious when making comparisons between the reconviction rates of different studies. We have seen that the assumption that the reconviction rate is unaffected by data cleaning is not a valid one. In a reconviction study of final warnings, for example, the reconviction rates of offenders in four youth offending teams were compared to the reconviction rates of a national sample of cautions, and the authors argued it is our view that this national sample of cautions is a reasonable comparison group and will offer appropriate indications of the success of otherwise of final warnings in preventing offending (Hine and Celnick 2001, p. 7). Given that the reconviction rates of the final warnings and cautions were calculated by two different sets of researchers, and that the groups were from different geographical areas, the validity of such an assumption is questionable.
Secondly, if readers of a reconviction study are to be able to assess whether data attrition is a likely threat to validity, then the researchers conducting it need to be more explicit about the decisions they have made regarding data cleaning. In essence, this is a call to improve the descriptive validity (quality of reporting) of reconviction studies. When writing up the methodology, it should be noted, for example, whether cases that did not match exactly were excluded; whether cases were checked visually or only through syntax, and so on. Indeed, it would be a good idea for researchers to provide a range of reconviction rates (and associated rates of attrition) based on different methods of data cleaning. If a statistically significant treatment effect was found for each, then one could have more confidence in the results.
Internet Journal of Criminology © 2007
Internet Journal of Criminology © 2007
www.internetjournalofcriminology.com 14
End Notes
i
Reconviction data, on which reconviction studies are necessarily reliant, have well known limitations (Maltz 1984), not least of which is the fact that reconvictions represent an
unknown, but smaller proportion of the amount of re-offending. However, alternative sources of data, such as offender self-report, also have weaknesses (Junger-Tas and Marshall 1999).
ii
The £400m Crime Reduction Programme, which ran from 1999-2002, is one example.
iii
In the six years 1993-1998, the Home Office published six reconviction studies, compared to 32 in the six years 1999-2004 (Wilcox 2005).
iv
In addition to the threats discussed in the main text, there is also a testing threat, in which the fact that a group took a pre-test causes an observed difference on the post test. In other words individuals may perform better on a post-test not because of the effect of the intervention, but because the pre-test primed them to perform better at the second time of testing (Cook and Campbell 1979). IQ tests are a good example of this. However, in
reconviction studies, testing is not a plausible threat, because the measurement of the outcome (reconviction) is carried out without the involvement of the offender (i.e. through official records). In other words, the fact of measuring someone s previous convictions is unlikely to affect their rate of subsequent convictions.
v
The term intervention attrition is used in preference to attrition, to distinguish from data attrition (see below).
vi
In medicine, this is known as intention to treat analysis.
vii
Interviews were conducted under condition of anonymity.
viii
With PNC data, each offence (row) generates over 30 variables, including type, length and size of disposal, name and offence group of the offence and date of offence, charge and conviction. A similar number and type of variables are produced in OI output.
ix
Using the random sample function in SPSS.
x
In fact, the Home Office had not been able to trace around one fifth of the cases. Non-tracing is another source of data attrition. The importance of this point is discussed in the conclusion.
xi
Syntax is computer code used to manipulate or analyse data. An example might be to recode age recorded in years to a variable containing five age bands.
xii
Similar results obtain if the period selected is 24 months, although evidently the reconviction rates are higher.
xiii
There is no reason to believe that one database is more accurate than the other.
xiv
Internet Journal of Criminology © 2007
REFERENCES
Blunkett, D. (2000) Influence or Irrelevance? Can Social Science Improve
Government? Secretary of State s ESRC Lecture 2 February 2000 London: DfEE.
Cook, T.D. and Campbell, D.T. (1979) Quasi-experimentation: Design and Analysis
Issues for Field Settings, Chicago: Rand McNally College.
Clarke, R.V.G. and Cornish, D.B. (1972) The Controlled Trial in Institutional
Research Paradigm or Pitfall for Penal Evaluators? (Home Office Research Study
15), London: HMSO.
Farrington, D.P. (2002) Methodological Quality Standards for Evaluation Research Paper Represented at the Third Annual Jerry Lee Crime Prevention Symposium, University of Maryland.
Farrington, D.P. (1997) Human Development and Criminal Careers in: M. Maguire, R. Morgan and R. Reiner (Eds.), The Oxford Handbook of Criminology, Oxford: Oxford University Press.
Francis, B., Crosland, P. and Harman, J., (2002) The Police National Computer and
the Offenders Index - Can They be Combined for Research Purposes? Home Office:
London.
Friendship, C. et al, (2001) Reconviction: A Critique and Comparison of Two Main Data Sources in England and Wales , Journal of Legal and Criminological
Psychology 6, 121-129.
Hine, J., and Celnick, A. (2001) A One Year Reconviction Study of Final Warnings. London: Home Office.
Hirschfield, A. (2005) Analysis for Intervention in: N. Tilley (Ed.) Handbook of
Crime Prevention and Community Safety, Cullompton: Willan Publishing.
Home Office (2004) Home Office RDS and YJB Standards for Reconviction Studies London: Home Office.
Home Office (2005) Code of Practice: The Police National Computer London: Home
Office. Available online at:
http://police.homeoffice.gov.uk/news-and-publications/publication/operational-policing/Police_nat_comp.pdf?view=Binary
Junger-Tas, J. and Marshall, I. (1999) The Self-report Methodology in Crime Research in: M. Tonry (Ed.) Crime and Justice: A Review of Research (vol. 25) London: University of Chicago Press.
Internet Journal of Criminology © 2007
www.internetjournalofcriminology.com 16
Russell, J. (1998) Phoenix Data Quality (Police Research Group Special Interest Series 11), London: Home Office.
Trochim, W.M. (2000), The Research Methods Knowledge Base, 2nd ed., available
online at: www.socialresearchmethods.net/kb/
Wilcox, A., Young, R. and Hoyle, C. (2004) Two-year Resanctioning Study: A
Comparison of Restorative and Traditional Cautions (Home Office Online Report
57/04) Available online at: http://www.homeoffice.gov.uk/rds/pdfs04/rdsolr5704.pdf