2017 International Conference on Mathematics, Modelling and Simulation Technologies and Applications (MMSTA 2017) ISBN: 978-1-60595-530-8
A Internet Supply Chain Operational Risk Integrated Model
Based on Copula-POT
Bao-sen WANG, Li-chen LI
*and Pan-pan MEI
Beijing Wuzi University, China*Corresponding author
Keywords: Internet supply chain finance, Operational risk, Copula-POT, Risk measurement.
Abstract. This paper will use risk management theory, select risk identification and risk measurement methods, to deeply analyse the Internet supply chain financial operational risk. Based on the classification of operational risk using FTA method, this paper selects the POT model which is used to measure the operational risk of the Internet supply chain finance. Considering the correlation between different loss types of operational risk, Copula function is introduced to better integrate the measurement Internet Supply Chain Financial Operational Risk. Finally, through empirical research, we will analyse the results.
Introduction
In recent years, with the deepening of the Internet and the finance, the traditional supply chain finance has also accelerated the pace of online operations, and the risks they face are gradually exposed. This paper will use the theory of financial risk management to select the appropriate online supply chain financial operation risk identification method, classify the operational risk and constructs the operational risk identification index system, and use the model to measure the operational risk in the online supply chain finance, so that it could take the financial institutions’ attention to management operational risk.
POT Model
The POT (Peak over Threshold) model builds a model of sample data that exceeds a given threshold and then depicts the tail distribution of risk factors.[1] In the case of Internet supply chain financial
operation risk, the risk events that bring huge asset losses to financial institutions basically show the characteristics of low frequency and high loss. The related losses caused by such risk events often show extreme values. POT model does not have high demand for loss historical data, so it is more suitable for measuring China's Internet supply chain financial operational risk data which is not enough for serious situation.
The Establishment of POT Model
The specific modeling process is as follows:
Let X X1, 2, , Xnbe a set of random samples that are independent and identically distributed to the
population X and represent the different types of loss events that are collected. Suppose the distribution function of population X is F x
.In the collected loss data, select a sufficiently large loss amount as the threshold u, Y X u as an
excess number, Fu
y can be defined as:
, 0u
F y P X u y X u y
(1)
u
F y is the distribution function in X over the threshold u part:
1 1
u
F u y F u F x F u
F y
F u F u
(2) So we can get:
u
1
F x F y F u F u (3)
Suppose y is the data distribution beyond the threshold. According to the theorem of extreme value theory, we can get Fu
y G , u
y ,that is Y follows the generalized Pareto distribution (GPD), asis shown in formula (4):
1
,
1 1 , 0
1 exp , 0
y G y y
(4) The shape parameter and scale parameter of the GPD function of Internet supply chain financial operation risk are represented by the Greek alphabet and [2]. For a given threshold u, the
probability density function can be calculated by deriving Y, and then the parameters in the GPD function can be obtained by using the maximum likelihood estimation to estimate the probability density function.
According to the theorem, for any
0 0
sup
0 , 0
lim
y x u u uu x
F y G y
(5) From formula (6)
,
u u
F y G y
(6) we get the approximate distribution of the function:
, u
1
F x G y F u F u
(7) For the data less than the threshold u, the approximate distribution F x
is usually obtained byempirical distribution. The empirical distribution function is: F u
n Nun
, where n is the
number of samples, which is beyond the threshold u of Nu and is substituted into equation (4)
1
1 1 , 0
1 exp , 0
u u N x u N F x
N x u
N
1 1 , 0
ln 1 , 0
n n N u p N VaR N u p N
(9)
1 1
VaR u
ES
(10) According to the above process, the four types of operational risk loss data of Internet supply chain finance can be more fully estimated the tail distribution that exceed u.
Determination of Threshold in POT Model
In this paper, we use the Hill graph method and the graph of the excess mean function to determine the threshold u, and then use the maximum likelihood estimation method to calculate two types of parameters in the POT model, and then use the 2 goodness of fit to select the optimal u.
The method of determining the threshold u is as follows: (1)Hill chart method
The overall X is expressed in the form of order statistics, we can get X1 X2Xn. Hill
statistics, as is shown in formula (1-11):
, 1 1 ln ,1 k k n iX i
k n
k X k
(11)
The Hill plots are scatter grams made up of points
, 1 , k n k
. Usually we use the X corresponding to the x-coordinate k of the start of the more stable part of the Hill plot as the threshold u.
(2)Excess map method
Excess mean function is defined as, e u
E X
u X u
and we can get the sample excessfunction:
n1
i u
i
e u
x u N(12) Excess mean plots are scatter grams made up of points
u e u,
. Nu is the amount of samples inthe collected data that exceeds the threshold u. If a sufficiently large threshold u is chosen, when
xu, it approximates to a linear function. The parameter 0 indicates that the data presents a
thick tail distribution and obeys the generalized Pareto distribution. But when xu and the
parameter 0indicate that the collected data do not have a thick tail feature. (3)The optimal threshold is chosen by the 2 goodness of fit
Based on the Pickands-Balkama-de Haan theorem, when the threshold u goes to infinity, the conditional distribution function that exceeds the threshold converges to the GPD distribution. The threshold near the conditional distribution and the GPD distribution of the samples that exceed the threshold is the best threshold.
For different thresholds, a new quantity combination is built up for the loss data beyond the threshold and then to calculate the 2statistics of different thresholds u , 2
1 N
i i i
i N np np
.The calculated 2 value can be used to select the threshold. The smaller the value, the higher the
POT Model Parameter Estimation
After the four kinds of operational risk thresholds are calculated, two parameters in the GPD distribution are estimated and the maximum likelihood estimation method is used. Specifically, the probability density function of GPD can be obtained by formula (4):
1 1 , 11 , 0
1 exp , 0
y g y y (13)
Thus, the log-likelihood function in Eq. (14) is obtained:
11
1
ln 1 ln 1 , 0
, ;
1
ln , 0
n i i n i i n y L y n y
(14)For the above logarithmic likelihood function, let 0 0 l l
, we can deduce a likelihood equation
group about and and then solve the equation group to obtain the estimated value of the parameter and .
The Integrated Measurement of Internet Supply Chain FINANCE Operational Risk by Introducing Copula Function
The Copula function describes the correlation between variables and is essentially the method of calculating the joint distribution function by using the edge distribution of random vectors to make it more in line with the interrelated characteristics of different types of operational risk in the supply chain finance of the Internet. Therefore, the introduction of Copula function can provide a more accurate measurement of the operational risk of Internet supply chain[3].
The Introduction of Copula Function
Let H be a joint distribution of n dimensions, the edge distribution is F1, F2, ..., Fn respectively. Then for all X, there is an n-dimensional Copula function C such that:
)) ( , ), ( ), ( ( ) , , ,
(x1 x2 xn C F x1 F x2 F xn
H (15) On the other hand, if C is an n-dimensional Copula function and F1, F2, ..., Fn are distribution functions, then there exists an n-dimensional joint distribution function H such that formula (15) holds and the edge distribution functions are F1, F2, ..., Fn.
The formula (15) about the joint partial derivative, we get:
1 2
1 2
1
, , , n , , , n n i i
i
h x x x c F x F x F x f x
(16)
where ) ( ) ( ) ( )) ( , ), ( ), ( ( )) ( , ), ( ), ( ( 2 1 2 1 2 1 n n n x F x F x F x F x F x F C x F x F x F c
financial operation risk well, so it is not suitable for measuring China's Internet supply chain finance integrated operational risk.
(1) Clayton Copula function
Take the two-dimensional Clayton Copula distribution function as an example:
, ;
1
1, 0C u v Max u v
(17) Where
is the dependent parameter, whose range is [-1, ∞] {0}. ∪(2) Gumbel Copula function
Take the two-dimensional Gumbel Copula distribution function as an example:
, ;
exp
log
log
1C u v u v
(18)
Where
is the dependent parameter, whose range is [1, ∞). (3) Frank Copula functionTake the two-dimensional Frank Copula distribution function as an example:
, ;
1log 1
1
1
1
u u
e e
C u v
e
(19)
Where
is the dependent parameter, whose range is
≠ 0.Because of the financial institutions in the Internet supply chain finance operational risk, various risk loss data tail distributions show a certain relevance, and the Copula Copula Gumbel Copula function and Clayton Copula function not only can better depict all kinds of operations Thick-tail risk and asymmetry, and the calculation is more concise. Therefore, this section uses the Gumbel Copula function and the Clayton Copula function to study the correlation between different operational risks in internet supply chain finance.
Copula Function Parameter Estimation
Since the edge distribution of the four types of operational risk of Internet supply chain finance is determined by using POT, the two-stage method is adopted to estimate the parameters of Copula function, thus estimating the value of the parameter and .
Optimal Copula Function Selection
The appropriate Copula function can better depict the correlation between the four types of operational risk. Since Gumbel Copula function and Clayton Copula function in Archimedean Copula are chosen, according to the experience of Nelsen, Q-Q graph method can be used to judge the optimal Copula function when selecting Archimedean Copula.
Observing the distribution of Q-Q diagram, if it is approximately a straight line, it means that the fitting effect of the function is more realistic, so the optimal Copula function can be selected according to this standard. Therefore, the Copula function, which best shows the correlation between the four types of operation risk of Internet supply chain finance, can be selected through the Q-Q diagram. Thus, the Copula-POT comprehensive measurement model of Internet supply chain financial operation risk is constructed.
Empirical Research
Data Sources and Statistical Analysis
is easier to obtain. After a search and collation, a total of 65 event samples of loss caused by operational risk of supply chain finance business of China CITIC Bank from 2005 to 2015 were obtained. Based on the FTA method of Internet supply chain financial operational risk, the 65 data are divided into four types of loss events: online financing, e-commerce, logistics transaction and online payment transaction risk, corresponding to the loss event types I, II, III and IV respectively, Specific statistics in Table 1.
Table 1. CITIC Bank Supply Chain Financial Operational Risk Loss Statistics (Unit: ten thousand yuan). Number of samples mean Maximum Minimum Standard deviation
overall 65 41353 310000 5 49093
Loss event type I 28 63972 121130 10 22456
Loss event type II 11 5618 11145 5 3780
Loss event type III 9 2491 7000 5 2120
Loss event type IV 17 47794 310000 5 78170
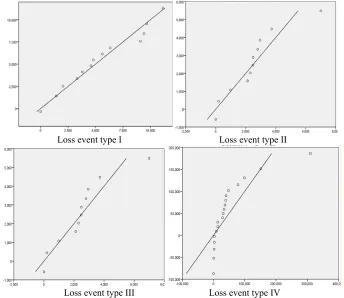
Before applying the model, the Q-Q diagram is usually used to test the thick-tail characteristics of the sample data to determine the applicability of the model. When the Q-Q diagram is curved upward, it indicates that the sample data has a thick tail characteristic. When the Q-Q diagram shows the downward bending state, the sample data has a thin tail characteristic. Through SPSS analysis, the four types of loss event type QQ chart is shown in Fig. 1, and the four QQ charts are bent upward trend, which can determine the four types of Internet supply chain financial operational risk loss data with thick tail distribution Feature, you can use the POT model to measure the Internet supply chain financial operational risk.
Loss event type I Loss event type II
Loss event type III Loss event type IV
Figure 1. Q-Q Diagram of Operational Risk Loss of Internet Supply Chain Finance of CITIC Bank.
Application of POT Model in Internet Supply Chain Financial Operation Risk Measurement
Corresponding to Internet Supply Chain Financial Operational Risk Classification Loss Type Loss Event Type I, II, III, IV.
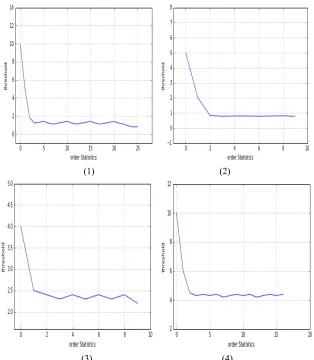
Observe the graph (1) in Figure 2. When the excess number is 3, the Hill graph gradually assumes a steady state, and the X value corresponding to the abscissa k of the point is the threshold value u1.
In the same way, there may be three thresholds corresponding to the other three types of operational risk loss event types, as shown in the other figures of Fig. 2.
(1) (2)
[image:7.612.149.463.162.522.2]
(3) (4)
(1) (2)
(3) (4)
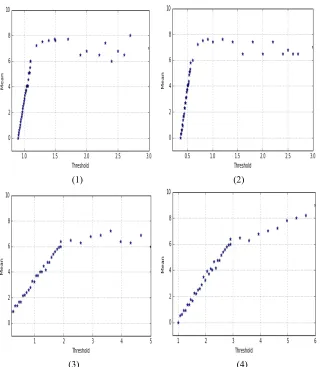
Figure 3. Excess Averages of Four Types of Loss of Operational Risk
Similarly, in Fig. 3, the excess mean value maps corresponding to the four types of operational risk loss types are respectively shown, in which the abscissas of each graph correspond to the amount of loss is 102 times of the abscissa scale. The estimated curve gradually shows the starting point of the
[image:8.612.148.468.68.435.2]linear trend, and the value corresponding to the abscissa of the point is multiplied by the threshold. After the Hill graph and the excess mean value graph respectively, the thresholds of various types of operational risk losses in the Internet supply chain finance are shown in Table 2.
Table 2. Threshold Selection Table for Four Types of Operational Risk.
Different Types Hill diagram method Excess mean plot method
Loss event type I 1800 1124
Loss event type II 813 756
Loss event type III 250 198
Loss event type IV 450 297
According to the optimal threshold selection method in the previous chapter, the 2
Table 3. Determination of the optimal threshold of the four types of operational risk. Different types Threshold u The number Nu
beyond the threshold u
Parameter Estimation
Parameter Estimation
Loss event type I 1800 16 0.8489 6037
Loss event type II 756 6 0.8571 1050
Loss event type III 250 4 0.5697 8507
Loss event type IV 450 9 1.2589 4839
The data in Table 3 are substituted into the formula (9) for calculating VaR , and the VaR of CITIC Bank under various confidence levels is calculated one by one according to the results shown in Table 4.
Table 4. VaR Value of Four Operational Risks (Unit: Ten Thousand Yuan).
Different types 95% 99%
Loss event type I 25916.84 50934.75
Loss event type II 4774.59 9029.25
Loss event type III 20247.04 37160.40
Loss event type IV 27935.28 71580.88
Application of Copula Operational Risk Comprehensive Measurement Model after Joining Copula
After the above analysis of selecting the optimal Copula, this section will adopt the two Copula functions in the Archimedean Copula function to measure the integration risk of Internet supply chain financial operations. The function forms are: Clayton Copula function and Gumbel Copula function.
Copula Function Parameter Estimation. After the above study on Copula function parameter estimation method, this section uses two-stage method to estimate the parameters of Clayton Copula function and Gumbel Copula function.
The parameters estimation of Clayton Copula function and Gumbel Copula function are shown in Table 5. As can be seen from the table, both types of Copula function parameters are greater than 1, so there is a significant correlation between various operational risks in Internet supply chain finance.
Table 5. Copula Function Parameter Estimation.
Copula function Gumbel Copula Clayton Copula
Estimate parameters 1.7829 2.4918
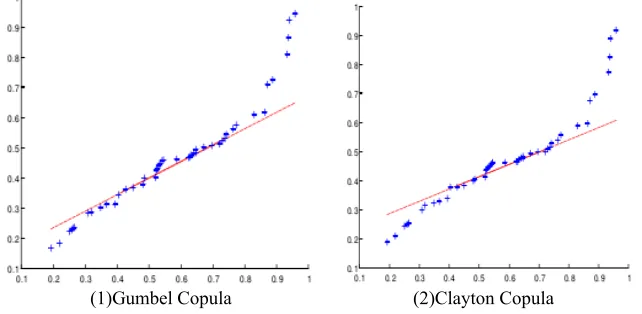
Optimal Copula Function Selection. Using Q-Q graph method to determine the optimal Copula function. As can be seen from Fig. 4, Gumbel Copula is most similar to the Q-Q graph and the straight line. The Q-Q graph of Clayton Copula has a large deviation from the straight line, indicating that the Gumbel Copula function has the best fit to the joint loss distribution effect.
[image:9.612.145.466.547.704.2]
(1)Gumbel Copula (2)Clayton Copula Figure 4. Q-Q plot of Copula function.
1, , ,2 3 4
1, , ,2 3 4
1.7829
1
1 , 2 2 , 3 3 , 4 4
F x x x x C u u u u C F x F x F x F x
Where
4
11, , ,2 3 4 exp i1 log i
C u u u u u
(20)
1 0.84891 1 1 0.57 1 0.00014 1800
F x x
(21)
1 0.85712 2 1 0.55 1 0.00082 756
F x x
(22)
1 0.56973 3 1 0.44 1 0.000067 250
F x x
(23)
1 1.25894 4 1 0.53 1 0.00026 450
F x x
(24) Cupula function, which is the joint distribution of the marginal distribution of the four types of operational risk in Internet supply chain finance, where θ is the parameter value of Gumbel Copula function, which is 1.7829, and F xi
i is the distribution function of the i-th class of operational risk. Therefore, by introducing the Gumbel Copula function empirically, the correlation between the four types of operational risk is considered, so that the POT model can measure the total capital of operational risk regulation more accurately.Introducing Copula function and Monto Carlo simulation to calculate VaR. Since we have obtained the marginal distribution parameters of various types of operational risk and the Gumbel Copula function in the internet supply chain finance and the correlation between the four types of operational risk losses in supply chain finance, Monto Carlo is used to measure the comprehensive operational risk capital.
To sum up the above four types of operational risk losses in the Internet supply chain finance, the integrated VaR of operational risk is obtained, which is compared with that of the above without considering the correlation. The comparison results are shown in Table 6.
Table 6. VaR without considering the correlation and considering the correlation (Unit: ten thousand yuan). Regardless of the
relevance of the VaR
Consider the VaR under the correlation
Percentage reduction
99% 168705.28 152948.2 9.34%
95% 78873.74 70134.53 11.08%
It can be seen that the introduction of Copula function can avoid the decentralization effect of operational risk, reduce the regulatory risk of commercial banks effectively, improve Pareto for commercial banks and make full use of capital. And, when the level of confidence reaches a high level, the probability of an Internet supply chain financial operational risk event has dropped to a very low level. China's commercial banks should maintain a higher level of confidence in order to better reduce the probability of occurrence of operational risks in the supply chain of Internet.
References
[2] Han-xiao Zhang, Yue-yue Zhou, Loss Distribution of Flood Catastrophes Based on POT-GPD Model and Comparison of Parameter Estimation Methods, J. Journal of Henan Science and Technology,2(2015):151-153.