2017 International Conference on Computer Science and Application Engineering (CSAE 2017) ISBN: 978-1-60595-505-6
A Method to Build a Risk Evaluation Weighted Indicators System
and an Application Example in Online Shopping Risk Evaluation
Ruyi Ye* and Lijun Feng
913 RM, China National Institute of Standardization, 4 Zhichun RD, Haidian, Beijing, China
ABSTRACT
FMEA (Failure Mode and Effects Analysis) is widely used to evaluate risks and the measurement in complex projects during design stage. But for some cases where the decision is not so complex, a simple result of risk evaluation such as a comprehensive score is more helpful, e.g. when evaluating and comparing the online shopping risks related to different retailers to help the consumers make choice, it’s better to provide a comparable trustfulness score with every retailer. Though such cases are common, seldom research has been focused on them. One convenient and common method is to design a risk evaluation system including several weighted indicators and the rating standards for every indicator, by which it’s much easier to repeat the process to evaluate many objects. In this article, one method to build a risk evaluation indicators system that guarantees the proportional relationship between the resulting score and the expected risk loss is proposed and is adopted in online retailing trustfulness evaluation as an application example.
INTRODUCTION
In traditional risk management process, risk and its according reducing measurements are evaluated and compared with the risk acceptance criteria to help the decision making during system designs. [1] Failure mode and effects analysis (FMEA) has proven to be a useful and powerful tool in assessing potential failures and preventing them from occurring[2] and has been widely adopted by reliability practitioners[3,4,5].
The decision-making process could be complex if the number of risk aspects increases, when economical, environmental, comfort related, political, psychological and societal acceptance are considered [6]. Therefore in many cases, the result of risk evaluation would be better if only an intuitive comprehensive score is given to make a decision, e.g., to make a choice among several alternative material suppliers, or to select an online retailer when buying some commodities. However few research deals with multiple risks evaluation in which only one comprehensive score is required. In some special cases, repeating risk evaluation process must be taken for many different objects. E.g., there are millions of retailers in Alibaba website, and only one or two scores to describe their trustfulness are helpful for consumers to make decision.
Actually in some situation, detection can be omitted. E.g. in the online shopping, the risk analysis is not so complex, and only risks about the quality of the commodity, delivery delay, after service, privacy protection and so on play important roles.
This is the reason for this article to put forward a risk evaluation indicators system that only derives a comprehensive score which is comparable with different repeating risk evaluation, and can be useful in situation which is not very complex.
METHODOLOGY Risk Evaluation
The expected loss, the product of the probability that the risk happens and the loss once it happens is used usually to measure the severity of risk:
refers to the probability that the risk happens that equals to the occurrence in RPN, and the loss which is caused by the risk that equals to the severity in RPN. In information security, is the product of the probability of being attacked and that of the system being breached under attacking, and the latter is the indicator of the vulnerability of the system [7]. can be the amount of economic loss, or the utility changes if the type of the risk appetite is considered.
Usually multi-point risks exist in one system, and the total expected loss of all risks can be used to measure the severity of the risks, and the summation of expected losses of all risk points is:
(1)
Indicators System of Risks Evaluation
For the convenience and comparability of repeating the risks evaluation, an evaluation indicators system is built in advance adaptable to a special area. Usually, the loss in money or the economic utility of the loss caused by a given risk happening do not change widely for a special risk bearer. E.g., the loss caused by 10-day delay of materials delivery is almost the same whoever the seller is. Therefore theoretically, the loss can be evaluated in advance for all kinds of risk points once happening, and then the probabilities according to different sellers evaluated in order to make a better choice.
Assume that risk points are treated , indexes with credits are
used to evaluated them, the according probabilities are , and losses respectively.
To obtain a comprehensive score, it’s required to appoint weights respectively, and the sum of them is 100 in centesimal scale without loss of generality:
Since is constant, if let the weights and the credits as following:
(2)
(3)
Then the expected loss is:
(4)
Therefore, if let the every credit be the probability that the according risk does not happen, and let the potential the loss be the weight, the comprehensive score that has been obtained is a multiple of the expected loss caused by all risks, and there are many advantages of such method to determine the weights and credits:
- The credit of single indicator is linear to the probability of the according risk if it happens, and the higher the probability is, the lower the score, and vice versa.
- The weight of an indicator is proportional to the according loss caused if happening. Then the weight will be small if the loss of the according risk is negligible though it can happen often.
- The comprehensive score is linear to the expected loss caused by all risks, and then the higher the score is, the lower the risk is. If the comprehensive score is close to 100, the expected loss is close to 0 or negligible, and if the score is close to 0, the expected loss is high and all risks have a high probability to happen. So the comprehensive score includes the total information of the expected loss caused by all risks. In other word, the lost score is proportional to the severity level of the total risk under this ideal evaluation indicators system.
APPLICATION SAMPLE OF ONLINE RETAILING
Online retailing is one kind of ecommerce, serving large number of consumers with large number of small orders. There are tens of thousands of online retailing website in China, and even millions of sellers on 3rd-part (such as taobao.com, jd.com) retailing platforms. Facing so many retailing sellers, a consumer may be confused, since he/she can’t know their trustfulness and the according risk. In such situation, some independent organizations like BBB online provide the trustfulness evaluation service for the online retailers, and which help consumers to distinguish the retailers with lower according risk [8,9].
Using (3) and (4), the risk evaluation indicators system for online retailing trustfulness is built as following 3 steps:
Sort Out Main Online Shopping Risk
Consumers may face many kinds of risk when shopping online, among which only 4 usual risks are chosen to be analyzed here for illustration purpose:
- quality flaw
- delay on delivery - unsatisfied after service
Evaluate the Loss and Determine the Weights
For simplicity, the monetary loss which is caused by risks is considered assuming that the online shopping amount is 100 dollars. To calculate the loss according to a specific loss , several consumers can be inquired, and the average value can be used.
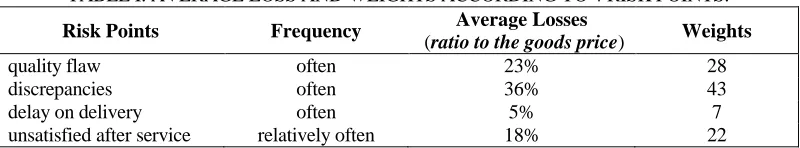
[image:4.612.98.498.215.289.2]The data in TABLE I are estimated according to some sampling survey:
TABLE I. AVERAGE LOSS AND WEIGHTS ACCORDING TO 4 RISK POINTS.
Risk Points Frequency Average Losses
(ratio to the goods price) Weights
quality flaw often 23% 28
discrepancies often 36% 43
delay on delivery often 5% 7
unsatisfied after service relatively often 18% 22
Notice, the weights are calculated using (2), e.g. the first weight of the quality flaw is obtained by 23%/(23%+36%+5%+18%)*100=28.
Determine the Standard of Rating
According to (3), the score of every indicator is 1 minus the probability that the risk happens, in other word the probability that it doesn’t happen. In reality, the frequency that a risk happens in a past period can be used to substitute the probability. Though the loss caused by a specific risk is almost the same to the consumer, the frequency is different from seller to seller, and so different seller can obtain different evaluation score of trustfulness.
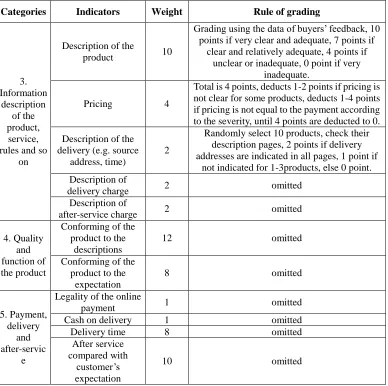
The TABLE II is a part of the weighted indicators system built by this method, which is adopted in Chinese Standard published by Ministry of Commerce of People’s Republic of China.
DISCUSSION AND CONCLUSIONS
In the situation when decision maker need to choose the best or the approaching best strategy that balancing some aspects and the potential risks which he can’t and isn’t interested to take some measures to change, he might only need to know the severity of the total risks, e.g., a simple comprehensive score like the credit score to describe the total risk is enough, and a rigor and detail FMEA process may goes out of his interest. The risks evaluation weighted indicators system in this article can help conveniently evaluate the risks and obtain a comparable and comprehensive score without complex evaluation process.
advantage and validity is that the comprehensive score is linear to the expected loss caused by all risks and the evaluation process is simple and convenient.
It’s usual that some risks are correlated, and this doesn’t affect the calculation of the expected of the total loss, therefore correlation between different risks is tolerated in this indicators system.
[image:5.612.106.494.231.617.2]But if the danger caused by a specific kind of risk changes widely in different situation, e.g. a quality flaw of some commodity bought from online shop can cause a big loss sometimes and can be trivial in another case, then how to determine the weight of indicator of quality? There are two measures can be taken: the first is split this risk into multiple risk point according to their danger once happens, the second is use the average loss as the weight and consider the loss besides the probability when rating.
TABLE II. THE WEIGHTED INDICATORS SYSTEM IN CHINESE STANDARD.
Categories Indicators Weight Rule of grading
3. Information description of the product, service, rules and so
on
Description of the
product 10
Grading using the data of buyers’ feedback, 10 points if very clear and adequate, 7 points if
clear and relatively adequate, 4 points if unclear or inadequate, 0 point if very
inadequate.
Pricing 4
Total is 4 points, deducts 1-2 points if pricing is not clear for some products, deducts 1-4 points if pricing is not equal to the payment according to the severity, until 4 points are deducted to 0.
Description of the delivery (e.g. source
address, time)
2
Randomly select 10 products, check their description pages, 2 points if delivery addresses are indicated in all pages, 1 point if
not indicated for 1-3products, else 0 point. Description of
delivery charge 2 omitted
Description of
after-service charge 2 omitted
4. Quality and function of the product
Conforming of the product to the
descriptions
12 omitted
Conforming of the product to the
expectation
8 omitted
5. Payment, delivery
and after-servic
e
Legality of the online
payment 1 omitted
Cash on delivery 1 omitted
Delivery time 8 omitted
After service compared with
customer’s expectation
10 omitted
the ability of discrimination of the whole indicators system will be damaged. In such cases, the risk happening probability should be considered also to deduce a reasonable weight. E.g., the product of the potential loss and the average probability for every risk can be used as the weights to solve this problem partly. Then the weights and the grading rule become the following:
In a conclusion, while FMEA is widely used in complex project design stage to evaluate and control the risks, the method in this article that builds a weighted indicators system for evaluating risks and obtains a comprehensive score is suitable for some not complex cases, where a simple evaluation result is intuitive and convenient to be compared with others for the decision maker. The evaluation process in this method is simpler and more cost saved, and it can be used for the cases that many objects are to be evaluated repeatedly for the similar risk points.
Since the article only puts forward the theoretical method of building the risks evaluation weighted indicators system, the real-world data can be used to test the method in the future.
REFERENCES
1. Høj, N.P., Kröger, W. 2002. “Risk analyses of transportation on road and railway from a European perspective,” Safety Science, 40 (1–4):337-357.
2. Nune R. Sankar and B. S. Prabhu. 2001. “Modified approach for prioritization of failures in a system failure mode and effects analysis,” International Journal of Quality & Reliability Management, 18(2-3):324-335.
3. Rah, Jeong E., Manger, Ryan P.,Yock, Adam D., Kim, and Gwe-Ya. 2016. “A comparison of two prospective risk analysis methods: Traditional FMEA and a modified healthcare FMEA,”
Medical Physics, 43(12):6347-6353.
4. Chen JK. 2007. “Utility priority number evaluation for FMEA,” Journal of Failure Analysis and Prevention, 7(5):321-328.
5. Hung GQ., Nie M., and Mar KL. 1999. “Web-based failure mode and effect analysis (FMEA),”
Computers and Industrial Engineering, 37(1–2):177-180.
6. Shahid S. 2009. “The weighted risk analysis,” Safety Science, 47 (2009):668-679.
7. L. A. Gordon and Martin P. L. 2002. “The Economics of Information Security Investment,” ACM Transactions on Information and System Security, 5(4):438-457.
A. Jøsang, R. Ismail and Colin B. 2007. “A survey of trust and reputation systems for online service provision,” Decision Support Systems, 43(2):618-644.