ORIGINAL ARTICLE
Rapid and accurate reverse engineering of geometry
based on a multi-sensor system
Feng Li&Andrew Peter Longstaff&Simon Fletcher&
Alan Myers
Received: 15 January 2014 / Accepted: 20 May 2014
#The Author(s) 2014. This article is published with open access at Springerlink.com
Abstract The reduction of the lead time in measurement and reverse engineering, and the increased requirements in terms of accuracy and flexibility, have resulted in a great deal of research effort aimed at developing and implementing multi-sensor systems. This paper describes an effective competitive approach for using a tactile probe to compensate the data from a laser line scanner to perform accurate reverse engineering of geometric features. With the data acquired using laser scan-ning, intelligent feature recognition and segmentation algo-rithms can be exploited to extract the global surface informa-tion of the object. The tactile probe is used to re-measure the geometric features with a small number of sampling points and the obtained information can be subsequently used to compensate the point data patches which are measured by laser scanning system. Then, the compensated point data can be exploited for accurate reverse engineering of a CAD mod-el. The limitations of each measurement system are compen-sated by the other. Experimental results on three parts validate the rapidity and accuracy of this multi-sensor data fusion approach.
Keywords Multi-sensor . CMM . Laser scanning . Reverse engineering
1 Introduction
Even though tactile and optical sensing technologies are widely used in data acquisition in measurement or reverse
engineering (RE), it has been shown that each technique has its own characteristics and limitations, which lend them to particular applications [1]. Existing tactile coordinate measur-ing machine (CMM) methods are widely used for industrial dimensional metrology [2], but the digitisation process on such systems is very time-consuming for the acquisition of the initial set of points on complex or freeform surfaces if applied to RE. Another disadvantage in the context of RE is that a predefined path must be specified in advance to cover all features of a workpiece that are to be probed. This requires a prior knowledge of the part, presenting an obstacle to future automatic RE strategies. An alternative approach is represent-ed by non-contact digitisation of surfaces basrepresent-ed on optical techniques, for example laser scanning [3–5]. A laser line sensor is a non-contact probe using the triangulation method to obtain point cloud data on a measured surface. Laser line scanning can capture dense point clouds efficiently in terms of speed and required human intervention. Additionally, it offers the possibility of measuring surface points from multiple features via a single and relatively simple probing path. This makes it a common choice in RE applications and quality control methods of freeform surfaces. However, laser line scanning is sensitive to issues that are almost irrelevant to tactile-based methods such as the high influence of surface colour, shininess, transparency, etc. [6]. It also suffers from problems of digitization of any non-surface features such as slots or holes, due to occlusions and obscuration of these artefacts. In general, laser line scanning is considered to be less accurate in comparison with tactile probing [7].
Multi-sensor systems allow the selection of discrete prob-ing or scannprob-ing methods to measure different features. The decision is often based on the principle that tight tolerance elements should be measured by high-precision contact methods, while elements with looser tolerance can be scanned via optical techniques. This combination of sensors enables the efficient measurement of a wider range of objects than any F. Li (*)
:
A. P. Longstaff:
S. Fletcher:
A. MyersCentre for Precision Technologies, School of Computing & Engineering, University of Huddersfield, Queensgate, Huddersfield HD1 3DH, UK
of the individual sensors alone and the limitations of each system are compensated by the other.
Durrant-Whyte [8] classifies physical sensor configuration in a multi-sensor data fusion system into three categories as follows:
& A competitive sensor configuration is one where the sen-sors are configured to measure the same feature indepen-dently in order to reduce the measurement uncertainty and to avoid erroneous measurements.
& A complementary sensor configuration is one where the sensors do not directly depend on each other but can be combined in order to give more complete information about the object.
& A cooperative sensor configuration uses the information provided by two or more independent inhomogeneous sensors to derive data that would not be available from any sensor individually.
In this paper, we propose an effectivecompetitive integra-tion approach for the compensaintegra-tion of a laser line scanner by using a tactile probe to perform the reverse engineering of geometric features. With the coordinate data acquired using the laser scanning, intelligent feature recognition algorithms can be applied to extract the geometric elements of the object. These key features of elements can be re-measured by the slower tactile probe with a small number of points, and then the geometric elements can be described by mathematical and numerical methods. The obtained information can subse-quently be used to compensate the comprehensive, lower-accuracy point cloud data measured by the laser line sensor.
The remainder of this paper is organized as follows: Section2 surveys the prior work in multi-sensor coordinate measurement, Section 3 gives a brief introduction on data segmentation methods and Section 4 introduces the least squares best fitting methods for the four most common geo-metric features. The proposed method in this paper is de-scribed in Section5while Section6presents the experimental results. Finally, the conclusions of this piece of work and discussion of possible future direction is presented in Section7.
2 Literature review
To meet the requirement of both speed and high-accuracy 3D measurement for quality control or RE applica-tions, multi-sensor measuring systems have been developed to measure, analyse and rebuild a CAD model of the objects. When using RE methods to reproduce a given shape, the tolerance distribution of the scanned part must be considered [9]. Bradley and Chan [10] and Zexiao et al. [11] each present acomplementarysensor approach for RE. The optical sensor
is applied to scan the profile of a part from different views, while the tactile probe is used to measure the edge and key features.
Hybrid contact-optical coordinate measuring systems are each designed by Chan [12], Carbone [13], Tzung-Sz [14] and Sladek et al. [15] where the obtained information digitized by an optical sensor is used to guide the touch probe for re-measuring the sample surfaces. The presented systems are cooperative integrations where optical sensors acquire the global shape information of objects to guide the touch probes for automatic point sensing. They are, however, limited to dealing with workpieces with relatively simple features.
Only limited research oncompetitiveintegration of hybrid contact-optical sensors has been found. Huang and Qian [16] develop a dynamic approach for integrating a laser scanner and a touch probe to improve the measurement speed and quality. A part is first scanned by the laser scanner to capture the overall shape. It is then probed by a tactile sensor where the probing positions are determined dynamically to reduce the measurement uncertainty according to the scanned data. They use a Kalman filter to fuse the data and to incrementally update the surface model based on the dynamically probed points. More recently, Bešićet al. [17] introduce a method for improving the output of a CMM-mounted laser line scanner for measurement applications. The improvement is achieved by using a median filter to reduce the laser scanner’s random error and by simultaneously combining with the reliable but slow tactile probing. The filtered point data is used to estimate the form deviation of the inspected elements while a few points obtained by the tactile probe are used to compensate for errors in the point cloud position. Current commercial systems or software often only focus on processing points data from individual sensors or techniques; the issue of where and how to effectively and efficiently improve the accuracy of fused data is still a challenge. In particular, to the authors’best knowledge, no relevant research has provided a method to efficiently handle integrated measurement data in RE to use sparse accurate measurement information to improve the over-all measurement accuracy for RE applications.
3 Point cloud data segmentation
segmenting 3D data in engineering applications can be gen-erally classified into three types: edge-based [18–21], region-growing [22–24] and hybrid-based [25–27] methods. The data sets are segmented into point-based data patches or polygon-based data patches by using different methods. As the discrete point data is much easier to modify in comparison with polyhedral surface, this work only considers the segmentation methods that are able to generate the outputs for point-based data patches.
Woo et al. [26] developed an octree approach for segmenting the scan data. First, the 3D non-uniform grids are generated by calculating the normal of each point. Then points are assigned in the subdivided cells with different levels in size. The edge points are ex-tracted by selecting the points contained in the small-sized cells. Finally, the segmented point-based data patches are obtained after these edge points have been removed. This method is able to effectively extract edge neighbourhood points and group data points and was therefore selected for performing the data segmentation in this paper.
4 Least squares best fit geometric elements
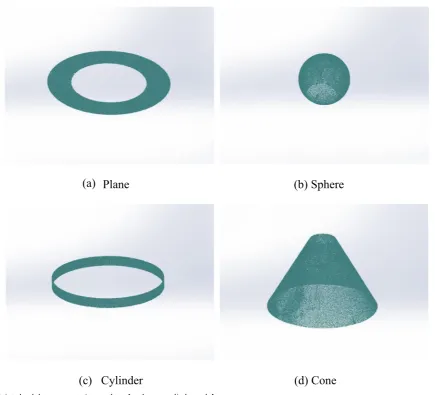
After the segmentation process, the original point set is divid-ed into subsets which can be broadly classifidivid-ed into two categories: geometric elements and freeform surfaces. The various geometries that are used to reconstruct a CAD model for RE applications and studied in this paper are planes, spheres, cylinders and cones.
4.1 Parameterization
(a) Parameterization of plane
A space plane can be specified by a point (xo,yo,zo) on
the plane and the direction cosines (a,b,c) of the normal to the plane.
a xð −xoÞ þb yð −yoÞ þc zð −zoÞ ¼0 ð1Þ
xo,yo,zo,a,bandcare the desired parameters.
(b) Parameterization of sphere
A sphere is specified by its centre (xo,yo,zo) and radius
r. Any point (xi,yi,zi) on the sphere satisfies the equation
x−xo
ð Þ2þðy−yoÞ
2þ
z−zo ð Þ2¼
r2 ð2Þ
Equation (2) can be simplified as
x2þy2þz2−ax−ay−czþρ¼0 ð3Þ
wherea=2xo,b=2yo,c=2zoandρ=xo2+yo2+zo2−r2.
a,b,candρare the desired parameters.
(c) Parameterization of cylinder
A cylinder can be specified by a point (xo,yo,zo) on its
axis; a vector (a,b,c) pointing along the axis and its radius,r.
For a near vertical axis, we can setc=1. Also, ifxoand
yoare known, thenzocan be determined as
zo¼−axo−byo ð4Þ
(d) Parameterization of cone
A cone can be specified by a point (xo,yo,zo) on its
axis; a vector (a,b,c) pointing along the axis and the apex semi-angleϕ.
For a nearly vertical cone, we setc=1 and then axis zo=−axo−byo.
4.2 Least squares best fitting methods
The algorithms for fitting using a least squares method for various geometric elements have been studied by several authors [28–30]. For linear geometries such as lines and planes, the parameters can be solved by linear least squares methods directly. For nonlinear geometries such as spheres, cylinders and cones, the Levenberg-Marquardt algorithm [30] and Gauss-Newton algorithm [31] have been widely used. Since the least squares best fit geometric elements algorithms are fully detailed by Forbes [28], his algorithms are exploited as fitting methods in this paper.
When applying the Levenberg-Marquardt algorithm or Gauss-Newton algorithm to fit cylinders and cones, good starting values are necessary for fast convergence of the algorithm and for obtaining the global optimal solution. In this paper, the tactile probe on CMM is used to scan two circles perpendicular to the axis (see Fig.1). By least squares best fitting both 3D circles, the initial estimates for fitting cylinders and cones can be obtained. Then the data set is rotated by applying a 3×3 matrix,U, to align the cylinder or cone along the z-axis (see Fig. 1) to find the desired parameters.
5 Description of the proposed method
to disregard imperfections. There are some reasons for this. Firstly, modelling every defect could be time consuming and therefore expensive. Secondly, one of the main goals of RE is to reconstruct a CAD model of the workpiece. Therefore, the aim is to create a‘more perfect’part representing true design intent rather than simply copying the original product. This may require a detailed understanding of the function,
depending on the part being modelled, because only then can the design intent be correctly interpreted.
After the multi-sensor coordinate system calibration, the optical scanner and tactile probe measure in nominally the same absolute coordinate system. However, two data sets measured by different sensors are unlikely to coincide abso-lutely, which means there will be a measurement difference
(a)
Cylinder(b)
ConeFig. 1 Points data translation and
rotation:acylinder,bcone
[image:4.595.232.544.58.242.2] [image:4.595.78.511.379.702.2]between the tactile and optical sensor. The final aim of RE is to obtain a comprehensive, accurate CAD reconstruction model. To achieve this goal, a data compensation method is proposed to enhance the measurement accuracy of the point cloud data from the optical scanner. The proposed method is targeted at manufacturing problems where a reverse engineered model with accuracy better than 50μm is needed. Naturally, the scanned data points must be representative of the geometric elements concerned.
5.1 Proposed method
After data segmentation, the data points are grouped into two types of data sets: geometric elements and freeform surfaces. The elements which include planes, spheres, cylinders and cones can represent 85 % of machined objects [32]. Due to their simple mathematical description and ability to model a large percentage of manufacture objects, they are widely used
in various modelling systems [33,34]. In RE, the accuracy of the final CAD model depends on the measured point data. A small amount of discrete point data measured by the high accuracy, but relatively slow tactile probe, can be used to compensate the densely scanned data patches that have been measured by the fast, but relatively low accuracy optical method. The specific method follows these logical steps:
(a)
Overview of Nikon LK V 15.10.8 HA CMM
(b)
Renishaw SP25M probe
and SH25-1 stylus holder
(c)
Nikon LC15Dx laser
scanner
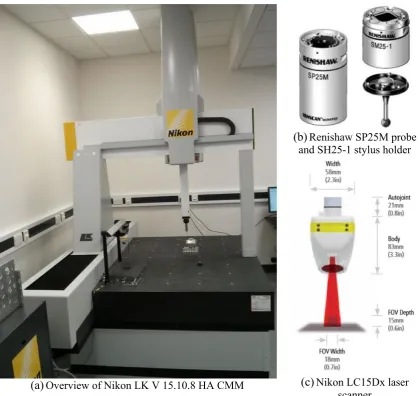
Fig. 3 Nikon LK V 15.10.8 HA high accuracy ceramic bridge CMM.aOverview of Nikon LK V 15.10.8 HA CMM,bRenishaw SP25M probe and
[image:5.595.88.509.50.446.2]SH25-1 stylus holder andcNikon LC15Dx laser scanner
Table 1 Specifications of the Renishaw SP25M probe and Nikon
LC15Dx laser scanner
Parameter Renishaw
SP25M probe
Nikon LC15Dx laser scanner
MPEE(ISO 10360–2:2009) 1.6+L/375μm 3.6+L/375μm Multi-stylus test (MPEAL) 6μm –
Resolution <0.1μm 22μm
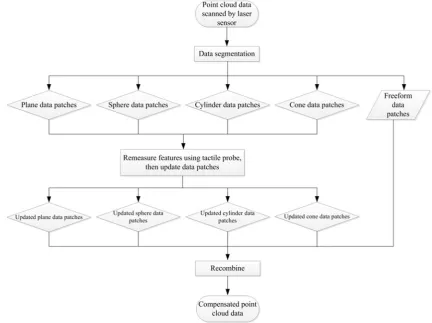
[image:5.595.307.546.626.714.2]1. Use the laser scanner to digitize the entire surface of part, and then exploit a segmentation algorithm, as described in Section3, to group the point data patches each belonging to a different surface patches; these data patches will be compensated in step 3.
2. Use the tactile probe to re-measure tight-toleranced geo-metric features with a small number of points to minimize the temporal cost. Then use the least squares method to best fit these geometric elements to derive the parameters based on mathematical and numerical principles.
(a)
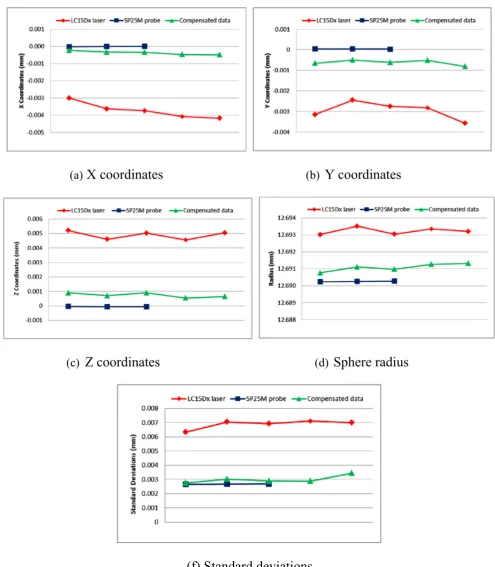
X coordinates
(b)
Y coordinates
(c)
Z coordinates
(d)
Sphere radius
(f) Standard deviations
[image:6.595.48.544.48.616.2]3. Substitute thexandycoordinates of each point measured by the laser scanner into the parametric equations (Section4.1), then the newzcoordinate can be updated. Use the x, y, and newz coordinates as new point data coordinates to build point data sets. Then the compensated data sets are exploited to reconstruct a CAD model.
Description schematic of the proposed method is shown in Fig.2.
5.2 Algorithms description
The detailed algorithms for compensation of different geomet-ric features are presented as follows:
(a) Plane compensation
According to Eq. (1), the parameters to be solved are a,b,candxo,yo,zo. Here, we defined=−(axo+byo+czo).
According to our proposed method, the newz coordi-nate can be derived by:
zN ¼ð−ax−by−dÞ=c ð5Þ
To compare the normal of the plane, we letd=1.
(b) Sphere compensation
According to Eq. (2), the parameters to be solved are xo,yo,zoandr. First, we translate a copy of the data so
that the centre of the sphere is at the origin.
xi;yi;xi
ð Þ ¼ðxi;yi;xiÞ−ðxo;zo;yoÞ ð6Þ
Then the value of the newzcoordinate can be derived by
zNi¼
ffiffiffiffiffiffiffiffiffiffiffiffiffiffiffiffiffiffiffiffi r2−x
i2−yi2
p
ð7Þ
Part B to be measured
(b) Data measured from laser scanner
Points measured from tactile probe
(d) Merged data
(a)
(c)
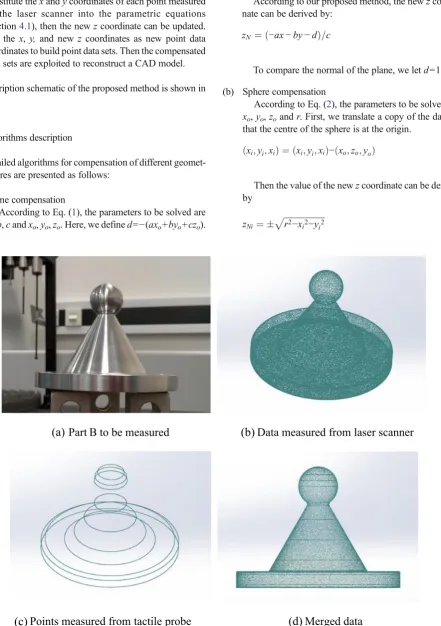
Fig. 5 Points data measured using multi-sensor system.aPart B to be measured,bdata measured from laser scanner,cpoints measured from tactile
[image:7.595.83.525.62.689.2]Here, two values ofzN are obtained that will fit the
sphere. To determine which one is needed, the value of z(i) is determined to be positive or negative:
if z ið Þ>0 zNð Þ ¼i jzNð Þi j;
else
zNð Þ ¼i −jzNð Þi j;
end
In some cases, the solving results of zN includes
imaginary parts, which means that the original points are beyond the scope of the sphere to be fitted. We have to delete those points in the new point data coordinates. In fact, this is an effective way to exclude noisy data.
Finally, the origin is translated by an amount equal and opposite to the vector in Eq.6, above.
(c) Cylinder compensation
For cylinder and cone compensation, the proposed
method is inverse shifting of the data so that the point (xo,yo,zo) on the axis lies at the origin. Inverse rotation of
the data set is then performed using the transpose of rotation matrixUwhich rotates (a,b,c) to coincide with z-axis. Again, we will translate and transform the data back after compensation. Then the value of the newyN coordinate can be obtained by
yNi¼
ffiffiffiffiffiffiffiffiffiffiffiffi r2−x
i2
p
ð8Þ
The method for determining the positive and negative ofyNiis much the same as that for spheres.
(d) Cone compensation
After data set translation and rotation, the value of the newyNicoordinate of cone can be calculated by
yNi¼
ffiffiffiffiffiffiffiffiffiffiffiffiffiffiffiffiffiffiffiffiffiffiffiffi r−kzi ð Þ2−
xi2
q
ð9Þ
wherek=tan(ϕ).
Plane
(b) Sphere
(c) Cylinder
(d) Cone
(a)
[image:8.595.80.516.48.443.2]6 Experimental implementation
In this section, the feasibility and robustness of the proposed approach are first examined. Then a part with common geometric features is selected to test the intro-duced method after data segmentation. Finally, a work-piece that contains typical geometric features and freeform characteristics is investigated to further verify the proposed method.
The multi-sensor measurement system used for data acquisition is a Nikon LK V 15.10.8 HA high-accuracy ceramic bridge CMM (see Fig. 3a). It operates in a temperature-controlled room, typical of normal CMM applications, with the environmental temperature con-trolled at 20 ± 0.2 °C.
The multi-sensor system integrates two different sensors: a Renishaw SP25M tactile probe (Fig. 3b) and a Nikon LC15Dx single-stripe laser scanner (Fig.3c). The two sensors integrate with the CMM via the Renishaw PH10MQ articu-lating motorized probe head; only one sensor can operate at any given time. The software platform CAMIO7 multi-sensor CMM metrology software is used for measurement planning and data acquisition.
The specifications of the Renishaw SP25M scanning probe and Nikon LC15Dx laser scanner are listed in Table1.
6.1 Example one
[image:9.595.179.541.62.403.2]In example one, a sphere (part A) with nominal radius of 12.7 mm is used to test the robustness and feasibility of the introduced method. The sphere is made of solid polypropyl-ene with a matt finish and has good roundness and sphericity. Part A is scanned by the LC15Dx laser scanner five times and SP25M touch probe three times, separately. During laser scanning, the distance between the surface of the artefact and the laser scanner in various orientations is kept constant by using the optimal distance to minimize influence of the scan depth to measurement error. The original point data scanned by the laser sensor is compensated by using data
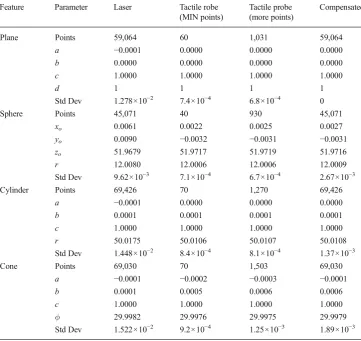
Table 2 Fitting results using
dif-ferent methods (dimensions in mm)
Feature Parameter Laser Tactile robe (MIN points)
Tactile probe (more points)
Compensated
Plane Points 59,064 60 1,031 59,064
a −0.0001 0.0000 0.0000 0.0000
b 0.0000 0.0000 0.0000 0.0000
c 1.0000 1.0000 1.0000 1.0000
d 1 1 1 1
Std Dev 1.278×10⁻² 7.4×10⁻⁴ 6.8×10⁻⁴ 0
Sphere Points 45,071 40 930 45,071
xo 0.0061 0.0022 0.0025 0.0027
yo 0.0090 −0.0032 −0.0031 −0.0031
zo 51.9679 51.9717 51.9719 51.9716
r 12.0080 12.0006 12.0006 12.0009
Std Dev 9.62×10⁻³ 7.1×10⁻⁴ 6.7×10⁻⁴ 2.67×10⁻³
Cylinder Points 69,426 70 1,270 69,426
a −0.0001 0.0000 0.0000 0.0000
b 0.0001 0.0001 0.0001 0.0001
c 1.0000 1.0000 1.0000 1.0000
r 50.0175 50.0106 50.0107 50.0108
Std Dev 1.448×10⁻² 8.4×10⁻⁴ 8.1×10⁻⁴ 1.37×10⁻³
Cone Points 69,030 70 1,503 69,030
a −0.0001 −0.0002 −0.0003 −0.0001
b 0.0001 0.0005 0.0006 0.0006
c 1.0000 1.0000 1.0000 1.0000
ϕ 29.9982 29.9976 29.9975 29.9979
Std Dev 1.522×10⁻² 9.2×10⁻⁴ 1.25×10⁻³ 1.89×10⁻³
Table 3 Computational time
Feature Plane Sphere Cylinder Cone
[image:9.595.306.544.661.714.2]measured by the tactile probe. Figure4shows the coordinates of the sphere centre, radii and standard deviations of part A separately calculated from the laser, tactile probe and com-pensated data. The fitting results show high stability of the data measured from tactile probe. The first set of data mea-sured by the tactile probe is used to compensate the data scanned by laser sensor separately. We can see systematic errors between laser sensor and tactile sensor significant de-crease after the data set is compensated.
6.2 Example two
Part B (see Fig.5a) is made of aluminium alloy 5083 and designed with only geometric features. After data segmenta-tion, these geometric elements are exploited to prove the concept proposed in this paper. The elements on the parts include most typical of geometric features: plane, sphere, cylinder and cone. The workpiece is located on the bed of the CMM and fixed by clamps when performing the measurement.
The laser sensor is used for surface global information acquisition. Because of the reflection of the surface, the inten-sity of the laser is changed to scan the shiny part. The views of the laser scanner are adjusted by the Renishaw PH10MQ probe head to cover the full surface. A trial version of the commercial software, Geomagic Wrap 2013, is used for performing the data pre-process tasks of data denoising and reduction, etc. The data scanned by laser and tactile probe are shown in Fig.5b, c, respectively. Figure5ddisplays merged and organized point cloud data.
The data measured by the laser scanner is segmented by the described feature recognition algorithm (see Fig.6). Then the large amounts of unordered points that belong to different geometric element patches can be compensated by a small amount of point data using the tactile probe.
There is a desire to determine how many points must be captured by the tactile probe to achieve the desired represen-tation of geometric elements. Traditionally, the number of sampled points is required to be ten times the number of parameters in the model [35]. However, in this experiment, we take more sampled points and compare the fitting results. The fitting results for different features using different methods and their standard deviations are listed in Table2.
All the computing tasks are operated on a desktop comput-er with an AMD Phenom II×4970 3.5 GHz processor and 8 GB RAM. Table 3 presents the computing time of data updating for different features.
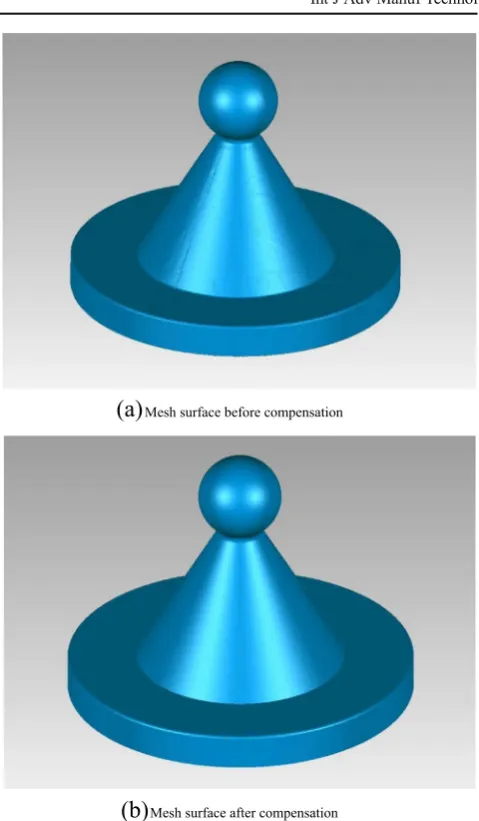
The meshed surfaces before and after compensation are illustrated in Fig.7a, b, respectively. From above fitting results we can draw several conclusions:
1. It has been shown that ten times the number of parameters is a sufficient number of measurement points using the
tactile probe, considering its measurement uncertainty. This result is consistent with the conclusion introduced in literature [35].
2. After compensation, the quality of the point data mea-sured from the optical sensor has been greatly improved (see Table2and Fig.7). In theory, the compensated data has the same accuracy as the data measured from the tactile probe.
3. The compensated data is more robust and more likely to be identified by recognition algorithms, and is therefore more conducive to process in the next step of model reconstruction.
6.3 Example three
Part C is a more complex housing (Fig.8a) which is modified from literature [36]. This workpiece has a shiny metal surface.
Mesh surface before compensation
(b)
Mesh surface after compensation(a)
Fig. 7 Mesh surface.aMesh surface before compensation andbmesh
[image:10.595.305.545.38.449.2]It also contains the typical geometric features and freeform characteristic.
The laser sensor is used to scan the global information of the surface. Two poses of the part are required in order to acquire entirely the point cloud data from the top and the bottom of the workpiece. The datum plane and tight tolerance features need to be measured more accurately, and the inner holes are difficult to scan by laser scanner because of occlusion. Therefore, an SH25-1 stylus holder with a M3 40 mm stylus carried by the SP25M tactile probe is exploited to measure these features (see Fig.8a). First of all, the top and bottom surface point data were registered to the same coordinate system; the method proposed in reference [37] is exploited to align the two pieces of data. The points scanned by the laser scanner and tactile probe are shown in Fig.8b, c, respectively. All point cloud data is scanned manually by the operator. Table 4 presents the numbers of points of raw data, scanning views and measurement time.
After data segmentation and compensation, a reconstructed CAD model was rebuilt in the SolidWorks 2013 environment as shown in Fig. 8d(both uncompensated and compensated models are visually the same).
(a) Measurement speed comparison for sensors
In the digitizing process for part C, the actual scanning time is 19 min 19 s and the tactile probing time is 14 min 55 s, therefore the total measuring time is 34 min 14 s (Table4).
(a) Part C and Tactile probing plan
(b) Points data scanned from laser
Data captured by tactile probe
CAD model constructed in SolidWorks
(c)
(d)
Fig. 8 RE of part C.aPart C and tactile probing plan,bpoints data scanned from laser,cdata captured by tactile probe,dCAD model constructed in
[image:11.595.88.511.52.212.2] [image:11.595.82.512.148.421.2]SolidWorks
Table 4 Numbers of points and scanning time
Methods Views Number of points Measuring time (min:s)
Laser–top 21 6,573,959 12:04
Laser–bottom 12 3,840,678 7:15
[image:11.595.306.544.639.716.2]Finally 105,122 points scanned by laser sensor are retained after data reduction to generate a satisfactory mesh surface for CAD model reconstruction, and 2,019 points measured from tactile probe are exploited to com-pensate the laser scanned data.
In comparison, if we assume that the tactile probe senses the part at the speed of 4–5 points per second, based on the scanning speed presented in Table4, the time to digitize the part using only a tactile method would be a minimum of 6 h. The integration of the laser scanner and CMM therefore leads to much faster measurement than the tactile method alone.
(b) CAD model accuracy comparison
To validate the final reconstructed CAD model qual-ity, we use the root mean square (RMS) error distance to check the accuracy of the constructed CAD modelSCAD.
However, in practice, the actual surface may be difficult
or even impossible to obtain. A large number of accurate CMM probing points can be exploited as the reference points on the actual surface. The RMS can then be obtained by
RMS¼
ffiffiffiffiffiffiffiffiffiffiffiffiffiffiffiffiffiffiffiffiffiffiffiffiffiffiffiffiffiffiffiffiffiffiffi X
i¼1
N
d pT i;pSi
2
N v
u u u t
ð10Þ
wherepiTis the sampled point using CMM tactile probe,Nis
the number of those sampled points,piSis the projected point
to the constructed surface of CAD modelSCADandd(piT,piS) is
the distance betweenpiTandpiS.
Both uncompensated and compensated models are used as the nominal geometry for CMM measurement using a tactile probe. In each case, the same scanning path was used. In the first instance, the Nikon CMM with Renishaw SP25M probe used to perform the RE measurements was used to evaluate the accuracy of both models. Figure9presents the comparison between probed points and final reconstructed CAD models before and after compensation. To further examine perfor-mance of the reconstructed CAD model, an independent, high-accuracy Zeiss PRISMO CMM (MPEE= 1.9 + L/ 300μm (ISO 10360–2:2009)) was used. Table 5shows the RMS comparisons of reconstructed CAD models for both systems. We can see that both results indicate that the accuracy of the geometric elements of reconstructed CAD model has been greatly improved after compensation.
7 Discussion, conclusion and future work
A new competitive approach for rapid and accurate reverse engineering of geometric features from multi-sensor system based on geometric algebra approach is proposed. A set of programs based on the Matlab R2011b platform has been developed for the verification of the proposed method. Then the compensated data is processed to rebuild a CAD model in the SolidWorks 2013 environment.
Other existingcooperativemulti-sensor configuration ap-proaches only use optical sensors to capture the global surface
CAD model before compensation
CAD model after compensation
(a)
(b)
Fig. 9 The comparison between probed points and reconstructed CAD
[image:12.595.305.544.70.133.2]model.a CAD model before compensation andbCAD model after compensation
Table 5 RMS comparison
RMS (mm) Before
compensation
After compensation
Nikon CMM with SP25M probe 0.053 0.007
[image:12.595.52.289.285.683.2]information of the object and then guide the slower tactile probe to digitize the surface. In the presented method, the multiple data sets are acquired by laser scanning and tactile probing in bothcompetitiveandcomplementarymulti-sensor configurations. With the point cloud data acquired using a laser scanner, intelligent feature recognition and segmentation algorithms can be applied to extract and segment the point cloud data. Then, the tactile probe is used to re-measure the holes, which are difficult to measure by laser sensor, and tight tolerance geometric features with a small number of sampling points. The obtained information can be subsequently used to compensate the point data patches which are measured by laser sensor.
The results of the three case-study experiments show that the algorithms provide satisfactory performance and the vast amounts of unordered points measured from optical sensor are converted to orderly and more accurate point data after com-pensation. In addition, it usually needs several hours to fully digitize a workpiece by using a tactile sensing device. How-ever, in the presented approach, the total measurement time is drastically reduced. A case strictly (part C) would take 6 h to digitize using a tactile probe, but only about 30 min using the proposed method, an improvement of 90 % which greatly improves measurement efficiency without losing accuracy.
These results compare well to othercompetitivemethods. Huang and Qian’s approach [16] can effectively save mea-surement time and be able to deal with shiny surfaces, but according to the experimental results displayed in the litera-ture, this approach does not significantly improve accuracy of the fused data. In Bešić et al.’s work [17], the introduced method is very intuitive and understandable. However, only a plane is considered in the literature and, because each point cloud data must be filtered before shifting, the usability is adversely affected. In general, the method introduced in this paper reveals a better accuracy of data fusion than above approaches.
The proposed multi-data compensation method has been proven to work for geometric elements. Multi-sensor data fusion for freeform dimensional measurement or reverse en-gineering applications is another promising avenue for re-search. In addition, acooperativeandcompetitiveintegration of the proposed multi-sensor measuring system would realize the benefits of automatic digitization and would be especially valuable for reconstruction of complex surfaces.
Acknowledgments The authors gratefully acknowledge the UK’s
En-gineering and Physical Sciences Research Council (EPSRC) funding of the EPSRC Centre for Innovative Manufacturing in Advanced Metrology (Grant Ref: EP/I033424/1).
Open AccessThis article is distributed under the terms of the Creative
Commons Attribution License which permits any use, distribution, and reproduction in any medium, provided the original author(s) and the source are credited.
References
1. Weckenmann A, Jiang X, Sommer KD, Neuschaefer-Rube U, Seewig J, Shaw L, Estler T (2009) Multisensor data fusion in dimen-sional metrology. CIRP Ann Manuf Technol 58(2):701–721. doi:10. 1016/j.cirp.2009.09.008
2. Weckenmann A, Estler T, Peggs G, McMurtry D (2004) Probing systems in dimensional metrology. CIRP Ann Manuf Technol 53(2): 657–684. doi:10.1016/s0007-8506(07)60034-1
3. Fan KC (1997) A non-contact automatic measurement for free-form surface profiles. Comput Integr Manuf Syst 10(4):277–285. doi:10. 1016/s0951-5240(97)00020-7
4. Zexiao X, Jianguo W, Ming J (2007) Study on a full field of view laser scanning system. Int J Mach Tools Manuf 47(1):33–43. doi:10. 1016/j.ijmachtools.2006.02.015
5. Lee S-J, Chang D-Y (2006) A laser sensor with multiple detectors for freeform surface digitization. Int J Adv Manuf Technol 31(5–6):474– 482. doi:10.1007/s00170-005-0212-9
6. VukašinovićN, Bračun D, Možina J, Duhovnik J (2010) The influence of incident angle, object colour and distance on CNC laser scanning. Int J Adv Manuf Technol 50(1–4):265– 274
7. Feng H-Y, Liu Y, Xi F (2001) Analysis of digitizing errors of a laser scanning system. Precis Eng 25(3):185–191. doi: 10.1016/S0141-6359(00)00071-4
8. Durrant-Whyte HF (1988) Sensor models and multisensor integra-tion. Int J Robot Res 7(6):97–113
9. Várady T, Martin RR, Cox J (1997) Reverse engineering of geomet-ric models—an introduction. Comput Aided Des 29(4):255–268. doi: 10.1016/s0010-4485(96)00054-1
10. Bradley C, Chan V (2001) A complementary sensor approach to reverse engineering. J Manuf Sci Eng 123(1):74–82
11. Zexiao X, Jianguo W, Qiumei Z (2005) Complete 3D measurement in reverse engineering using a multi-probe system. Int J Mach Tools Manuf 45(12–13):1474–1486. doi:10.1016/j.ijmachtools.2005.01. 028
12. Chan VH, Bradley C, Vickers GW (2001) A multi-sensor approach to automating co-ordinate measuring machine-based reverse engi-neering. Comput Ind 44(2):105–115. doi:10.1016/s0166-3615(00) 00087-7
13. Carbone V, Carocci M, Savio E, Sansoni G, De Chiffre L (2001) Combination of a vision system and a coordinate measuring machine for the reverse engineering of freeform surfaces. Int J Adv Manuf Technol 17(4):263–271. doi:10.1007/s001700170179
14. Tzung-Sz S, Jianbing H, Chia-Hsiang M (2000) Multiple-sensor integration for rapid and high-precision coordinate metrology. Mechatron IEEE/ASME Trans 5(2):110–121
15. Sladek J, Blaszczyk PM, Kupiec M, Sitnik R (2011) The hybrid contact-optical coordinate measuring system. Measurement 44(3): 503–510. doi:10.1016/j.measurement.2010.11.013
16. Huang Y, Qian X (2007) A dynamic sensing-and-modeling approach to three-dimensional point-and area-sensor integration. Trans Am Soc Mech Eng J Manuf Sci Eng 129(3):623
17. BešićI, Van Gestel N, Kruth J-P, Bleys P, HodoličJ (2011) Accuracy improvement of laser line scanning for feature measurements on CMM. Opt Lasers Eng 49(11):1274–1280
18. Yang M, Lee E (1999) Segmentation of measured point data using a parametric quadric surface approximation. Comput Aided Des 31(7): 449–457
19. Huang J, Menq CH (2001) Automatic data segmentation for geomet-ric feature extraction from unorganized 3-D coordinate points. Robot Autom IEEE Trans 17(3):268–279
21. Demarsin K, Vanderstraeten D, Volodine T, Roose D (2007) Detection of closed sharp edges in point clouds using normal esti-mation and graph theory. Comput Aided Des 39(4):276–283 22. Besl PJ, Jain RC (1988) Segmentation through variable-order surface
fitting. Pattern Anal Mach Intell IEEE Trans 10(2):167–192 23. Chappuis C, Rassineux A, Breitkopf P, Villon P (2004) Improving
surface meshing from discrete data by feature recognition. Eng Comput 20(3):202–209
24. Rabbani T, van Den Heuvel F, Vosselmann G (2006) Segmentation of point clouds using smoothness constraint. Int Arch Photogramm Remote Sens Spat Inf Sci 36(5):248–253
25. Alrashdan A, Motavalli S, Fallahi B (2000) Automatic segmentation of digitized data for reverse engineering applications. IIE Trans 32(1): 59–69
26. Woo H, Kang E, Wang S, Lee KH (2002) A new segmentation method for point cloud data. Int J Mach Tools Manuf 42(2):167–178 27. Liu Y, Xiong Y (2008) Automatic segmentation of unorganized noisy point clouds based on the Gaussian map. Comput Aided Des 40(5): 576–594
28. Forbes AB (1989) Least-squares best-fit geometric elements. NPL Report DITC 140/89. National Physical Laboratory Teddington, London
29. Lukács G, Martin R, Marshall D (1998) Faithful least-squares fitting of spheres, cylinders, cones and tori for reliable segmentation. In: Burkhardt H, Neumann B (eds) Computer Vision—ECCV′98. Lecture Notes in Computer Science, vol 1406. Springer, Heidelberg, pp 671–686. doi:10.1007/BFb0055697
30. Shakarji CM (1998) Least-squares fitting algorithms of the NIST algorithm testing system. J Res Ntl Inst Stand Technol 103:633–641 31. Wedderburn RW (1974) Quasi-likelihood functions, generalized lin-ear models, and the Gauss—Newton method. Biometrika 61(3):439–447 32. Hakala D, Hillyard R, Malraison P, Nource B (1981) Natural quadrics
in mechanical design. Proc-AUTOFACT West 1:17–20
33. Miller JR (1988) Analysis of quadric-surface-based solid models. Comput Graph Appl IEEE 8(1):28–42
34. Mortenson ME (2006) Geometric modeling. Industrial Press, New York 35. Kurfess TR, Banks DL (1995) Statistical verification of conformance
to geometric tolerance. Comput Aided Des 27(5):353–361 36. Zhao H, Kruth J-P, Van Gestel N, Boeckmans B, Bleys P (2012)
Automated dimensional inspection planning using the combination of laser scanner and tactile probe. Measurement 45(5):1057–1066 37. Li F, Longstaff AP, Fletcher S, Myers A (2014) A practical coordinate