2019 International Conference on Computational Modeling, Simulation and Optimization (CMSO 2019) ISBN: 978-1-60595-659-6
Knowledge Graph Aided Similarity Evaluation for Scientific Workflow
Han CUI
1, Peng SHI
1,*, Tong ZOU
1and Lian-hong DING
21National Center for Materials Service Safety, University of Science and Technology Beijing,
Beijing 100083, China
2School of Information, Beijing Wuzi University, Beijing 101149, China
*Corresponding author
Keywords: Knowledge graph, Scientific workflow, Similarity evaluation.
Abstract. This paper proposes a new scientific workflow similarity evaluation method. This method combines knowledge graph and the domain knowledge of scientific workflow entities. The input, output and process between them are treated separately. Different weights are identified to them. The whole similarity of two scientific workflows is calculated by the similarity of nodes and weights.
Introduction
To deal with the complex computing process and massive data management, the concept of SWF is put forward, SWF originated from business workflow and was first put forward by Workflow Management Coalition (WFMC) [1]. Since SWF is a fixed process for computing, it is reusable after modification according to application demand. Therefore, it is necessary to study the similarity evaluation of SWF to recommend proper candidate SWF. Most of the previous studies on workflow similarity were carried out from the structural level. Goderis and Santos both studied the largest common [2,3] Maximal isomorphic subgraph (MSC) from the perspective of workflow substructure. Further, there are also studies on the similarity comparison of subgraphs. Corrales inferred the similarity of the whole graph based on the similarity of sub-graphs [4]. Xiang calculated the workflow similarity based on the above work by using the graph editing distance [5]. Yuan also proposed a control flow distance measurement method of workflow from the perspective of distance [6]. Kefan studied the process similarity in probability workflow on the basis of the above, established workflow system by defining probability structure tree, and proposed workflow measurement method based on tree edit distance [7].
In terms of semantics, Silva proposed a workflow comparison method based on XML semantics from another perspective [8]. Each semantic tag is defined as an "element". Costa also adopted the method of annotating workflow tags to determine the similarity of workflow [9]. Bergmann introduced semantics by adding tags to each node of workflow, and then summarized the similarity of workflow by comparing the semantics of nodes [10]. Stoyanovich also compares similarities by assigning keyword labels to workflows [11]. Karacapilidis compared workflow data links based on semantic annotations [12]. However, this approach has limitations and is not available in a public working flow repository.
According to the above research, it is easy to ignore the implicit semantic relationship between workflow nodes when considering the structure alone and the accuracy of similarity comparison will be affected. At the same time, when considering the semantics alone, the intuitive similarity of structure will be neglected. The paper introduces knowledge graph (KG) at the workflow level for better similarity evaluation.
Similarity Evaluation Method of SWF Based on KG
Pretreatment
nodes to all end nodes, each case traversed is a new PSWF. For the workflows with transition conditions, separate the conditions as new nodes.
Entities Similarity
In order to obtain the similarity of nodes in different workflows, it is necessary to study the entity similarity (ES) in KG. Yang proposed a Jaccard entity similarity comparison method in literature, which has attribute sets [13,14]. The calculation formula is shown in formula (1):
Jaccard (A, B) =A∩B/A∪B. (1)
For the attribute set A and B of two entities, the greater the Jaccard value is, the greater the similarity between them is. The elements in set A and set B are determined according to the objectively existing KG according to the following rules:
Attribute sets = {Root, Main branch, Branch1, Branch2..., Leaves, Node form} (2)
The Weight
The start and end of a workflow is often more important than the process. Assume that Wi, Wp and Wo is the weight of Input, Process and Output, respectively. If two workflows end up achieving the same functionality, the two workflows can be considered very similar, even without considering the intermediate process. Therefore, there is a relationship as “Wo > Wi > Wp”.
Method of Comparison
According to the weight relationship between Input, Process and Output, the workflow needs to be compared according to the priority order of “Output, Input, Process”. Starting with the output of a workflow, compare with the target workflow and traverse the target workflow node until similar node is found. The similarity of nodes in the workflow is determined by the distance of entities in KG. After comparison, the input similarity Si, output similarity So and process similarity Sp of the two workflows are obtained. Combined with weight calculation, the final similarity (FS) of two workflows can be obtained.
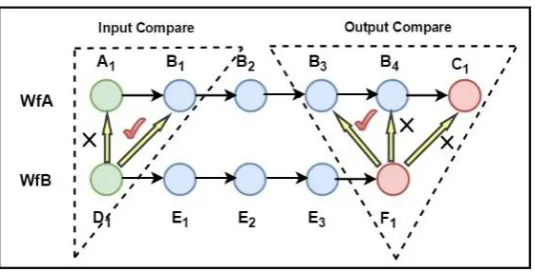
[image:2.595.165.433.490.626.2]For example, suppose the pretreatment PSWF WfA is compared to WfB.
Figure 1. Output and Input terminal comparison process.
Output Comparison. Compare the Output terminal of WfB with the Output terminal of WfA from back to front. At first, F1 is compared with C1. If F1 is far apart from C1 in the KG, F1 and C1 is
considered as irrelevant. Then F1 is compared with the front node of C1, that is, B4. If the two nodes
are still irrelevant, F1 is compared with the front node of B4, that is, B3. If no nodes are relevant with
F1, the node in front of F1, that is E3, is treated as the node to be compared. Otherwise, the similarity of
(1), denoted as input similarity Si. In the example in Figure 1, A1 are denoted as empty nodes, so the
similarity between D1 and B1+A1 is Si.
[image:3.595.165.431.394.527.2]The above is one of the possible cases in the comparison process, and there may be several other cases, as shown in Table 1. There are four situations in the comparison process.
Table 1. Four situations when the Input is compared with the Output.
Step1: Output terminal comparison
Step2: Input terminal comparison
Case1 Similar√ Similar√
Case2 Similar√ Irrelevant×
Case3 Irrelevant× Similar√
Case4 Irrelevant× Irrelevant×
Process Comparison. The whole procedure of an Output comparison and an Input comparison is denoted as a terminal comparison loop. The above four cases are the possible situations of the terminal comparison loop. After the completion of the terminal comparison loop, there remains the Process nodes comparison.
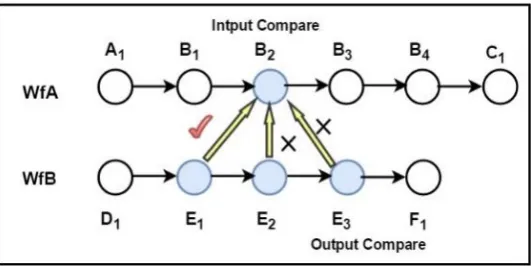
On the basis of Case1, that is, after a comparison between the Output and the Input, the remaining B2 nodes in WfA and the remaining E1, E2 and E3 nodes in WfB are shown in Figure 2. Take the
remaining nodes as a new workflow. Then compare the two remaining workflows. In the sample, E3
is irrelevant to B2. Then B2 is compared with the front node of E3, that is, E2, If the two nodes are still
irrelevant, Then the comparison of Input terminal, the similarity of two relevant nodes E1 and B2 can
be calculated by formula (1), denoted as output similarity Sp. In the example in Figure 2, E2 and E3
are denoted as empty nodes, so the similarity between B2 and E1+E2+E3 is Sp.
Figure 2. Sample workflow WfA and WfB Process terminal comparison process.
Similarity Calculation
The formula of FS is shown in formula (3):
FS = SiW Wi
i+Wp+Wo+ Sp
Wp
Wi+Wp+Wo+ So
Wo
Wi+Wp+Wo. (3)
The data in Table 2 can be obtained after the comparison of Case1 through two loops. Since the nodes compared in the second loop are all Process nodes in the first loop, the weight needs to be multiplied by formula (4), where N is the number of cycles. Finally, the FS between WfA and WfB is obtained by formula (3).
Table 2. The calculation formula of similarity between WfA and WfB.
WfA WfB ES Weight Similarity
First Cycle
Output B3+B4+C1 F1 So
Wo Wi + Wp + Wo
So
· Wo
Wi + Wp + Wo
Input A1+B1 D1 Si
Wi Wi + Wp + Wo
S𝑖
· Wi
Wi + Wp + Wo
Second Cycle
Output None None None None None
Input B2 E1 Sp
Wp × Wi
(Wi + Wp + Wo)2
Sp
·(Wi + Wp + Wo)Wp × Wi 2
Final Similarity So· Wo
Wi + Wp + Wo+ Si·
Wi
Wi + Wp + Wo+ Sp·
Wp × Wi
(Wi + Wp + Wo)2
Case Study
For the two workflows in Figure 3, after pretreatment, Wf1 is divided into four PSWF SW11~SW14,
and Wf2 into six PSWF SW21~SW26. We specify the weight Wi, Wp and Wo as 0.3, 0.2 and 0.5,
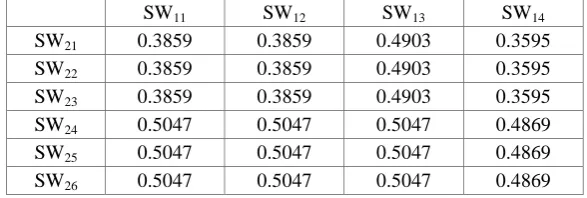
[image:4.595.77.527.376.558.2]respectively. Si, Sp and So is calculated according to the entity similarity in KG by formula 3. The calculated similarity values of PSWF are shown in Table 3. Consequently, the final similarity is the maximum value of 24 comparisons, that is, FS = 0.5047.
Figure 3. Two sample workflows: Wf1 (left), Wf2 (right) and KG for case study.
Table 3. The result of similarity comparison between PSWF of two samples.
SW11 SW12 SW13 SW14
SW21 0.3859 0.3859 0.4903 0.3595
SW22 0.3859 0.3859 0.4903 0.3595
SW23 0.3859 0.3859 0.4903 0.3595
SW24 0.5047 0.5047 0.5047 0.4869
SW25 0.5047 0.5047 0.5047 0.4869
SW26 0.5047 0.5047 0.5047 0.4869
Conclusion
[image:4.595.150.444.610.709.2]with the simple style SWF. The similarity of complex SWF, such as with self-loop, will be studied in the future.
Acknowledgement
This paper is financially supported by National Key R&D Program of China (No. 2017YFB0203703) and the Science and Technology Plan General Program of Beijing Municipal Education Commission (Grant No. KM201910037186).
References
[1] Su MM, Song wen. Research progress of foreign scientific workflow in 2007-2008 [J]. Library construction, 2009(7):96-100.
[2] Goderis A, Li P, Goble C. Workflow discovery: the problem, a case study from e-Science and a graph-based solution[C]//International Conference on Web Services. IEEE, 2006:312-319.20(3): 258-262.
[3] Santos E, Lins L, Ahrens J P, et al. A First Study on Clustering Collections of Workflow Graphs[C]// Provenance and Annotation of Data and Processes, Second International Provenance and Annotation Workshop, IPAW 2008, Salt Lake City, UT, USA, June 17-18, 2008. Revised Selected Papers. DBLP, 2008:160-173.
[4] Corrales J C, Grigori D, Bouzeghoub M. BPEL Processes Matchmaking for Service Discovery[C]// Confederated International Conference on the Move to Meaningful Internet Systems: Coopis, Doa, Gada, and Odbase. Springer-Verlag, 2006:237-254.
[5] Xiang X, Madey G. Improving the Reuse of Scientific Workflows and Their By-products[C]// IEEE International Conference on Web Services. IEEE, 2007:792-799.
[6] Huang Y, Fu X D, Jia N, et al. A control flow distance measurement method for scientific workflow [J]. Computer engineering, 2013, 39(7):94-98.
[7] Kefan L U, Haiyang H U, Hua H U. Measuring process similarity for probabilistic workflows[J]. Computer Integrated Manufacturing Systems, 2016.
[8] Silva V, Chirigati F, Maia K, et al. Similarity-based Workflow Clustering[J]. 2011, 2:23-35.
[9] P Costa F, Oliveira D D, Ogasawara E, et al. Athena: Text Mining Based Discovery of Scientific Workflows in Disperse Repositories[J]. 2010, 6799:104-121.
[10] Bergmann R, Müller G, Wittkowsky D. Workflow Clustering Using Semantic Similarity Measures[C]//Conference on Artificial Intelligence. Springer, Berlin, Heidelberg, 2013:13-24.
[11] Stoyanovich J, Taskar B, Davidson S. Exploring repositories of scientific workflows[C]// 2010:1-10.
[12] PKaracapilidis N, Rüping S, Tzagarakis M, et al. Building on the Synergy of Machine and Human Reasoning to Tackle Data-Intensive Collaboration and Decision Making[M]// Intelligent Decision Technologies. 2011:113-122.
[13] Yang S L, Han R Z. Methods and tool analysis of knowledge map construction abroad [J]. Library and intelligence knowledge, 2012 (6):101-109.