2016 International Conference on Mathematical, Computational and Statistical Sciences and Engineering (MCSSE 2016) ISBN: 978-1-60595-396-0
The Impact of Optimism on Turnover Intention for Low-Wage
White-collars: The Moderating Effect of
Perceived Organizational Support
Hong-xia LIU
1,*, Ying HUANG
2and Shan-shan JIANG
31School of Management, Capital Normal University, Beijing, China, 100089
2School of Public Administration, Zhongnan University of Economics and Law, Wuhan, Hubei,
China, 430073
3School of International Audit, Nanjing Audit University, Nanjing, Jiangsu, 211815
*Corresponding author
Keywords: Optimism, Turnover intention, Perceived organizational support, Low-wage white-collar.
Abstract. In order to study the moderating effect of perceived organizational support between optimism and turnover intention, 213 valid questionnaires were used. The empirical results show that optimism can negatively predict low-wage white-collars’ turnover intention; perceived organizational support can moderate the relationship between optimism and turnover intention, which means that a high-level of perceived organizational support could enhance the negative influence between optimism and turnover intention, while a low-level of perceived organizational support could weaken the negative influence. Corresponding suggestions are put forward from two aspects of recruitment and management in order to reduce the turnover intention and turnover rate of low-wage white-collars.
Introduction
In general, White-collars are the backbone or elite of the organizations. Whether they remain or not has far-reaching impact on the employers. In recent years in China, the employers are facing the dilemma that white-collars quit their jobs frequently. More and more employers have undertaken the pressure of white-collars’ high turnover rate. According to the data released by PXC in 2014, the turnover rate of white-collars was more than 20%. A survey displayed that the low-wage employees’ turnover rate was far higher than senior managers’. The data and information reflects an indisputable fact that the turnover rate of low-wage white-collars is higher than that of ordinary white-collars. This conclusion makes the retention problem for the particular group low-wage white-collars attract more and more attention. Why the turnover rate of low-wage white-collars is so high? What factors lead to their turnover behavior? How to reduce their high turnover rate? Turnover intention is an important variable to study the white-collars’ turnover behavior. Under the current situation with such high turnover rate for low-wage white-collars, it is necessary to conduct research about the turnover intention of low-wage white-collars.
- 2 -
factors, but also influenced by organizational factors, this study attempted to examine the regulatory mechanism of low-wage white-collars’ perceived organizational support which influences the relationship between its life orientation and turnover intention, and explore the reasons why low-wage white-collars have turnover intention and research its inherent response mechanism, so as to provide some proposals to reduce the low-wage white-collars’ turnover intention effectively.
Research Theories and Assumptions
With the rise of Positive Psychology in the late 1940s and early 50s, the academia has paid more attention to it, especially the optimism. In theory, optimistic life orientation has a positive impact on employees’ psychology and work, and encourages them to move on when they meet difficulties and displeasure. Some empirical studies have confirmed this opinion that optimistic positive life orientation does bring a lot of positive effects to employees, such as increasing their loyalty to the organizations, improving work performance, reducing the turnover rate and so on (Youssef & Luthans, 2007)[2]. In some studies which have researched the effects of psychological capital on turnover intention, many scholars (e.g. Luthans etc., 2005[3]; Chen Weizheng, 2012[4]) have found that optimism as a dimension of psychological capital is negatively related to turnover intention. For low-wage white-collars, optimists are more likely to insist their goals and more willing to make efforts in the face of life pressure, work pressure and other potential obstacles which have been brought by low wage. Thus, optimistic low-wage white-collars are less likely to generate turnover intention. So the first proposition (Hypothesis 1) of this study is put forward:
Hypothesis 1 (H1): Optimism will be negatively related to low-wage white-collars’ turnover intention.
Perceived organizational support is a kind of employees’ feeling about the extent of organizations attaching great importance to employees’ contribution and benefits (Eisenberger etc., 1986)[5]. Many studies have shown that, as a kind of organizational environment factors, perceived organizational support can negatively predict low-wage white-collars’ turnover intention (Cropanzano etc., 1997[6]; Allen etc., 2003[7]). Further studies show that organizational support is a factor moderating employees’ turnover intention [8]. In general, individual life orientation does not remain the same but change with the change of situations. In organizations, optimistic employees will make more positive expectations and more hopeful decisions for their development when the organizational environment changes. In theory, when the organizational support for the employee is low, which means he can hardly get concern, encourage and help from the organization, he will attribute these difficulties and negative events to external and accidental factors. Then he is more likely to choose to resign to change the adverse external factors and adjust his state. Therefore, the low level of perceived organizational support would weaken the degree that optimism influences the turnover intention. Conversely, when the perceived organizational support is high, which means the employee can always get concern, encourage and help from the organization, he will improve his work enthusiasm and labor output significantly. In this situation, employees with optimism will attribute his improvements and success to stable and long-term internal factors, such as his own effort and organization’s approval, which could significantly improve employee’s loyalty and satisfaction, and reduce turnover intention. Thus, the second proposition (Hypothesis 2) of this study is as follows:
Hypothesis 2 (H2): Perceived organizational support will adjust the relationship between optimism and turnover intention, and optimism will make more negative influence on turnover intention when the perceived organizational support is high.
Method
Sample
the average salary of white-collars in 32 major cities in summer, 2015, was 6320 RMB. It’s no doubt that white-collars’ wages are different in different regions. But if regional differences were considered, it would make some objective restrictions and artificial errors in sampling. Therefore we considered the possibility of determining a unified national standard. Since the personal income tax threshold in China was formulated by current personal income levels and people’s living standards, white-collars whose wage was lower than the personal income tax threshold were considered as low-wage white-collars. In 2015, the personal income tax threshold in China was 3500 RMB. As a result, in this survey, “low-wage white-collars” was defined as employees doing non-manual work in offices with monthly income less than 3500 RMB.
The questionnaires of this study were issued by alumni in four universities in Beijing, and the respondents were limited to the university graduates who graduated within 5 years and were doing non-manual work in offices. Among 626 returned questionnaires, we selected 213 valid questionnaires which the monthly income of respondents were less than 3500 RMB, About 44.6% respondents were male, and 55.4% respondents were female. Their average age was 24.9 (SD=1.870), and the average graduation period was 2.45 years (SD=1.203). 80.8% of the respondents were single, while 19.2% of the respondents were married. Junior college graduates accounted for 15.5%, undergraduates accounted for 78.9%, and postgraduates accounted for 5.6%.
Measures
The questionnaire used in this study was mainly composed of positive orientation scale, turnover intention scale and perceived organizational support scale. These three scales derived from authority and were used frequently both at home and abroad.
The measurement of optimism used Life Orientation Test-Revised (LOT-R) developed by Scheier etc[1]. It included 10 items such as ‘In uncertain times, I usually expect the best.’ which were used to indicate the level of their optimistic orientation. According to the degree of agreement, 5-point Likert-type scale was used (1=strongly disagree, 5=strongly agree). Three of these items described general expectations for positive events, using positive scoring. The other three items described general expectations for negative events, using negative scoring. The remaining four questions were filling items and used to cover up the test purpose and reduce the social desirability, which would not be scoring. In this study, the internal consistency reliability of LOT-R was 0.699. The confirmatory factor analysis results of LOT-R were as follows: the fitting index of χ²/df, RMSEA, CFI, NNFI were 1.508, 0.032, 0.990 and 0.991 respectively.
The turnover intention scale was developed by Farh etc.[9]. It included 4 items such as ‘I always thought of resigning from my current job’. The respondents indicated the extent of their agreement with each item on a 5-point Likert-type scale (1=strongly disagree, 5=strongly agree). The third item was negative description, using negative scoring. The other three items used positive scoring. In this study, the internal consistency reliability of the scale was 0.858. The confirmatory factor analysis results of it were as follows: the fitting index of χ²/df, RMSEA, CFI, NNFI were 2.377, 0.076, 0.83 and 0.80 respectively.
The perceived organizational support scale was developed by Eisenberger etc. It included 6 items such as ‘The organization attached great importance to my contribution [10]’. The respondents indicated the extent of their agreement with each item on a 6-point Likert-type scale (1=strongly disagree, 6=strongly agree). The fifth item was negative description, using negative scoring. The other items used positive scoring. The higher the score, the more support from the organization. In this study, the internal consistency reliability of the perceived organizational support scale was 0.795. The confirmatory factor analysis results of it were as follows: the fitting index of χ²/df, RMSEA, CFI, NNFI were 2.423, 0.08, 0.91 and 0.881 respectively.
During the investigation, demographics such as gender, age, education, marital status, years of graduation, etc. were used as control variables in this study.
Methods of Data Processing
- 4 -
Results
[image:4.595.109.490.197.247.2]The mean, standard deviation (SD) and Pearson correlation coefficient of every variable were displayed in Table 1. According to the data in Table 1, optimism was negatively related to turnover intention (r=-0.188, p<0.01), and perceived organizational support was negatively related to turnover intention (r=-0.349, p<0.01). This indicated that the more optimistic low-wage white-collars were, the lower their turnover intention would be. And the higher perceived organizational support they got, the lower their turnover intention would be.
Table 1. The Results of Descriptive Statistics Analysis and Correlation Analysis.
Variable Mean SD 1 2 3
OO 3.850 0.552 (0.699)
POS 4.034 0.697 0.123 (0.858)
TI 2.726 0.831 -0.188** -0.349** (0.795)
**p<0.01;*p<0.05; The numbers in parentheses referred to internal consistency reliability coefficients().
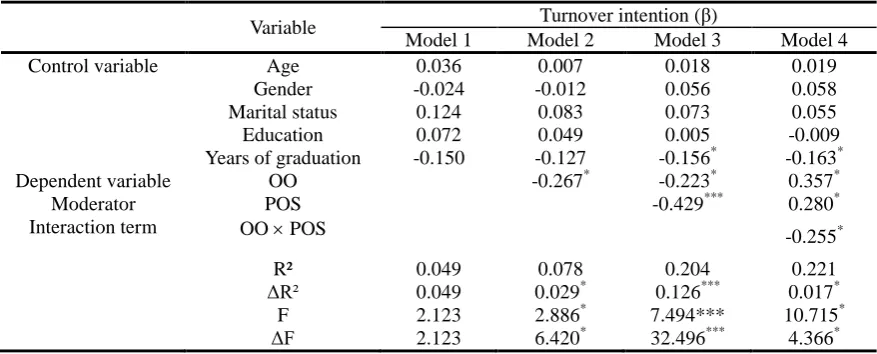
In order to test the effect of optimism on turnover intention, a regression analysis was made, using turnover intention as the dependent variable and demographic variables as control variables. The results were displayed in Table 2. In Model 1, the regression equation was not significant, F in Model 1 was 2.123 (p=0.064), showing that demographic variables of low-wage white-collars had no significant effect on turnover intention.
On the basis of Model 1, optimism was added into the Model 2 as an independent variable. Then the regression equation was significant (β=-0.267, p<0.05), R² was 0.078, showing that optimism could negatively predict turnover intention after controlling the demographic variables. In other words, optimism could negatively predict low-wage white-collars’ turnover intention. Thus, hypothesis 1(H1) was supported.
Table 2. The Results of Hierarchical Regression Analysis among Variables.
Variable Turnover intention (β)
Model 1 Model 2 Model 3 Model 4
Control variable Age 0.036 0.007 0.018 0.019
Gender -0.024 -0.012 0.056 0.058
Marital status 0.124 0.083 0.073 0.055
Education 0.072 0.049 0.005 -0.009
Years of graduation -0.150 -0.127 -0.156* -0.163*
Dependent variable OO -0.267* -0.223* 0.357*
Moderator POS -0.429*** 0.280*
Interaction term OO POS -0.255*
R² 0.049 0.078 0.204 0.221
ΔR² 0.049 0.029* 0.126*** 0.017*
F 2.123 2.886* 7.494*** 10.715*
ΔF 2.123 6.420* 32.496*** 4.366*
***p<0.001;**p<0.01;*p<0.05
[image:4.595.78.517.434.611.2]on turnover intention with the increase of perceived organizational support. Thus, hypothesis 2 (H2) was supported.
Discussion
Two main conclusions were made through this study. Firstly, optimism was negatively related to low-wage white-collars’ turnover intention. That is to say, the more optimistic, the lower the low-wage white-collars’ turnover intention. Secondly, perceived organizational support significantly moderated the relationship between optimism and turnover intention, which means that optimism would make less influence when perceived organizational support is lower and more influence on turnover intention when perceived organizational support is higher.
According to the conclusions, the employers could take measures in two aspects to reduce the low-wage white-collars’ turnover intention. On the one hand, the organizations should pay more attention to the life orientation of low-wage white-collars and try to improve their optimism. In the recruitment of white-collars in low-wage jobs, employers could take the life orientation as one of the selecting standards. Thus, when the applicants’ abilities were comparable, employers with more optimistic should be preferred. In the management of low-wage white-collars, organizations should emphasize training, communication, corporate culture and other ways to make low-wage white-collars gradually become more positive in the subtle influence. On the other hand, low-wage white-collars should be actively promoted to improve the perceived organizational support. There were three specific methods. Firstly, employers should attach great importance to the establishment and implementation of positive organizational policies to support low-wage white-collars’ life and work. Then, organizations should strengthen humanistic care to low-wage white-collars to improve their perceived organizational support and loyalty. Lastly, managers at all levels should timely recognize employees’ values and contributions, and try to provide specific welfares so that low-wage white-collars could get more rewards and recognition.
In this study, inevitably, there are some limitations needed to be considered in the future. First, this study adopted the cross-sectional research of the same point in time, which might not fully reveal the causal relationships among variables. Then, for multiple regression analysis, the number of samples was not large enough, and those samples were mainly concentrated in certain areas, industries or units. The collected sample data would have a certain degree of similarity. So it was difficult to fully reflect the impact brought by the differences in regions, industries and units. In future studies could be conducted to research the conclusions obtained in this study by investigating low-wage white-collars from extensive fields or regions.
References
[1] Scheier M F, Carver C S, Bridges M W. Distinguishing optimism from neuroticism (and trait anxiety, self-mastery, and self-esteem): A re-evaluation of the Life Orientation Test. Journal of Personality and Social Psychology, 1994, 67 (6):1063-1078.
[2] Youssef C M, Luthans F. Positive Organizational Behavior in the Workplace: The Impact of Hope, Optimism and Resiliency. Journal of Management, 2007, 33(5):774-800.
[3] Luthans F, Avolio B J, Walumbwa F O, & Li W. The psychological capital of Chinese workers: Exploring the relationship with performance. Management and Organization Review, 2005(1):247-269.
[4] Chen Weizheng, Xu Lan, Hu Dongmei: Exploring influence of psychological capital on job involvement, job satisfaction and turnover intention, Journal of Chongqing University of Technology (Social Science), 2012(1):18-25. (In Chinese)
- 6 -
[6] Cropanzano R, Howes J C, Crande Y A, et al. The Relationship of Organizational Politics and Support to Work Behavior, Attitudes, and Stress .Journal of Organizational Behavior, 1997, 18(2):159-180.
[7] Allen G, Lynn G, Rodger W. The Role of Perceived Organizational Support and Supportive Human Resource Pratices in the Turnover Process. Journal of Management, 2003, 29(1):99-118.
[8] Ling Wenquan, Fang Liluo, Fu Yiqun: The study on the effecting factors and the Accommodating factors of Chinese enterprises employees’ turnover intention. Journal of Xiangtan University (Philosophy and Social Sciences), 2005(4):65-69. (In Chinese)
[9] Farh J L, Tsui A S, Xin K. The Influence of Relational Demography and Guanxi: The Chinese Case. Organization science, 1998, 9(4):471-488.