2017 2nd International Conference on Artificial Intelligence: Techniques and Applications (AITA 2017) ISBN: 978-1-60595-491-2
3D Visualization of Poplar Seedlings Based on ToF Camera
Chun-hua HU*, Le ZHU, Yao ZHOU and Yang-zheng WU
School of Information Science and Technology, Nanjing Forestry University, No.159, Longpan Road, Nanjing, 210037, Jiangsu Province, China
*Corresponding author
Keywords: NURBS, Hardwood seedlings, Outlier processing, 3D visualization.
Abstract. In this paper, a three-dimensional (3D) visualization method of poplar seedlings was proposed, combined with the ToF camera and digital camera. Firstly, the average distance density method was proposed and employed to process outlier of leaves. Secondly, in order to improve the speed of data fitting, the local section tangent plane normal angle method was introduced to filter redundant points and retain the necessary data, and then the control points were adopted to fit the leaf surface based on Non-Uniform Rational B-Splines (NURBS) fitting algorithm. At the same time, the trunk was fitted based on NURBS according to the control points of the trunk, and the other branches were fitted using iterative method. Finally, the three-dimensional visualization of poplar seedlings was realized. A large number of experiments were carried out, including the normal growth poplar seedlings and the water shortages poplar seedlings. The results demonstrated that the poplar seedlings visualization method proposed in this paper can quickly and accurately reflect the growth states of the poplar seedlings, especially for water-shortage detection.
Introduction
Three-dimensional (3D) visualization technology, especially for the purpose of crop phenotyping and observation is the cutting edge of agriculture and forestry research. Currently, 3D visualization mainly concentrates on modelling according to crop psychological growth rules[1,2], modelling based on combined multi-directional camera[3,4], modelling based on three-dimensional point cloud collection, and modelling on the basement of 3D point cloud combined with video camera technology[5,6]. Combined multi-camera method needs to calibrate cameras from each azimuth to reconstruct the three-dimensional image of the crop, while the 3D laser point cloud technology could obtain the three-dimensional information of the crop without calibration. This paper aims at visiualization for both water deficient and water sufficient leaves. By utilizing 3D point cloud equipment and video camera, poplar saplings’ 3D data can be collected for real-time observation.
color camera, NURBS and generalized cylindrical modelling were able to realize broad-leaf saplings‘3D visualization.
The paper is organized as follows. Section 2 describes the methods of 3D visualization for the poplar seedling. Section 3 demonstrates its performance. Finally, the conclusions are given in section 4.
Methods
Data Collection Platform
A canny camera, a time-of-flight (ToF) camera (SR-4000, MESA Imaging, Switzerland) and a camera bracket were utilized to collect the data. In order to keep the same center of the two cameras, the canny camera and ToF camera were mounted the same center position on the bracket. The SR-4000 is a measurement device that can capture 3D data of infrared radiation light reflective objects in the 10m ranging field. It can connect to the computer through USB or Ethernet. Software was developed to get the 3D information inside the ranging field. At the same time, depth image was saved.
Leaf Segment
The ToF camera was utilized to capture 3D point cloud coordinate
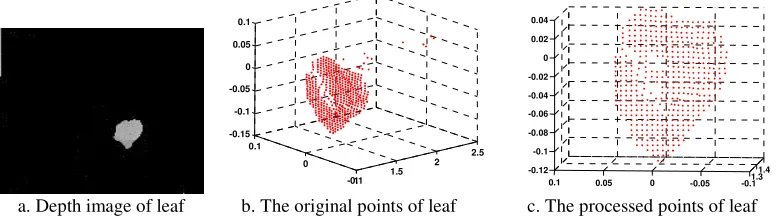
(
x,y,z)
of poplar seedlings. Meanwhile the digital camera in the same center point was used to take poplar seedlings leaves and branches. The depth image was rectified using the calibration parameters, and PSO Otsu method was introduced to segment poplar seedlings[8], color images and depth images of poplar leaves were obtained based on the edge of the leaf shape. According to the depth image, the X coordinates and the Y coordinates were found. As shown in Figure 1, Figure 1.a is the segmentation of the depth of the leaf depth image, Figure 1.b is the corresponding three-dimensional coordinates of the scattered points. There are some parameters which are not the leaf data shown in Figure 1(b). So the outliers of leaf should be trimmed. Recently, there are many ways to remove abnormal values, such as the statistics method, Dixon method and support vector machine cluster method based on the minimum error method. Clustering method is not practical, because this experiment is based on the online sample data processing, not a fixed classification data. According to the analysis of a large number of experimental data, this paper proposes the method of using the method of mean distance density to filter the 3D redundant points of a leaf.Outers are removed based on distance density method by calculating the density of data points and their adjacent points. The density is defined as the reciprocal of all data points’ average distance. The outliers are considered in low density, so for different density data sets will have good detection effect of abnormal value. Its definition is as follows, a set of dimensional data points were given, Nis the number of points, the weighted standard Euler distance between each other was computed, the average distance density is as following.
(
1)
! 1 1 1 2 − − =∑ ∑
= − + = N d N i N i j i j i a σ x x (1)( )
3 1 a d d T = (2) Where da is the average weighted standard Euler distance of data points, Tdis the global averagesample standard deviation. For any xi, the k-nearest neighbor points were chosen and the average
distance density Ti was calculated.
point isolated is point isolated non is i i T T i T T i d d − < ≥ (3)
In this paper, k is eight. Figure 1 displays the processing outliers using the average distance density method. Figure 1.a is the leaf depth image. Figure 1.c shows the processing result of Figure 1.b. The results demonstrate that the method is efficient for filtering outliers.
1 1.5 2 2.5 -0.1 0 0.1 -0.15 -0.1 -0.05 0 0.05 0.1 1.3 1.4 -0.1 -0.05 0 0.05 0.1 -0.12 -0.1 -0.08 -0.06 -0.04 -0.02 0 0.02 0.04
[image:3.612.108.499.200.309.2]a. Depth image of leaf b. The original points of leaf c. The processed points of leaf Figure 1. Processing outliers of 3D point clouds.
3D Reconstructions for Poplar Leaf Based on NURBS
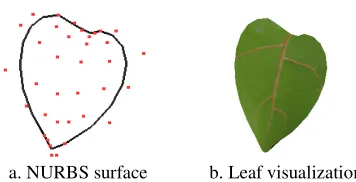
NURBS description of the complex free-form surface has high precision. In recent years, it has become a widely used method of surface reconstruction [9, 10]. Many software applications have adopted NURBS method to reconstruct free-form surface. When an irregular surface is created, the NURBS method is very useful. The NURBS method can describe free curve surface and can accurately represent quadric arc and quadric surface, it provides a common mathematical form, and it can solve two shape information in a unified data structure. NURBS method also has the advantages of flexible operation, stable calculation, the quick speed, and the obvious geometric interpretation etc.
Because leaf texture is difficult to generate by using part tangent surface fitting or triangle fitting. In this paper, the original texture information is preserved, and the NURBS method is used to fit the whole poplar leaf. The choice of control vertex has a great influence on the fitting effect, and the data point cloud needs to be further selected to choose the control points cloud after removing outliers. In this study, ToF camera acquisition poplar seedlings was used to collect the poplar seedlings cloud points. However, though there are few redundant points, those points will have a big influence for the 3D leaf reconstruction. Therefore, this paper puts forward part tangent surface normal angle method to remove redundant points.
For data points
d
i,
i
=
1
,
2
,...,
n
, the K nearest neighbor method is used to find the adjacent datapoints, and NURBS is used to fit its surface. The tangent surface normal
n
i at thepoint
d
i,
i
=
1
,
2
,...,
n
andn
i+1 at the pointd
i+1,
i
=
1
,
2
,...,
n
−
1
were calculated, and then theincluded angle
β
between then
i andn
i+1was computed. In order to filter the redundant points, if angle of the current point to its eight neighborhood points is greater than a certain value or less than a certain value, the point considered as the redundancy will be trimmed. This paper choseβ
<
2
and60
>
[image:4.612.213.391.78.169.2]
a. NURBS surface b. Leaf visualization
Figure 2. 3D visualization of hardwood seedlings based on NURBS.
Results and Discussion
This experiment mainly used the Sony camera and SR4000 three-dimensional depth camera (ToF) as visual sensors, and the processor computer (Intel i5 CPU, 4G memory, win7, 64-bit operating system) was utilized to process the 3D data and leaf traits calculation.
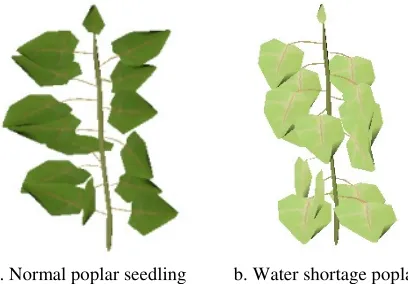
In the campus natural environment, a lot of poplar seedlings were planted in early March this year. When the poplar seedlings had a few leaves samples, we began to collect the seedlings samples data including color image and 3D information data using the Sony camera and the ToF camera. In order to control the plant’s water, when the seedlings had a few leaves, we moved them into greenhouse. All the experiments were carried out in greenhouse. The experiment was not only to observe the growth state of poplar seedlings, but also to observe the symptoms of water shortage in poplar seedlings. Therefore, the experiment samples were divided into two groups with normal watering for one group and insufficient watering for another. The three-dimensional information of seedlings was captured by SR4000, and the depth information and depth gray-scale were obtained. The depth image resolution was 144 × 176. In order to obtain the accurate texture information of the leaf, the depth camera was replaced by a digital camera, and the center of the camera was adjusted to the same height as the depth camera to capture the color image information of the seedlings. 3D visualization of sampling was constructed Based on VC ++ 2010 and OpenGL. In this experiment, a large number of three-dimensional visualization poplar seedlings in normal growth state and water shortage state were reconstructed.
[image:5.612.203.407.69.211.2]
a. Normal poplar seedling b. Water shortage poplar Figure 3. 3D visualization of poplar.
Conclusions
In this paper, a poplar seedlings three-dimensional visualization method was proposed, and the data were collected by using ToF camera and digital camera. Firstly, the collected data were segmented and the target sample data were collected. An outlier filtering method was proposed to deal with the abnormal value of the target data point cloud. In order to improve the speed of data fitting and the authenticity of leaves, a new method was proposed to filter the redundant data points from the tangent surface normal included angles of two adjacent points, and the necessary fitting data points were preserved. Then the NURBS algorithm was used to fit the leaves based on the control points. By repetitious experiments, results analysis and contrast, this method proposed in this paper can effectively reconstruct the poplar seedlings.
Acknowledgement
This work is founded by the National Natural Science Foundation of China (31300471), the National 863 high tech program of China (2012AA102002-4) and the Priority Academic Program Development of Jiangsu Higher Education Institutions.
References
[1] A. Lindenmayer. Mathematical models for cellular interactions in development [J]. Journal of Theoretical Biology, 1968, 18(3): 280-315.
[2] M. Prusinkiewicz, Hammel.Language-restricted and iterated function systems, Koch Constructions and L-systems [J].In: Fractal in 3D Computer Graphics and Imagery. ACM SIGGRAPH, Course Note 13, 1994, 4: l-14.
[3] F. Golbach, G.Kootstr, S.Damjanovic , et al. Validation of plant part measurements using a 3D reconstruction method suitable for high-throughput seedling phenotyping [J]. Machine Vision and Applications (Special Issue), 2015, pp.1-18.
[4] C.H. Teng, Y. S. Chen. Image-based tree modeling from a few images with very narrow viewing range [J]. Vis Comput 2009, 25: 297–307.
[5] T. Yun, A. Feng, W. Z. Li etc.A Novel Approach for Retrieving Tree Leaf Area from Ground-Based LiDAR Article (PDF Available) in Remote Sensing, 2016, 8(11):942.
[7] X. D. Liu, Y. F. Cao and G. R. Liu. The modelings of rice leaf based on NURBs [J]. Microelectronics and Computer, 2004, 21(9):117-119.
[8] C. H. Hu, Y. D. You and P. P. LI3D Visualization of Broad-leaved Seedlings Leaves Combined Depth Image with Digital Image [C] International Conference on Computer Science and Communication Engineering (CSCE2015), Suzhou, China, 06, 2015, pp. 244-249.
[9] D. Wesslén, S. Seipel Real-time visualization of animated trees [J]. Visual Comput, 2005, 21: 397–405.