International Journal of Emerging Technology and Advanced Engineering
Website: www.ijetae.com (ISSN 2250-2459, ISO 9001:2008 Certified Journal, Volume 3, Issue 8, August 2013)
747
Mining Multi Level Association Rules Using Fuzzy Logic
Usha Rani
1, R Vijaya Prakash
2, Dr. A. Govardhan
31Research Scholar, JNTU, Hyderabad
2Dept. Of Computer Science & Engineering, SR Engineering College, Warangal
3
School of Information Technology, JNTU, Hyderabad
Abstract— Extracting multilevel association rules in transaction databases is most commonly used tasks in data mining. This paper proposes a multilevel association rule mining using fuzzy concepts. This paper uses different fuzzy membership function to retrieve efficient association rules from multi level hierarchies that exist in a transaction dataset. In general, the data can spread into many hierarchies or levels. From such datasets retrieving the association rules is a tedious task. For this reason, in this paper we used the fuzzy-set concepts to retrieve multilevel association rules. This approach adopts a top-down progress and also incorporates fuzzy boundaries instead of sharp boundary intervals to derive large itemsets.
Keywords— Association Rules, Data Mining, Fuzzy Logic.
I. INTRODUCTION
Data mining has attracted a great deal of attention in the information industry and in society as a whole in recent years, due to the wide availability of huge amounts of data and the imminent need for turning such data into useful information and knowledge. The information and knowledge gained can be used for applications ranging from market analysis, fraud detection, and customer retention, to production control and science exploration.
An Association rule mining is an important process in data mining, which determines the co relations between items belonging to a transaction database [1][2][3]. Association rules can be used for marketing, planning and etc. For example, the association rules can be used to identify the customer buying habits in a market-basket analysis, like “if customers buy suit, they are more likely to buy tie as well”. In general, every association rule must satisfy two user specified constraints called support and confidence. The support of a rule XY is defined as the percentage of transactions that contain XY, where X and Y are disjoint sets of items from the given dataset [4][5]. The confidence is defined as the ratio support (XY)/support(X). Here the aim is to find all rules that satisfy user specified minimum support and confidence values. Apriori algorithm is very widely used to algorithm to generate the association rules. The appriori algorithm will generate the rules step by step manner. However, this processing way might cause high computational costs and iterative database scans. The majority of algorithms used for association rule mining are dealt with single-concept level datasets.
But most of the data can be spread into different levels. Such datasets are called multi level datasets or taxonomy datasets. Mining association rules from such datasets will give more exact, accurate and useful information to the user to gain more knowledge from the data. Relevant data item taxonomies are normally preconceived and can be symbolized using hierarchy trees.
In multi level datasets, the data is available in different stages of abstraction or levels. Such levels are represented with concept hierarchies. For example, a user may not only be concerned with the associations between “computer” and “printer", but also wants to know the association between desktop PC price and laser printer price.
This paper proposes a fuzzy multiple-level association rule mining algorithm for extracting implicit knowledge from multi level dataset. It integrates fuzzy set concepts, data-mining technologies and multiple-level taxonomy to find fuzzy association rules from transaction data sets.
II. APRIORI ALGORITHM AND ITS PROPERTY
Apriori employs an iterative approach known as level-wise search, where k-itemsets are used to explore k+1-itemsets. Apriori exploits the following property: If an itemset is frequent, then all its subsets are also frequent [8]. The idea is frequent itemset must have subsets of frequent itemsets. Let k-itemset is an itemset having k items. Let Lk represent the set of frequent k-itemsets and
Ck is the set of candidate k-itemsets. Therefore the algorithm to generate the frequent itemsets is follows:
i. A Ck is a set of candidate k-itemsets, which is
generated by joining Lk-1.
ii. Ck is a superset of Lk, that is, its members may or may not be frequent, but all of the frequent k -itemsets are included in Ck.
iii. All candidates having a count greater than the minimum support count are frequent and belong to
Lk
iv. The itemsets in Ck which that is not in Lk-1 are
deleted.
International Journal of Emerging Technology and Advanced Engineering
Website: www.ijetae.com (ISSN 2250-2459, ISO 9001:2008 Certified Journal, Volume 3, Issue 8, August 2013)
748 III. MULTILEVEL ASSOCIATION RULES CONCEPT
Mining association rules at multiple concept levels may, however, lead to discovery of more general and
important knowledge from data. Relevant item
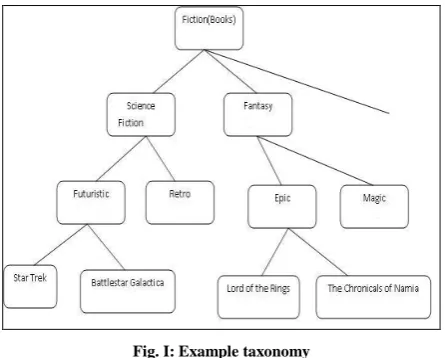
[image:2.595.53.276.268.447.2]taxonomies are usually predefined in real-world applications and can be represented as hierarchy trees. Terminal nodes on the trees represent actual items appearing in transactions; internal nodes represent classes or concepts formed from lower-level [10].All paragraphs must be indented. All paragraphs must be justified, i.e. both left-justified and right-justified.
Fig. I: Example taxonomy
In Fig. I, the root node is at level 0, the internal nodes representing categories like “science” and “Fantasy” , these are at level 1, the internal nodes such as “Futuristic” are at level 2 and the terminal nodes representing books such as “Lord of the Rings” are at level 3. Only terminal nodes appear in transactions [3]. These hierarchies are encoded using sequences of numbers and the symbol “*” according to their positions in the hierarchy tree. For example, the internal node “Science” in Fig. 1 would be represented by 1-*-*, the internal node “Epic” by 2-1-* and the terminal node “The chronicles of Narnia” by 2-1-2 [3].
IV. THE PROPOSED MODEL
The proposed algorithm consist of data mining, multi-level taxonomy and a set of membership functions to explore fuzzy association rules in accordance a given transaction dataset. For this each and every item is assigned a sequence number. The proposed algorithm is
1. Use a sequence of numbers and the symbol “*” to encode the predefined taxonomy. The encoding is started from root with a value zero and continued to next level from left to right by incrementing one value”
2. Di is the i-th transaction, in the dataset, where 1≤ i ≤n (n is the number of transaction), add all of the items with the identical first K digit, compute the k item count for each groups in the transaction and eliminate the groups which their count are less than α where α is the predefined minimum support value in the current level.
3. Consider different membership function for different data items. Each data item has its own characteristics and its own membership function. For each transaction set Di will have an item say Ij
k
, this is a j-th item at level k. This Ijk will have a
quantitative value say Qijk . This Vijk is converted
into a fuzzy set say fijIk. The fijIk will have number of
fuzzy regions for each Ijk this is denoted by hjk. Rilk
(1 ≤ l≤ hjk) is the l-th fuzzy region of Ijk. The Qijk is
defined as
4. Compute the value of each fuzzy region Rilk from
the dataset as,
5. Find the maximum count value say MaxCountjk
among Countilk values (1 ≤ l ≤ hjk), as
If MaxCountjk of a fuzzy region Rilk is equal to the
minimum support threshold (), then place
MaxCountjk into l-frequent itemset.
6. If Llk is null then increase k by one. If r=1 then go
to step 2 otherwise go to next step.
7. The following procedure is carried out for different values.
i) If r = 2 produce the candidate set C2 k
, where C2 k
is the set of candidate itemset with 2 items at level k
ii) If r > 2 then Generate the candidate set Crk, where
Crk is the set of candidate itemsets with r-items on level k
from Lr-1 k
.
8. For each obtained candidate r-itemset say S with items (S1,S2, ..., Sr) in Cr
k
i) Compute the fuzzy value of S using minimum operator of fuzzy logic,
fis= min(fis1,fis2, ... , fisr) ii) Counts is the sum of fis, 1≤i≤n
International Journal of Emerging Technology and Advanced Engineering
Website: www.ijetae.com (ISSN 2250-2459, ISO 9001:2008 Certified Journal, Volume 3, Issue 8, August 2013)
749 9. If Lrk is null then increase k by one and go to the
next step, otherwise increase r by one and go to step 8.
10. If K > p, where p is number of levels in a taxonomy then go to step 11 otherwise set r=1 and go to step 1.
11. Make the fuzzy association rules for all frequent r- itemset including S = (S1, S2, ... , Sr), r>2 as,
Find all the rules XY, where X S and Y S and XY =, XY =S.
Compute the confidence value of all
association rules by:
12. Select the rules which have confidence values greater than predefined confidence threshold value.
V. AN EXAMPLE
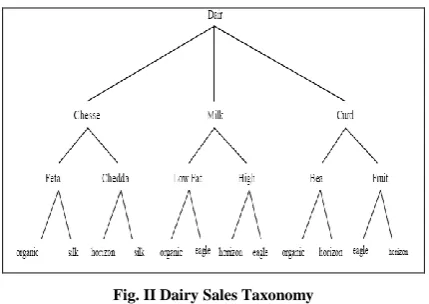
[image:3.595.57.272.415.567.2]To illustrate the above algorithm, we considered a dairy sales transaction from a sales dataset, which is shown in Table I. Its taxonomy is represented in Fig II.
Fig. II Dairy Sales Taxonomy
[image:3.595.324.539.597.701.2]This taxonomy is encoded as specified in algorithm step 1, which is represented in Fig III.
Fig. III Dairy Sales Encoded Taxonomy
In Fig. III, the Dairy Sales transactions taxonomy is divided into 3 classes namely chesse, milk, curd. Each of these classes have sub items specifies the type of dairy and producing companies.
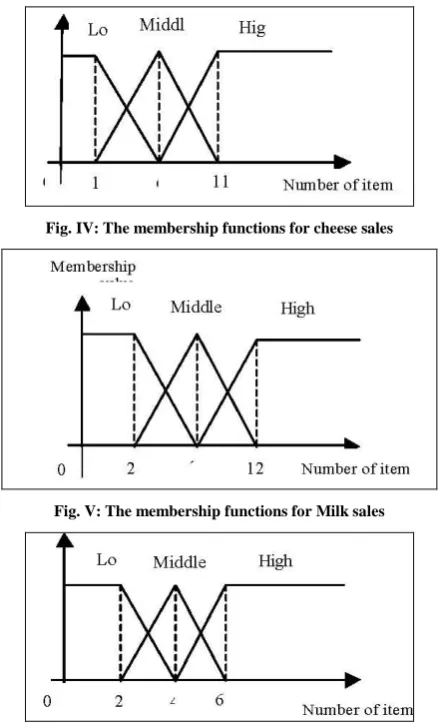
For each class of the dairy, we consider a unique membership function. There are 3 fuzzy regions called low, middle and high are considered for these member functions.
The membership function related to the milk, curd and cheese are shown in Fig. IV, Fig. V and Fig. VI respectively.
Table I
SIX EXAMPLE TRANSACTIONS
TID Items
D1
(organic feta cheese, 1) (silk feta cheese, 4) (organic low fat milk, 4) (eagle low fat milk, 6) (organic bean curd, 7)
D2 (organic feta cheese, 3) (silk feta cheese, 3) (horizon
cheddar cheese, 1) (horizon high fat milk, 5) (eagle high fat milk, 3), (horizon fruit curd, 4) (eagle fruit curd, 4)
D3 (organic low fat milk, 7) (horizon high fat milk, 8)
(horizon bean curd, 5) (horizon fruit curd, 7) D4 (organic feta cheese, 2) (organic low fat milk, 5)
(horizon bean curd, 5)
D5 (organic low fat milk, 5)( eagle high fat milk, 4)
D6 (organic feta cheese, 3) (silk feta cheese, 10)
The above Table I, each and every item is identified by a unique id called TID. The items are represented as pair first represent the item description from lower level to higher level and these item counts, i.e. (organic feta cheese, 1) means the organic feta cheese is available in the dataset only once. Similarly, organic beat curd is repeating in the dataset seven times.
This Table I is encoded with respect to Fig 3, i.e. the item Organic Feta cheese can be encoded as 111. All the items in the Table I are encoded and represented in Table II.
Table II
ENCODED TRANSACTION DATA
TID Items
D1 (111, 1) (112, 4) (211, 4) (212, 6) (311, 7)
D2 (111, 3) (112, 3) (121, 1) (221, 5) (222, 3) (322,
4) (321, 4)
D3 (211, 7) (221, 8) (312, 5) (322, 7)
D4 (111, 2) (211, 5) (312, 5)
D5 (211, 5) (222, 4)
D6 (111, 3) (112, 10)
International Journal of Emerging Technology and Advanced Engineering
Website: www.ijetae.com (ISSN 2250-2459, ISO 9001:2008 Certified Journal, Volume 3, Issue 8, August 2013)
[image:4.595.99.232.154.247.2]750
TABLE III LEVEL REPRESENTATION
TID Items
D1 (1**, 5) (2**, 10) (311, 7)
D2 (1**, 7) (2**, 8) (3**, 8)
D3 (2**, 15) (3**, 12)
D4 (1**, 2) (2**, 5) (3**, 5)
D5 (2**, 9)
D6 (1**, 13)
[image:4.595.54.276.392.755.2]Now the Table III item sets are converted into fuzzy sets based on trapezoidal equation. For example, let consider the item set (1**, 5). According to the Fig 3, this group is belongs to cheese. Similarly, the itemsets (2**, 10) is related to Milk and (3**, 8) is related to Curd respectively. Based on the Trapezoidal membership function the cheese sales are converted into 3 fuzzy regions named as low, middle and high. These are represented in the figures Fig. IV, Fig. V and Fig. VI. The fuzzy value 0.2 indicates the low, 0.8 is middle region and 1 is the high fuzzy regions. The Table IV contains the fuzzy regions for all transactions.
Fig. IV: The membership functions for cheese sales
Fig. V: The membership functions for Milk sales
Fig. VI: The membership functions for Curd sales
After obtaining the fuzzy regions of the three items, now we summed the fuzzy values of each region. For example, consider the 1**.Low fuzzy region. The sum of fuzzy values of this region in all transactions is obtained through the equation 0+0+0. 8+0+0+0. 2=1. The sum of fuzzy values for each individual region has been shown in Table V.
After the above step, now the fuzzy region is selected with highest value for each group. For example the group 1** low region is equal to one, middle region is equal to 1.8 and high region is equal to 1.2. Since the value of the middle region, is 1.8, which is higher than the other two regions, the middle fuzzy region is chosen as the representative of group 1** for other processes. This task is also carried out for other groups. Each of these values is compared with the minimum support and in case it is greater or equal with the predefined minimum support, then it is added to L11. For example consider the
minimum support value is 1, then the 1**.middle, 2**.middle and 3**.middle values are greater than the minimum support. Thus these values are added into L11.
From L11 set a two member candidate set C21 is
generated.
The fuzzy membership value of each of the two-member sets inside the C12 is calculated based on the
predefined membership function for each individual item, for the whole transactions. For example, consider the two member set {1**.Middle, 3**. high}. The fuzzy membership value of this set for transaction D1 is
calculated as: min (0.8, 1) = 0.8. This operation must be carried out for all transactions. All the candidate and frequent itemsets generated and final result of this transaction dataset are shown in Table VI, VII, VIII, IX and X.
We will find the fuzzy association rules based on the frequent itemset obtained from the previous steps. We discover all probable rules from the frequent itemset obtained in different levels with the following format.
{1**=middle} {3**=high}
{3**=high} {1**=middle} {3**=high} {11*=middle}
{11*=middle} {3**=high}
{111=low} {3**=high} {3**=high} {111=low}
International Journal of Emerging Technology and Advanced Engineering
Website: www.ijetae.com (ISSN 2250-2459, ISO 9001:2008 Certified Journal, Volume 3, Issue 8, August 2013)
751
TABLE IV
THE LEVEL-1FUZZY SETS TRANSFORMED FROM THE DATA IN TABLE 3
TID Level -1 Fuzzy set
D1
D2
D3
D4
D5
D6
{1**=middle} {3**= high} {3**=high} {1**=middle} {11*=middle} {3**=high}
TABLE V
THE COUNTS OF THE LEVEL-1FUZZY REGIONS
Items Count (1**.low) 1.0 (1**.middle) 1.8
(1**.high) 1.2 (2**.low) 0.4 (2**.middle) 2.4 (2**.high) 2.2 (3**.high) 0.0 (3**.high) 0.5
(3**.high) 3.5
Table VI
THE SET OF FREQUENT 1-ITEMSETS FOR LEVEL ONE
Itemset Count (1**.middle) 1.8 (2**.middle) 2.4
(3**.high) 3.5
Table VII
THE COUNTS OF THE LEVEL-1FUZZY REGIONS
Itemset
(1**.middle, 2**.middle) (1**.middle, 3**.high)
(2**.middle, 3**.high)
TABLE VIII
THE MEMBERSHIP VALUES FOR 1**.MIDDLE, 3**.HIGH
TID 1**.middle 3**.high Min(1**.middle, 3**.high) D1 0.8 1.0 0.8
D2 0.8 1.0 0.8
D3 0.0 1.0 0.0
D4 0.2 0.5 0.2
D5 0.0 0.0 0.0
D6 0.0 0.0 0.0
Table IX
THE COUNTS OF THE 2-ITEMSETS AT LEVEL 1
Itemset Count
(1**.middle, 2**.middle) 1.4 (1**.middle, 3**.high) 1.8 (2**.middle, 3**.high) 1.7
Table X
ALL FREQUENT ITEMSETS FOR LEVEL-1,LEVEL-2,LEVEL 3
Itemset Count
(1**.middle) 1.8 (2**.middle) 2.4 (3**.high) 3.5 (1**.middle, 3**.high) 1.8
[image:5.595.67.536.142.765.2]International Journal of Emerging Technology and Advanced Engineering
Website: www.ijetae.com (ISSN 2250-2459, ISO 9001:2008 Certified Journal, Volume 3, Issue 8, August 2013)
752
Table XI
CONFIDENCE VALUE FOR ALL RULES
Association rules Confidence
{1** = middle} {3** = high} 1.0 {3** = high} {1** = middle} 1.0 {3** = high} {11* = middle} 0.5 {11* = middle} {3** = high} 1.0
{111 = low} {3** = high} 0.7
{3** = high} {111 = low} 1.4
VI. EXPERIMENTAL RESULTS
The proposed algorithm carries out the analysis on a number of 100 sales invoices of a food stuff store and 7 of its items and based on the predefined taxonomy from 7 items and the predefined membership function per each item, carries out the mining of association rules. The predefined taxonomy in the first level includes 7 nodes that represent the items used in the test, the second level includes 14 nodes that represent the taste or different types of a specific product and in the third level it also consists of 48 nodes that represent the manufacturing companies and factories.
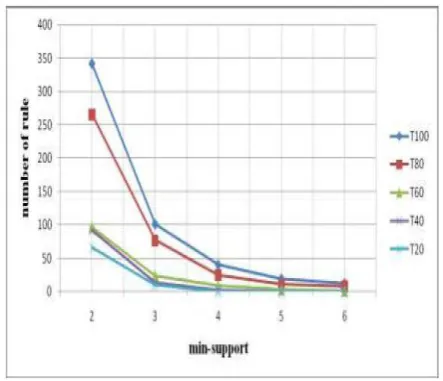
[image:6.595.316.553.301.482.2]The database transactions include the name of the product and the quantity of such products purchased. One item may not be used twice in one transaction. In order to observe the results, we first analyze the proposed algorithm with a different number of transactions and the results based on the number of rules produced and the predefined minimum support for algorithm and the minimum confidence equal to 0. 5 have been shown in Fig. VII.
Fig. VII. Rules generated with different min support
The results obtained based on the number of rules developed and different types of the predefined minimum confidence by the user have been shown in Fig. 8 based on the 100 transactions of the customers’ purchases and minimum support equal to 3. As you can see in Fig. VII, with increased number of the transactions under study, the number of mined association rules will be more and this is obvious and that’s because with the increased number of the transactions, the number of frequent itemset will also increase and as a result, a greater number of rules are mined. Also considering the Fig. VIII, with increased number of the predefined.
[image:6.595.53.275.512.702.2]Minimum confidence value, the number of mined association rules will also decrease.
Fig. VIII. Rules generated with different min support
VII. CONCLUSIONS
In This paper, we have employed fuzzy set concepts, multiple level taxonomy, different membership function for each item to find fuzzy Multi level association rules in a given transaction data set.
The rules mined in this algorithm are desirable for a specific time interval, but it is clear that with the elapse of time, the conditions for sale of items shall be different. As an example, based on different seasons of the year, the number of sales of a series of product may be variant. Therefore in our next work we are going to present a new
method to generate such membership function
International Journal of Emerging Technology and Advanced Engineering
Website: www.ijetae.com (ISSN 2250-2459, ISO 9001:2008 Certified Journal, Volume 3, Issue 8, August 2013)
753 REFERENCES
[1] Agrawal, R., T. Imielinksi and A. Swami, 1993. Mining associations between sets of items in massive databases. In The 1993 ACM SIGMOD Conference on Management of Data, Washington DC, USA, pp: 207-216.
[2] Ha, I., Y. Cai and N. Cercone, 1993. Data-driven of quantitative rules in relational databases. IEEE Tram. Knowledge and Data Eng., 5: 29-40.
[3] Ying Lin, K., B. Chian Chien and T. Pei Hong, 2003. Mining Fuzzy Multiple-Level Association Rules from Quantitative Data. Applied Intelligence, 18: 79-90.
[4] Han, J. and M. Kamber, 2001. Data Mining:Concepts and Techniques. The Morgan Kaufmann Series.
[5] Agrawal, R. and R. Srikant, 1999. Fast algorithms for mining association rules. 20th VLDB Conference, pp: 487-499.
[6] Intan, R., 2008. Mining Multidimensional Fuzzy Association Rules from a Normalized Database. International Conference on Convergence and Hybrid Information Technology.
[7] Ping Huang, Y. and L. Kao, 2004. Using Fuzzy Support and Confidence Setting to Mine Interesting Association Rules. IEEE Annual Meeting, 2: 514-519.
[8] Khare, N., N. Adlakha and K. R. Pardasani, 2009. An Algorithm for Mining Multidimensional Fuzzy Association Rules. International Journal of Computer Science and Information Security, 5: 72-76.
[9] Watanabe, T., 2010. A Fast Fuzzy Association Rules Mining Algorithm Utilizing Output Field Specification. Biomedical Soft Computing and Human Sciences, 16 (2): 69-76.
[10] [10] Liu, B., W. Hsu and Y. Ma, 1999. Mining association rules with multiple minimum supports. Fifth ACM SIGKDD International Conference Knowledge Discovery and Data Mining, pp:125-134.
[11] Pei Hong, T., T. Jung Huang and Ch. Sheng Chang, 2009. Mining Multiple-level Association Rules Based on Pre-large Concepts. I-Tech, Vienna, Austria, pp: 438.