International Journal of Emerging Technology and Advanced Engineering
Website: www.ijetae.com (ISSN 2250-2459, Volume 2, Issue 5, May 2012)81
ECG Signal De-noising using Discrete Wavelet Transform for
removal of 50Hz PLI noise
Prajakta S Gokhale
M.E Student, Department of E&TC, MITCOE, Kothrud, Pune, India
Abstract— An Electrocardiogram (ECG) describes the electrical activity of the heart recorded by electrodes placed on the body surface. ECG is a non-linear, non-stationary signal. Electrocardiogram is an important electrical activity as it is used for the primary diagnosis of heart abnormalities like the myocardial infarction, conduction defects, and arrhythmia. But real ECG signal is often contaminated by different noises. For the purpose of quality diagnosis, the ECG signal must be clearly de-noised to remove all noises. This paper presents a method for De-noising the noisy real ECG signal using wavelet transform. Different ECG signals from MIT/BIH arrhythmia database are used with added Power Line Interference (PLI) noise which is common in ECG signal. The results were evaluated using MATLAB software. De-noised ECG signal is compared with original signal using Mean Square Error (MSE) and Signal to Noise ratio (SNR). MSE and SNR improvements for different noise coverage were calculated and compared for IIR filtering method and wavelet transform method.
Keywords— Discrete Wavelet Transform, ECG signal de-noising, Mean Square Error (MSE), Signal to Noise Ratio (SNR), Thresholding
.
I. INTRODUCTION
An electrocardiogram (ECG or EKG) is a graphic produced by an electrocardiograph, which records the electrical activity of the heart over time. The signal is constructed by measuring electrical potentials between various points of the body using a galvanometer. Understanding the various waves and normal vectors of depolarization and repolarization is very important to obtain useful diagnostic information. ECG signals have a wide array of applications throughout the medical field in determining whether the heart is functioning properly or suffering from any abnormalities. Fig.1 shows normal ECG signal.
Noise contamination of the ECG such as baseline wander, power line interference and muscle activities can pollute the ECG and reduce the clinical value of an ECG signal. Thus, filtering of the ECG signal is a necessary pre-processing step to conserve the useful information and to remove such noises.
American Heart Association (AHA) has defined standard filtering requirements for clinical ECG equipment [1]. ECG signal de-noising algorithms are evaluated based on improved signal to noise ratio (SNR) and Mean Square Error (MSE) for obtaining noise free and readily observable recordings.
Power line interference (PLI) in the ECG signal is one of the major problems in the diagnostic of ECG. This corrupted noise prevents considerably the accurate analysis of the ECG signal and useful information extraction. Different researchers have worked on removal of AC interference (50/60 Hz) so as to retain basic ECG signal characteristics. [4]
Fig.1 The ECG Signal [6]
International Journal of Emerging Technology and Advanced Engineering
Website: www.ijetae.com (ISSN 2250-2459, Volume 2, Issue 5, May 2012)82
II. METHOD
The ECG signal that is used in the paper is part of the MIT-BIH Arrhythmia Database, available online [3]. The recordings downloadable from there were digitized at 360 samples per second. For analysis MATLAB 7.8 is used.
The method can be divided into the following steps:
A. Noise Generation and Addition
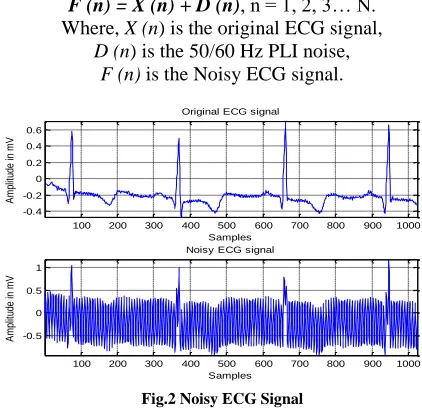
The 50/60 Hz Power line interference noise is generated and added into the original ECG signal samples taken from the MIT/BIH database. The process of adding noise to original signal is mathematically shown as:
F (n) = X (n) + D (n), n = 1, 2, 3… N.
Where, X (n) is the original ECG signal,
D (n) is the 50/60 Hz PLI noise,
[image:2.612.334.542.144.330.2]F (n) is the Noisy ECG signal.
Fig.2 Noisy ECG Signal
Fig. 2 above shows original ECG signal and Noisy ECG signal with added noise.
B. De-noising of Signal
Two methods are used and compared for De-noising of noisy ECG signal.
1. Butterworth IIR notch Filter:
The Butterworth IIR Notch filter is designed using the MATLAB FDATool in which it is required to specify the sampling frequency Fs, Filter order and cut-off frequency (Fc1 and Fc2).
The Fig.3 shows the simulated results of IIR notch filter with 5dB noisy ECG signal. But output de-noised signal shows some ringing effect.
Fig.3 De-noising of ECG signal using IIR Notch Filter
2. Wavelet Transform:
The wavelet transform (WT) is widely used for the analysis of non-stationary signals, because it provides an alternative to the classical Short-Time Fourier Transform (STFT) or Gabor transform. Wavelet Transform can be seen as signal decomposition into a set of basis functions called wavelets. They are obtained from a single prototype wavelet by dilations and contractions as well as shifts.
Discrete Wavelet transform is an emerging tool for the de-noising of non-stationary signals like ECG. There are number of wavelet families like Haar, Daubechies (Db), Symlet etc for analysis and synthesis of signal. Proper selection of wavelet basis function plays a vital role in de-noising. Fig.4 shows Db4 wavelet function. Since Db is mostly morphologically similar to the ECG signal, so in present work Db is used in de-noising and its comparative results with IIR filter and HAAR wavelet are discussed.
Discrete Wavelet Transform is also referred to as decomposition by wavelet filter banks. This is because DWT uses two filters, a low pass filter (LPF) and a high pass filter (HPF) to decompose the signal into different scales. The output coefficients of the LPF are called approximations while the output coefficients of the HPF are called details.
100 200 300 400 500 600 700 800 900 1000 -0.4
-0.2 0 0.2 0.4 0.6
Original ECG signal
Samples
A
m
pl
itu
de
in
m
V
100 200 300 400 500 600 700 800 900 1000 -0.5
0 0.5 1
Noisy ECG signal
Samples
A
m
pl
itu
de
in
m
V
100 200 300 400 500 600 700 800 900 1000
-1.5-1 -0.5 0 0.5
Original ECG signal
Samples
A
m
p
li
tu
d
e
i
n
m
V
100 200 300 400 500 600 700 800 900 1000
-2 -1 0
Noisy ECG signal
Samples
A
m
p
li
tu
d
e
i
n
m
V
100 200 300 400 500 600 700 800 900 1000
-1.5-1 -0.50 0.5
Denoised ECG signal
Samples
A
m
p
li
tu
d
e
i
n
m
[image:2.612.57.268.284.488.2]International Journal of Emerging Technology and Advanced Engineering
Website: www.ijetae.com (ISSN 2250-2459, Volume 2, Issue 5, May 2012)83
Fig.4 Db4 wavelet function
For wavelet analysis the Matlab program, which contains a very good ―wavelet toolbox‖ is used. The main steps of de-noising algorithms based on Wavelet Transform are:
i) ECG Decomposition using the discrete wavelet Transform. (DWT)
ii) Thresholding.
iii) ECG Reconstruction using the inverse DWT (IDWT). First we perform DWT of the noisy ECG signal i.e. signal was decomposed using a wavelet decomposition. Then threshold is applied to the signal after passing through the DWT to remove the coefficients below a certain value, to remove the low amplitude noise or undesired signals and any noise overlap. Threshold is calculated using equation,
√
Where T is the threshold, N is no. of samples, σ is the standard deviation of noise.
Two thresholding methods are used namely hard threshold and Soft threshold. Fig.5 shows the simulated result of the HAAR wavelet transform on the 5dB noisy ECG signal.
We can see no ringing effect in the de-noised ECG signal using HAAR wavelet transform as seen in IIR notch filter shown in Fig 3. But some disturbance in the shape of the ECG wave is observed.
Fig.5 De-noising of ECG signal using HAAR wavelet transform
Secondly de-noising of ECG signal is performed using Daubechies wavelet transform (Db4) to obtain the noise free ECG signal. Fig.6 shows the simulated result of the Daubechies algorithm (Db4). The Daubechies wavelet transforms results shows less distortion in original signal.
Fig.6 De-noising of ECG signal using Db4 wavelet transform
C. Evaluation Measures
De-noised ECG signal is compared with the original ECG signal based upon following evaluation criteria
.
100 200 300 400 500 600 700 800 900 1000
-1.5-1 -0.5 0 0.5
Original ECG signal
Samples
A
m
p
li
tu
d
e
i
n
m
V
100 200 300 400 500 600 700 800 900 1000
-2 -1 0
Noisy ECG signal
Samples
A
m
p
li
tu
d
e
i
n
m
V
100 200 300 400 500 600 700 800 900 1000
-1.5 -1 -0.5 0
Denoised ECG signal
Samples
A
m
p
li
tu
d
e
i
n
m
V
100 200 300 400 500 600 700 800 900 1000
-1.5-1 -0.50 0.5
Original ECG signal
Samples
A
m
p
li
tu
d
e
i
n
m
V
100 200 300 400 500 600 700 800 900 1000
-2 -1 0
Noisy ECG signal
Samples
A
m
p
li
tu
d
e
i
n
m
V
100 200 300 400 500 600 700 800 900 1000
-1.5 -1 -0.5 0 0.5
Denoised ECG signal
Samples
A
m
p
li
tu
d
e
i
n
m
International Journal of Emerging Technology and Advanced Engineering
Website: www.ijetae.com (ISSN 2250-2459, Volume 2, Issue 5, May 2012)84
1. Estimation of Signal to Noise ratio (SNR):The output SNR is given by equation,
[ ∑
∑ ̅̅̅̅̅ ]
Where, is the original ECG signal, ̅̅̅̅̅ is the
de-noised ECG signal and N is the length of ECG signal.
2. Estimation of Mean Square Error (MSE):
It is estimated between the de-noised ECG signal and original ECG signal given by equation,
∑ ̅̅̅̅̅
Where, is the original ECG signal, ̅̅̅̅̅ is de-noised ECG signal and N is the length of ECG signal.
III. RESULTS
In this section, we discussed on the result obtained with the experimental work done. In the proposed de-noising algorithm, the three set of ECG records of MIT/BIH database were used and sampling frequency is set to 360Hz and added with 50 Hz Power line Interference noise with different input SNR values. The effectiveness of proposed algorithm was determined by the MSE and output SNR values.
Table 1
The MSE and SNR values for the de-noising algorithm using IIR Notch filter
ECG
Data I/P SNR = 5 dB I/P SNR =10dB MSE SNR MSE SNR
Sample 1 0.004022 11.24899
1dB 0.018947
4.518131 dB
Sample 2 0.002712 15.10813
5 dB 0.020649
4.518131 dB
Sample 3 0.00262 10.23043
1 dB 0.020421
1.312984 dB
Average 0.003118 12.19585 2dB
0.020005 6
3.4497486 7 dB
[image:4.612.310.585.221.412.2]
The IIR notch filter, HAAR wavelet transform and Daubechies wavelet transform filters were used in proposed algorithm to obtain quality de-noised ECG signal for diagnosis and analysis.
Table 2
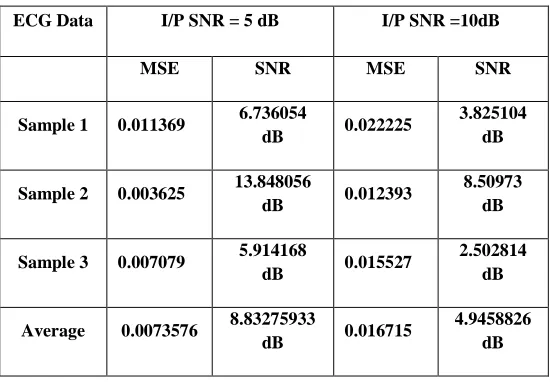
The MSE and SNR values for the de-noising algorithm using HAAR wavelet transform
ECG Data I/P SNR = 5 dB I/P SNR =10dB MSE SNR MSE SNR
Sample 1 0.011369 6.736054
dB 0.022225
3.825104 dB
Sample 2 0.003625 13.848056
dB 0.012393
8.50973 dB
Sample 3 0.007079 5.914168
dB 0.015527
2.502814 dB
Average 0.0073576 8.83275933
dB 0.016715
4.9458826 dB
The Table 1 shows the MSE and SNR values for IIR Notch filter for input SNR values 5dB and 10dB noisy ECG signal. These average results clearly shows that as noise level goes on increasing from 5dB to 10db, MSE increases and SNR decreases. When input SNR increases from 5dB to 10dB, we found 28.28% output SNR values.
Table 2 shows the MSE and SNR values for the HAAR wavelet transform. Obtained result clearly shows that when input SNR values increases from 5dB to 10dB, we found 55.99% output SNR.
Similarly Table 3 shows the MSE and SNR values for the Daubechies (Db4) wavelet transform. It shows output SNR of 11.63739 for 5dB and 10.448457 for 10dB, which gives 89.78% output SNR.
International Journal of Emerging Technology and Advanced Engineering
Website: www.ijetae.com (ISSN 2250-2459, Volume 2, Issue 5, May 2012)85
Table 3
The MSE and SNR values for the de-noising algorithm using Daubechies (Db4) wavelet transform
ECG
Data I/P SNR = 5 dB I/P SNR =10dB MSE SNR MSE SNR
Sample 1 0.0041 11.165439
dB 0.005159
10.167356 dB
Sample 2 0.001882 16.69573
dB 0.002581
15.32390 dB
Sample 3 0.005449 7.051012
dB 0.007177
5.854109 dB
Average 0.0038103 11.6373936
dB 0.004972
10.448457 dB
IV. CONCLUSION
Filtering is an important step in the processing of the ECG signal. The proposed work shows the effect of the wavelet thresholding on the quality reconstruction of an ECG signal. The IIR notch filter applied directly to the non-stationary signal like ECG has shown ringing effect. It can be eliminated using HAAR wavelet transform for de-noising of noisy ECG signal, but it shows disturbance in the shape of the reconstructed waveform. Daubechies Db4 wavelet transform performed better than the other methods to de-noise the noisy ECG signals.
REFERENCES
[1] Kligfield P, Gettes L, Bailey J, et al. ―Recommendations for the Standardization and Interpretation of the Electrocardiogram‖, J Am Coll Cardiol 2007;49:276–281.
[2] Donoho DL. De-noising by soft-thresholding, IEEE Trans. Inform.Theory 1995; 41(3):612-627.
[3] MIT-BIH Arrhythmia Database, www.physionet.org.
[4] Manpreet Kaur, Birmohan Singh,‖ Powerline Interference Reduction in ECG Using Combination of MA Method and IIR Notch‖, International Journal of Recent Trends in Engineering, Vol 2, No. 6, November 2009.
[5] Zhi-Dong Zhao Yu-Quan Chen,‖ A New Method for Removal of Baseline Wander and Power Line Interference in ECG Signals‖, Machine Learning and Cybernetics, International Conference, 10.1109/ICMLC.2006.259082, 04 March 2009.
[6] P. Ghorbanian, A. Ghaffari, A. Jalali, C. Nataraj,‖Heart Arrhythmia detection Using Continuous Wavelet Transform and Principal Component Analysis with Neural Network Classifier.‖, IEEE 2010.
[7] ECG SIGNALS PROCESSING USING WAVELETS, Gordan Cornelia, Reiz Romulus.