INTERGRATION OF CONTROL CHART AND PATTERN RECOGNIZER FOR BIVARIATE QUALITY CONTROL
NURUL ADLIHISAM BIN MOHD SOHAIMI
A thesis submitted in
fulfillment of the requirement for the award of the Degree of Master in Mechanical Engineering
Faculty of Mechanical and Manufacturing Engineering Universiti Tun Hussein Onn Malaysia
iii
ABSTRACT
Monitoring and diagnosis of mean shifts in manufacturing processes become more challenging when involving two or more correlated variables. Unfortunately, most of the existing multivariate statistical process control schemes are only effective in rapid detection but suffer high false alarm. This is referred to as imbalanced performance monitoring. The problem becomes more complicated when dealing with small mean shift particularly in identifying the causable variables. In this research, a scheme that integrated the control charting and pattern recognition technique has been investigated toward improving the quality control (QC) performance. Design considerations involved extensive simulation experiments to select input representation based on raw data and statistical features, recognizer design structure based on individual and Statistical Features-ANN models, and monitoring-diagnosis approach based on single stage and two stages techniques. The study focuses on correlated process mean shifts for cross correlation function, ρ = 0.1, 0.5, 0.9, and mean shift, μ = ± 0.75 ~ 3.00 standard deviations. Among the investigated design, an Integrated Multivariate Exponentially Weighted Moving Average with Artificial Neural Network scheme provides superior performance, namely the Average Run Length for grand average ARL1 = 7.55 7.78 ( for out-of-control) and ARL0 =
ABSTRAK
Pemantauan dan diagnosis ke atas anjakan purata dalam proses pembuatan menjadi
semakin mencabar apabila melibatkan dua atau lebih pembolehubah terkorelasi. Walau
bagaimanapun, skema kawalan proses statistik pembolehubah berbilang yang sedia ada
hanya berkesan bagi pemantauan secara deras tetapi memberikan amaran palsu yang
tinggi. Ini merujuk kepada keupayaan pemantauan yang tidak seimbang. Masalah
menjadi lebih rumit apabila melibatkan anjakan purata yang kecil terutama dalam
mengenalpasti pembolehubah penyebab variasi. Dalam kajian ini, satu skim carta
kawalan bersepadu dan teknik corak pengiktirafan yang telah disiasat kea rah
meningkatkan prestasi kawalan kualiti (QC). Pertimbangan rekabentuk melibatkan
ujikaji simulasi yang mendalam bagi memilih perwakilan masuk berasaskan kepada data
mentah dan sifat-sifat statistik, rekabentuk struktur pengecam berasaskan kepada
model-model individu dan Rangkaian Neural Tiruan ciri-ciri Statistik, serta pendekatan
pemantauan- diagnosis berasaskan kepada teknik-teknik satu peringkat dan dua
peringkat. Kajian ditumpukan ke atas anjakan purata proses terkorelasi pada fungsi
korelasi rentas, ρ = 0.1, 0.5, 0.9 dan anjakan purata proses, μ = ± 0.7~3.00 sisihan
piawai. Diantara rekabentuk-rekabentuk yang dikaji, skema tersepadu Purata Bergerak
Pemberat Exponen Pembolehubah Berbilang bersama Rangkaian Neural Tiruan telah
menghasilkan keputusan yang terbaik, iaitu purata panjang larian untuk purata besar,
ARL1 = 7.55 7.78 (untuk diluar kawalan). Manakala untuk purata panjang larian ARL0
= 491.03 (anjakan min kecil) dan 524.80 (anjakan min esar) dalam proses kawalan dan untuk purata esar ketepatan pengiktirafan (RA) = 96.36 98.74. Kajian ini telah
memberikan perspektif baru dalam merealisasikan pemantauan seimbang dan diagnosis
v
TABLE OF CONTENTS
TITLE
DECLARATION i
ACKNOWLEDGEMENTS ii
ABSTRACT iii
ABSTRAK iv
TABLE OF CONTENTS v
LIST OF TABLES viii
LIST OF FIGURE ix
LIST OF ABBREVIATIONS xi
LIST OF APPENDICES xii
1.0 INTRODUCTION 1
1.1 Introduction 1
1.2 Problem Statement 2
1.3 Purpose of Research 3
1.4 Objective 3
1.5 Scope of Study 3
1.6 Definition of Term 4
1.7 Expected Outcome 5
2.0 LITERATURE REVIEW 6
2.1 Introduction 6
2.2 Process Variation 6
2.3 Statistical Process Control (SPC) 7
2.3.1 Scatter Diagram 9
2.3.3 Flowchart 10
2.4 SPC For Monitoring Multivariate Process Variation 11
2.4.1 Hotelling’s Charts 12
2.4.2 Multivariate Cumulative Sum (MCUSUM) 14
2.4.3 Multivariate Exponentially Weighted Moving Average (MEWMA)
15
2.5 Issue in the Traditional MSPC Application 16
2.6 Pattern scheme for solving issue in MSPC 17
2.6.1 Process Data and Patterns 17
2.6.2 Input Representation 18
2.6.3 ANN Design, Training and Testing 18
2.6.4 Bivariate Process Data and Pattern 18
2.6.5 Overview of Neural Networks 19
2.7 Summary 20
3.0 METHODOLOGY 21
3.1 Introduction 21
3.2 Research Methodology Flow Chart Process 21
3.3 Research Methodology 22
3.3.1 Existing Pattern Recognition (PR) scheme 25
3.3.2 Integrated Pattern Recognition scheme 26
3.3.3 Research question 27
3.4 Preliminary experiment 28
3.5 MATLAB software 33
3.6 Summary 34
4.0 RESULTS AND DISSCUSSION 35
4.1 Introduction 35
4.2 The Baseline Scheme to Monitoring and Diagnosis for Bivariate Quality Control
36
4.2.1 Baseline Scheme 36
4.2.2 Modeling of Bivariate process and patterns 38
4.2.3 Data Generator 39
vii 4.3 Two-Stage Intelligent Scheme for Balanced Monitoring
and Diagnosis
41
4.3.1 Statistical Features-Artificial Neural Network (ANN) Scheme
41
4.3.2 Extraction of Statistical Features 45
4.3.3 Selection of Statistical Features and ANN Structure
46
4.3.4 Performance Result and discussion 50
4.4 Summary 59
5.0 CONCLUSION AND RECOMMENDATION 60
5.1 Summary of conclusion 60
5.2 Recommendation for Further Works 61
REFERENCES 62
LIST OF TABLES
TABLE TITLE PAGE
3.1 Research objective (i) 27
3.2 Research objective (ii) 28
3.3 Analysis of Data Generation for seven types of patterns 28
3.4 Basic data analysis for training 31
4.1 Summary of features selection 47
4.2 ANN architectures 49
4.3 Performance result for Baseline scheme 51
ix
LIST OF FIGURE
FIGURE TITLE PAGE
2.1 Process variation 7
2.2 Step-To-Step Approach to Develop or Improve the Process
8
2.3 Scatter Diagram 9
2.4 Control Chart 10
2.5 Flow Chart Diagram 11
2.6 Advances in MSPC Charting Schemes 12
2.7 Hotelling Chart 13
2.8 Ellipse Graph 14
2.9 MEWMA Chart 15
2.10 Joint Monitoring-Diagnosis 16
2.11 Development of SPCPR Schemes 17
2.12 Bivariate process pattern 19
2.13 The Network Structure of ANN 20
3.1 Research Methodology Flow Chart Process 22
3.2 Conceptual diagram of an integrated MEWMA-ANN scheme
23
3.3 Conceptual diagram for the Statistical Features-ANN scheme
23
3.4 Framework existing pattern recognition (PR) scheme 25 3.5 Framework for integrated Pattern Recognition (PR)
scheme
26
3.6 MATLAB Software 33
4.1 Framework for the Baseline scheme 36
4.3 Framework for the Statistical Features-ANN scheme 43 4.4 Implementation procedure for the Statistical
Features-ANN scheme
44
4.5 Statistical Features-ANN recognizer 49
4.6 ARL1 curve for overall design schemes 57
xi
LIST OF ABBREVIATION
ANN Artificial neural network ARL - Average run length CUSUM - Cumulative sum
EWMA - Exponentially weighted moving average MCUSUM - Multivariate cumulative sum
MEWMA - Multivariate exponentially weighted moving average MPR - Multivariate pattern recognition
MSD - (Mean) x (standard deviation) MSPC - Recognition accuracy
SPC - Statistical process control
SPCPR - Statistical process control pattern recognition PR - Pattern Recognition
SF - Statistical Features BQC - Bivariate quality control
QC - Quality control BS - Baseline
LIST OF APPENDICES
TITLE - PAGE
APPENDIX A - 65
APPENDIX B - 66
APPENDIX C - 67
APPENDIX D - 68
APPENDIX E - 74
APPENDIX F - 84
CHAPTER 1
INTRODUCTION
1.1 Introduction
Quality is define as the customer specification based customer experience with a product or service, measured against his needs - not specified or otherwise, conscious or merely felt, technical or operating entirely subjective - and always represent a moving target in a competitive market (Summers, 2007). Quality control (QC) is the name given to the collection of management techniques and tools used to manage, monitor, and control all steps in the production of quality products desire (Hansen and Prabhakar, 1987). Customer demand for quality products has increased carefully aligned with advances in communications and information technology. Customers want higher expectations and levels of satisfaction, higher quality, lower prices, timely delivery and they want better service than manufactured goods (Masood and Hassan, 2012).
products. Unpredictable changes of machine, material and employers are several contri utors’ unnatural process variation
The process of changing an important issue in quality control, to minimize the change process, statistical quality engineering (SQE) developed statistical process control (SPC). Statistical Process Control (SPC) has become an important approach for industrial processes or tools until today. Statistical process control (SPC) is a powerful and often a tool used to improve product quality by using statistical tools and techniques to monitor, control and improve the process. SPC goal is to achieve higher product quality and lower production costs due to the reduction of product defects. In fact, the manufacturing process involves two or more dependent variables, and therefore an appropriate scheme is required to monitor and identify those variables simultaneously. If this is the case, monitor their separate variables using univariate SPC will inevitably expose to high probability of false alarm occurrences and this can lead to making the wrong decision because of inaccurate data. Appropriate techniques that can be used in this case, known as multivariate Quality Control (MQC). It is basically an extension of simple univariate (one variable at a time) quality control.
1.2 Problem Statement
3
1.3 Purpose of Research
The aim of this study is to design, build and test running a new scheme to enable accurate diagnosis of multivariate (bivariate) means the process of change. Features of this scheme are applicable to the bivariate process (data flow correlation) and conditions online (dynamic data flow). Diagnosis capability will be enhanced by using experimental design techniques in selecting its representative input.
1.4 Objective
I. To design the control charting and pattern recognition techniques in bivariate quality control (BQC). In particular, Statistical Features-ANN model is utilized for pattern recognizer.
II. To evaluate the monitoring and diagnosis performance of the proposed integrated scheme.
1.5 Scope of Study
I. Control charting is focus on MEWMA technique.
II. Pattern recognition is focus on Statistical Features- ANN technique.
III. The bivariate process variables are dependent to each other based on linear cross correlation (ρ).
IV. The predictable patterns of process variation are limited to sudden shifts (upward shift and downward shift).
V. Magnitudes of variation (sudden shifts) are limited within ± 3 standard deviations based on control limits of Shewhart control chart.
1.6 Definition of Term
The following terms are important and frequently used in this research:
I. Statistical Process Control (SPC).
Performance monitoring balanced in traditional SPC scheme is available for quality control bivariate (BQC) has been designed especially for the rapid detection of unusual changes with limited ability to prevent false alarms.
II. Multivariate Statistical Process Control (MSPC)
MSPC toward monitoring and diagnosis of multivariate process variation in mean shift/variances.
III. On-line Process Pattern
On-line process refers to in-process environment in manufacturing industries, that is, during manufacturing operation is running. Based on individual samples, continuous data streams patterns will be produced through automated measuring and inspection devices. An in-control process is represented by random/normal patterns, while an out-of-control process is represented by gradual trend or sudden shift pattern.
IV. Process monitoring and diagnosis
Monitoring means the identification of process status, example for monitoring is statistically stable state or in statistically unstable states. Diagnosing refers to identification of the source variation.
V. Bivariate Patterns
5 VI. Pattern recognition
In this study, it involves a bivariate pattern. According to (Haykin, 1999), Pattern Recognition is the operation of extracting information from an unknown process data stream or signal, and give to one of the specified class or category.
VII. Pattern recognition scheme
Research of (Hassan, 2002) describes a pattern recognition scheme refers to a set of related procedures formulated and presented in a way that unites to address the problem of control chart pattern recognition.
1.7 Expected Outcome
I. A representation scheme that consist of integration between Statistical Process Control (SPC) charting and pattern recognition (PR).
CHAPTER 2
LITERATURE REVIEW
2.1 Introduction
Quality control can be defined as a system that is used to maintain the desired level of quality in a product or service. In other words, is quality control activities to ensure that companies that produce products that meet the quality standards. In a study of existing research related to the subject of this thesis include general assessment of the change process that is known to be a source of low quality and then followed with the use of SPC to monitor changes in multivariate process. Also, limit multivariate quality control (MQC) and research work in multivariate statistical process control (SPC), and statistical pattern recognition process control scheme (SPCPR) are also reviewed.
2.2 Process Variation
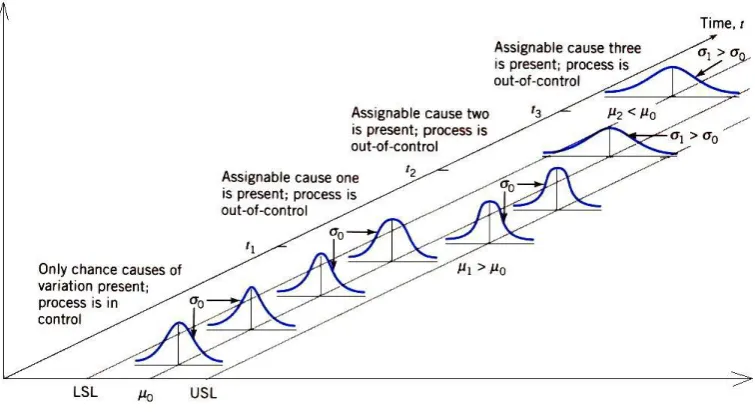
7 produced in different size and properties. Process variation as shown in Figure 2.1 can be influenced by chance causes (random error) and/or assignable causes (systematic errors). The figure shows that from initial time t0 to period t1, process
mean (μ0) and standard deviation (σ0) are in-control. Disturbance due to assignable
causes can be indicated in three situations. Firstly, at time t1, an assignable cause may
shift the process mean (μ1 > μ0) ut maintain the dispersion (σ0). Secondly, at time t2,
it may change the dispersion (σ2 > σ0) ut maintain the mean (μ0). Thirdly, at time t3,
other assignable cause may effects both process mean and dispersion to be out-of-control, μ3 < μ0 and σ3 > σ0.
Figure 2.1: Process variation ( Montgomery, 2005)
In order to maintain and achieve quality improvement, minimizing process variation in manufacturing environment has become a major issue in quality control. Statistical quality engineering (SQE) tools have been developed for systematically reducing variability in the key process variables or quality characteristics of the product (Montgomery, 2001). Statistical process control (SPC) charting is one of the SQE tools that useful for monitoring and diagnosing process variation.
2.3 Statistical Process Control (SPC)
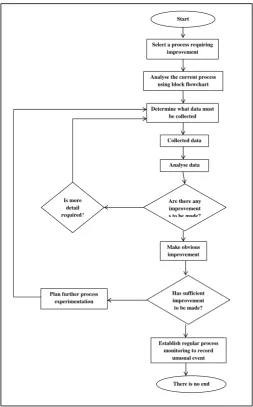
[image:18.595.133.511.278.485.2]be defective. Even under the most closely controlled process, there will always be variation in product output. The responsibility of production is to ensure that product specifications are met and that the final product performs as intended. In order to know what was happening during production, we need to collect and analyzing data from the process (Evans, 1991). Every problem occurs in the process need to be solved. The method that widely used to solve the problem is using statistical process control (SPC) tools. Before that, SPC used to improve the manufacturing process. SPC also used to monitor the process in order to assure that product have good quality. SPC means the application of appropriate statistical tool to process for continuous improvement in quality of product and service.
Figure 2.2: Step-To-Step Approach to Develop or Improve the Process (Evans, 1991) Start
Select a process requiring improvement
Determine what data must be collected Analyse the current process
using block flowchart
Collected data
Analyse data
Are there any improvement s to be made?
Make obvious improvement
Has sufficient improvement to be made?
Establish regular process monitoring to record
unusual event
There is no end Is more
detail required?
9 Referring to Stevenson (2005), there are seven tools in SPC. The seven tools of SPC are state as below:
I. Check sheet II. Pareto Chart
III. Cause and Effects Diagram IV. Histogram
V. Scatter Diagram VI. Control Chart VII. Flowchart
2.3.1 Scatter Diagram
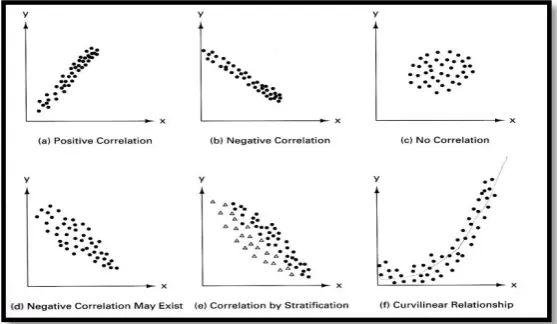
[image:20.595.178.457.441.603.2]Scatter Diagram is the simplest way to determine if a cause and effect relationship exists between two variables. It is used to find the correlation between paired set data and supply the data to confirm a hypothesis that two variables are related. Figure 2.3 shows the types of Scatter diagram.
Figure 2.3: Scatter Diagram (Doty, 1996)
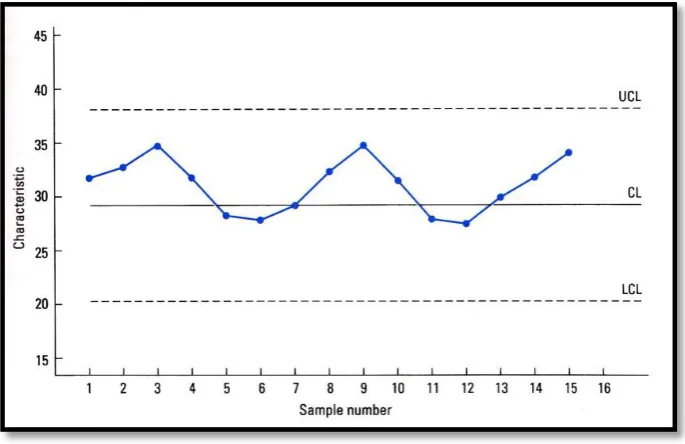
2.3.2 Control Chart
chart and it is used to record the variation. There is also the R charts. Figure 2.4 shows the example of control chart.
Figure 2.4: Control Chart (Besterfield, 1994)
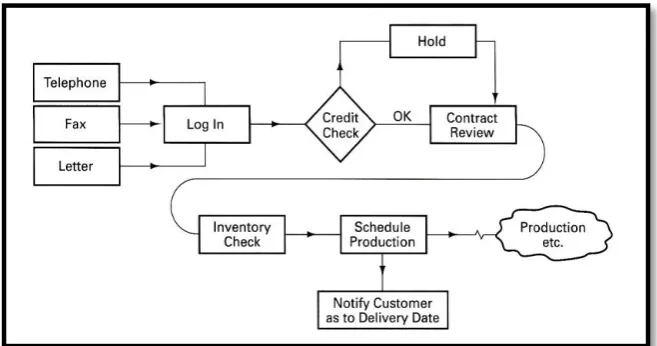
2.3.3 Flowchart
[image:21.595.147.490.115.337.2]11
Figure 2.5: Flow Chart Diagram
2.4 SPC For Monitoring Multivariate Process Variation
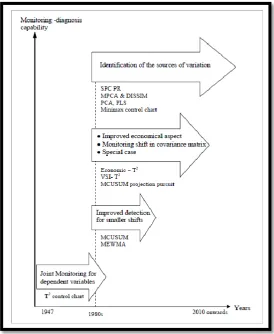
The process of monitoring problems in several variables is called Multivariate Statistical Process Control (MSPC). One of the major disadvantages of a univariate monitoring scheme is that for a single process, many variables may be monitored and even controlled. The MSPC methods overcome this disadvantage by monitoring several variables simultaneously. Using multivariate statistical process control methods, engineers and manufacturers who monitor complex processes can monitor the stability of their process. In Figure 2.6 shows the advances in MSPC charting schemes.
There are two phases of objectives in multivariate control charts. The objectives are: I. To identify the shifts in mean vector that might distort the estimation of the
in-control mean vector and variance covariance matrix
[image:22.595.153.482.73.246.2]Figure 2.6: Advances in MSPC Charting Schemes (Montgometry, 1972)
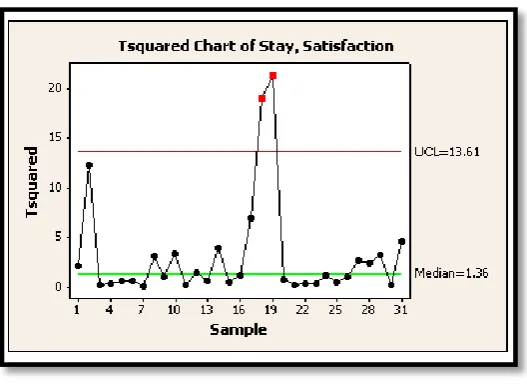
2.4.1 Hotelling’s Charts
[image:23.595.180.455.72.407.2]13
Figure 2.7: Hotelling Chart (Minitab 15)
Hotelling is used to analyze the correlated set of variables. If the process generate an uncorrelated bivariate observation ( and ), the formula for each variables is:
(2.2)
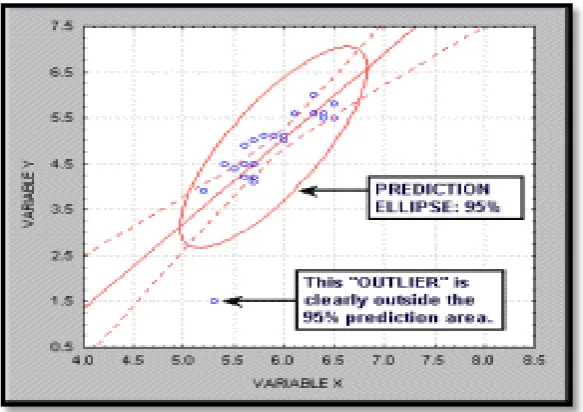
Figure 2.8: Ellipse Graph (Minitab 15)
The Hotelling’s is used to describe the behavior of statistical distance and it is good at detecting large shifts. The assumption to use this chart is the observation need to follow the multivariate normal distribution. By using the matrix equation:
(2.3)
Where while and shows the covariance matrix. So, the Hotelling’s can be represented as:
̅ ̅ (2.4)
2.4.2 Multivariate Cumulative Sum (MCUSUM)
[image:25.595.191.483.73.279.2]15 MCUSUM directly from observation before reduced it to weighted measurement. The shift size in term of quantity can be defined as:
⁄ (2.5)
If the chart in in control state, so the value of is equal to zero. There is also MCUSUM chart that use the root of the . Other than that, in MCUSUM charts, it also has the chart with better ARL properties that based on the statistics:
⁄ (2.6)
where
( )
2.4.3 Multivariate Exponentially Weighted Moving Average (MEWMA)
In the MEWMA chart, each plotted point includes weighting from all previous data, that allowing people to detect small process shifts quicker than with other multivariate methods.
[image:26.595.151.494.537.711.2]2.5 Issue in the Traditional MSPC Application
According to the practicality, one may consider that the bivariate process variation should be easy to monitor and diagnose independently (separately) by several Shewhart control charts. In certain situation, this assumption could be ineffective and most important it will lead to inaccurate decision making. In the presence of data correlation, the unusual sample with respect to the other samples can be identified using joint monitoring approach (based on joint control region) rather than using independent monitoring approach (based on different Shewhart control charts). This situation also indicates that the unusual sample could be deviate based on data correlation structure. Univariate SPC charting schemes is nearly impossible to detect an assignable cause in the presence of bivariate correlated samples Montgomery (2005).
Figure 2.10: Joint Monitoring-Diagnosis (Montgomery, 2005)
[image:27.595.199.440.364.606.2]17 The previous researches have focused on design and application of the MSPC charting schemes.
2.6 Pattern scheme for solving issue in MSPC
Research issues in MSPC pattern recognition can be dispersed throughout the development stages of the schemes in Figure 2.11.
Figure 2.11: Development of SPCPR Schemes (Cheng, 1997)
2.6.1 Process Data and Patterns
[image:28.595.117.527.246.407.2]2.6.2 Input Representation
This is the method that uses to signify the input signal of patterns into the recognizer for the purpose of training, testing and validation towards achieving satisfied result.
2.6.3 ANN Design, Training and Testing
In developing a MSPC pattern recognition scheme, recognizer design and recognizer training and testing are strongly related to each other. The recognizer should be determined based on the ability to classify input representation precisely.
2.6.4 Bivariate Process Data and Pattern
19
Figure 2.12: Bivariate process patterns (Cheng and Cheng, 2008)
2.6.5 Overview of Neural Networks
[image:30.595.151.524.72.339.2]Figure 2.13: The Network Structure of ANN (I. Masood, 2010)
An ANN has several advantages but one of the most recognized of these is the fact that it can actually learn from observing data sets. In this way, ANN is used as a random function approximation tool. These types of tools help estimate the most cost-effective and ideal methods for arriving at solutions while defining computing functions or distributions. ANN takes data samples rather than entire data sets to arrive at solutions, which saves both time and money. ANNs are considered fairly simple mathematical models to enhance existing data analysis technologies.
ANN actually has three data that are interconnected. The first layer is consists of input neurons. The neurons will send data to the second layer, which in turn sends the output neurons to the third. Training an artificial neural network will involve the choosing from allowed models for which there are several associated algorithms.
2.7 Summary
Control charts are widely used in monitoring process variation. The multivariate statistical process control occurs when the manufacturing process involved two or more correlated variables. The main issue in MSPC is the capability to detect an out-of-control process, but it does not directly provide diagnosis information to determine the source of the variables that is responsible for the out-of-control process. The modern technique, which is Artificial Neural Network (ANN), works like human brain. This research is to develop and design an ANN for recognizes multivariate patterns in relation to process variation.
INPUT LAYER
HIDDEN LAYER
[image:31.595.155.483.72.246.2]CHAPTER 3
RESEARCH METHODOLOGY
3.1 Introduction
As part of the study literature has focused on schemes Multivariate Statistical Process Control (SPC), Charting developed for monitoring and diagnosis of bivariate / multivariate process changes. In chapter 2 explains Multivariate Statistical Process Control (SPC) charts like a traditional T2, CUSUM, MEWMA and Statistical Features and continued until the discussion of ANN-based pattern recognition (PR). ANN-based schemes existing based pattern recognition (PR) showed a lack of diagnosis, or in other words they do not have the ability to correctly identify the sources style when dealing with small changes min. design and develop new schemes in this study is designed to realize the increase in the current state of ANN-based schemes existing based pattern recognition (PR).
3.2 Research Methodology Flow Chart Process
Figure 3.1: Research Methodology Flow Chart Process
3.3 Research Methodology
[image:33.595.137.503.69.610.2]23
Figure 3.2: Conceptual diagram of an integrated MEWMA-ANN scheme ( I. Masood,2010)
On Figure 3.2, shows MEWMA-ANN integrated scheme has been developed based on a two stage approach to monitoring and diagnosis. Process monitoring refers to the identification process status in either the statistical situation is stable or not stable, while the diagnosis process refers to the identification variable source (s) of unstable process. In the first stage monitoring, EWMA charts are used to trigger significant changes based on 'one eye out of control'. Immediately triggered a significant shift, Statistical Features-ANN identifier is then used to implement the second stage of monitoring and diagnosis by recognizing patterns of data flow contained point (s) out of control as really unstable or not.
[image:34.595.139.500.71.223.2] [image:34.595.189.453.508.664.2]Figure 3.3, shows its Statistical Feature-ANN identifier consists of two main stage of the process flow and representative input data, and process monitoring and diagnosis. In the first stage, two data streams depends process variables plotted on a scatter diagram to results bivariate displacement pattern. Based on the scattergram, data stream is then converted into its statistical input representative to the ANN. In the second stage, the ANN model is applied monitor and diagnoses significant bivariate process changes through pattern recognition methods. Monitoring refers to identify the status of the process either in statistics stable or unstable state statistical significance. Diagnosis refers to the identification of the source variable (s) that responsible for the unstable situation statistically. in monitoring aspects, one must be able to detect ANN Identifier statistically unstable process as soon as possible with ARL1 small (small type II error) and should be left statistically stable process
running as long as possible with ARL0 large (small type I error). In the area of
62
REFERENCES
Bahreininejed, A., Naseri, R.A, Salehi, M., Salmasnia, A., (2010) On-line analysis out-of-control signal for multivariate control chart using neural network. Int J of Natural and Engineering Sciences 4(3): 27-36
Besterfield, Dale H. (1994). “Quality Control”. 4th
. ed. USA: Prentice Hall Career & Technology.
Cheng CS (1997) A neural network approach for the analysis of control chart patterns. Int J Prod Res 35(3):667-697
Cheng CS, Cheng HP (2008) Identifying the source of variance shifts in multivariate process using neural networks and support vector machins. Expert Syst Appl 35:198-206
Doty, Leonard A. (1996). “Statistical Process Control”. 2nd
. ed. USA: Industrial Press Inc.
El-Midany T.T, El-Baz M.A. Abd. Elwahed M.S. (2010) A proposed framework for control chart pattern recognition in multivariate process using artificial neural network. Expert System With application 37: 1035-1042
Gauri SK, Chakraborty S (2008) Improved recognition of control chart patterns using artificial neural network. Int J Adv Manuf Technol 36:1191-1201
Guh RS (2007) On-line identification and quantification of mean shifts in bivariate processes using a NN-based approach. Qual Reliab Eng Int 23:367-385 Hassan A., Nabi Baksh, M.S Shaharoun, A.M, Jamaluddin, H, (2003) Improved SPC
chart pattern recognition using statistical features. Int J Prod Res 41 (7): 1587-1603
J.H., Yang, M.S., Yang, (2005) A control chart pattern recognition system using a statistical correlation coefficient method. Computer Industrial and Engineering 48:205-221
Lehman RS (1977) Computer simulation and modeling: an introduction. Lawrence Erlbaum, London
Lucas JM, Saccucci MS (1990) Exponentially weighted moving average control chart schemes: properties and enhancements. Techno-metriscs 32(1):1-12 Masood, I., Hassan. A., (2010) Issues in development of artificial neural
network-based control chart pattern recognition schemes. Eur J Sci Res 39 (3): 336-355
Masood, I., Hassan. A., (2012) An integrated MEWMA-ANN scheme towards balanced monitoring and accurate diagnosis of bivariate process mean shifts. Journal of King Saud University 24:93-100
Masood, I., Hassan. A., (2012) Pattern recognition for bivariate process mean shifts using feature-based artificial neural network. Int J Adv Manuf Technol. Montgomery, D.C. (2001). “Introduction to Statistical Quality Control”. 4th
. ed. USA: John Wiley & Sons, Inc.