Journal of Chemical and Pharmaceutical Research, 2014, 6(3):943-948
Research Article
CODEN(USA) : JCPRC5
ISSN : 0975-7384
Based on the effects of retarding growth model factors of shot put
technique development
Xiuqin Liu
Jilin Electrical and Mechanical Engineering School, Jilin, China
_____________________________________________________________________________________________ ABSTRACT
In shot training and competition process, shot throwing distance is a problem of crucial importance. This paper analyzes shot movement process as well as shot movement data by Newton Kinematics and blockage growth model. According to shot movement process different statuses, divide it into hand push process and air flight process the two stages. Control throwing speed enough large, it needs to improve accelerate speed in accelerated process; When throwing shot, ball throwing direction and horizontal direction included angle should keep around 45 degree. Through statistics Olympic Games shot performance data from 1896 to 2004, use Matlab draw out performance general direction, get conclusions that Olympic Games shot event performance growth situation has an analogy of blockage growth model, therefore adopt blockage model to predict Olympic Games shot event performance. Through searching 5 years’ summer Olympic Games champions performance from 1952 to 1968, make prediction of previous Olympic Games shot performance, and true value get more close to predict value with smaller errors. Finally, this paper proposes relative reasonable suggestions on how to let shot putter gets good results in competition by establishing above model.
Key words: Newton Kinematics, blockage growth model, physiological indicator, throwing speed, performance prediction
_____________________________________________________________________________________________ INTRODUCTION
Shot is a traditional event in world athletics court. In 1896, shot has become a formal event in the first modern Olympic Games throwing competition. During men competition, shot diameter should arrive at the range from 110 to 130mm, women should arrive at 95-125mm. In competition, athletes cannot train with apparatus, no matter has apparatus or not, it is not allowed to use apparatus in throwing or landing area inside floor to train throwing. It should throw shot out from internal throwing circle [1-3]. Athletes should start throwing from static posture .It is permitted for athletes to touch iron ring and internal area of stop board. It should use single hand throw shot out from shoulder, when athlete enters into circle and starts trial throwing, shot should hold or close to neck or lower jaw, ball holding hand cannot reduce beneath these part in throwing process. It cannot put shot on the back of shoulder axis [3, 4].
Newton’s laws of motion is Newton first motion law that is inertial law, Newton second motion law and Newton third motion law these three classical mechanics basic motion laws generic terms summarized by Isaac Newton in 17 century and published in Philosophiae Naturalis Principia Mathematica [5, 6]. Jiang Ji-Xiong has ever stated on Newton motion laws and classical mechanics time and space view. Blockage growth model is density correlated population growth model
N
represents population size; t represents time, whenK
=
Nt
population is in zero growth that is dt =0dN
; when increasing one individual per time, it will generate K
1
physical education institute Ma Liang-Hong, Zhan Liang etc [5-7]. Make use of blockage growth model predict Olympic Games athletes’ pole vault high jump performance.
Based on above problems, this paper mainly utilizes computer simulation at same initial speed, under which circumstance throwing angle can arrive farthest distance, finally establishes grey prediction model, predicts future shot performance tendency so that more scientific more valid guide shot putters training and provide theoretical supports for the field multidirectional scientific researching.
SHOT MOVEMENT PROCESS ANALYSIS
According to shot movement process different statuses, divide it into two stages respectively are hand push process and air flight process. On the premise of ignoring air resistance, respectively analyze and solve the two processes. Hand push process
Shot is at accelerated speed in the process, assume that accelerated speed is constant as
a
, in pushing process, push out one arm length asl
, ball out of hands speed isv
, given shot accelerated speed time to bet
1, according to kinematics, it can get:2 1
2
1
at
l
=
(1)
1
at
v
=
(2) Simultaneous formula(1)、(2)can get:
al
v
=
2
Shot flight process in the air
Shot flight process in the air as Figure 1 shows, similarly divides into two parts, respectively are shot moving from throwing point to top point and from shot top point to landing point.
Figure 1: shot flight process in the air
Assume distance between landing point and throwing point is
s
, when shot rising height is H spend time ist
2, time that shot falls from top point to ground ist
3, shot air movement total time isT
. From Newton kinematics formula can get:______________________________________________________________________________
Figure 2: speed dissolution
Landing point and throwing point distance
s
=
v
x⋅
T
, shot in the air total timeT
=
t
2+
t
3, shot rises to topspending time
g
v
t
2=
y.
The second stage: g
h g v
t y2 2
2
3 = +
, to
t
3, because shot putters height generally within1
.
8
m
, so36 . 0 2 ≤
g h
, it has
smaller increment to
t
3, so gv
g h g v
t = y2 +2 ≈ y 2
3
. Therefore
g
v
t
t
=
=
y3 2
, solve
θ
2 sin
2
⋅ =
g v s
. Therefore when shot running speed is fixed, whenθ=45,
s
arrives at the maximum.For the result, it proposes suggestions that if want to get more excellent performance inn shot event, according to
above conclusions, we can find that distance
θ
2 sin 2
⋅ =
g v s
, therefore it should change
v
andθ
to get excellent performance in shot event. Make below suggestions: control throwing speedv
into enough large, it needs to increase accelerated speed in accelerated process; In case hand throwing ball, ball throwing direction and horizontal direction included angleθ
should keep around 45°.BLOCKAGE GROWTH MODEL
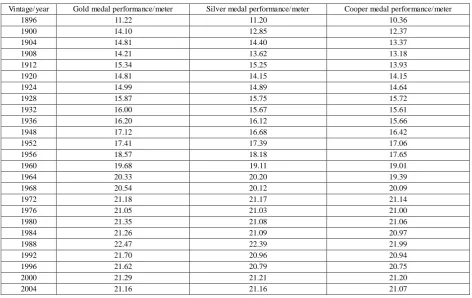
Table1- Each session summe r Olympic Games shot performance statistics
Vintage/year Gold medal performance/meter Silver medal performance/meter Cooper medal performance/meter
1896 11.22 11.20 10.36
1900 14.10 12.85 12.37
1904 14.81 14.40 13.37
1908 14.21 13.62 13.18
1912 15.34 15.25 13.93
1920 14.81 14.15 14.15
1924 14.99 14.89 14.64
1928 15.87 15.75 15.72
1932 16.00 15.67 15.61
1936 16.20 16.12 15.66
1948 17.12 16.68 16.42
1952 17.41 17.39 17.06
1956 18.57 18.18 17.65
1960 19.68 19.11 19.01
1964 20.33 20.20 19.39
1968 20.54 20.12 20.09
1972 21.18 21.17 21.14
1976 21.05 21.03 21.00
1980 21.35 21.08 21.06
1984 21.26 21.09 20.97
1988 22.47 22.39 21.99
1992 21.70 20.96 20.94
1996 21.62 20.79 20.75
2000 21.29 21.21 21.20
2004 21.16 21.16 21.07
[image:4.595.70.543.87.385.2]Utilize Matlab drawing, mark each session summer Olympic Games shot champions performance general directions, figure as following Figure 3.
Figure 3: shot performance trend figure
From above Figure 3, it is clear that Olympic Games shot performance will appear a rapid growth log phase, when arriving at maximum increasing rate, after that due to human themselves physical ability constraint conditions, makes growth rate gradually reduce, shot throwing distance will slowly increase and finally arrive at maximum stable period, growth curve shows type
s
.Olympic Games shot event performance growth situation is similar to blockage growth model, therefore adopt blockage model predict Olympic Games shot event performance.Model establishment
______________________________________________________________________________
reduce with performance
x
increases. If representsr
intox
functionr
(
x
)
.0
)
0
(
),
(
)
(
x
x
t
x
x
r
dt
dx
=
=
(3)Hypothesis of
r
(
x
)
is assumingr
(
x
)
asx
linear function, that is:sx
r
x
r
(
)
=
−
(
r
>
0
,
s
>
0
)
(4)Assume due to human physical ability extreme as well as athletes physical quality, growth rate is
x
m, whenx
=
x
m,performance would not increase, that is growth rate
r
(
x
m)
=
0
, input formula (4) getx
mr
s
=
, then formula (4) is:
−
=
mx
x
r
x
r
(
)
1
(5) Input (5) into equation (3) can get:
=
−
=
0)
0
(
1
x
x
x
x
rx
dt
dx
m (6) Solve equation (6) can get:rt m m
e
x
x
x
t
x
−
−
+
=
1
1
)
(
0 (7) Expression (7) is blockage growth model standard equation.
Model solution
Blockage growth model is:
rt m m
e
x
x
x
t
x
−
−
+
=
1
1
)
(
0Value reciprocals for equations two sides get:
m rt m
x
e
x
x
t
x
−
+
=
01
)
(
1
, that is
rt m m
e
x
x
x
t
x
−
−
+
=
1
1
1
)
(
1
0
.
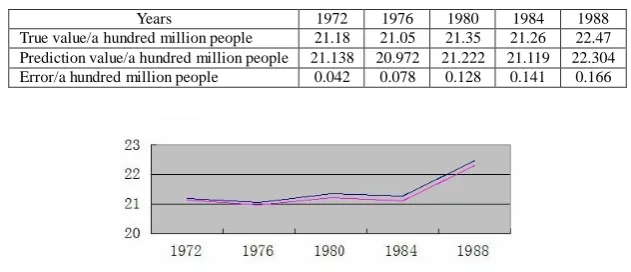
Table 2-Summe r Olympic Games champions performance from 1952 to 1968
Years 1952 1956 1960 1964 1968
Gold medal performance 17.41 18.57 19.68 20.33 20.54
Regard year 1952 as starting time, that is
t
=
0
, year 1968 as ending time, that ist
=
4
; make nonlinear fitting for above table data, apply Matlab programming, get relative parameters, which are r=0.0888 and xm=22.5954.Input (7) gets:
t rt
m m
e
e
x
x
x
t
x
0.08880
2978
.
0
1
5954
.
22
1
1
)
(
−−
+
=
−
+
=
(8) From above formula solve prediction value during year 1972 to 1988 as Table 3.
Table 3-Olympic Games during year 1972 to 1988 shot performance prediction value
Years 1972 1976 1980 1984 1988
True value/a hundred million people 21.18 21.05 21.35 21.26 22.47
Prediction value/a hundred million people 21.138 20.972 21.222 21.119 22.304
Error/a hundred million people 0.042 0.078 0.128 0.141 0.166
Figure 4: Olympic Games from year 1988 to 2004 shot prediction value and true value comparison
From Figure 4, it is clear that assume that Olympic Games performance growth in blockage model, prediction value gets closer to true value, error is smaller.
CONCLUSION
Through statistics Olympic Games shot performance data from year 1896 to 2004, use Matlab drawing performance general directions, get conclusions that Olympic Games shot event performance growth situation is similar to blockage growth model, therefore adopt blockage model predicting Olympic Games shot event performance. By searching 5years’ summer champions’ performance from year 1952 to 1968, make predictions on previous Olympic Games shot performance, and true value gets closer to prediction value; error is smaller. In daily training, athletes should strengthen physical quality and psychological quality training; control optimal throwing angle, basic control around 45°; Athletes should master correct exertion sequence; Take more arms training.
REFERENCES
[1] Zhou Hua-feng. Joournal of Nanjing Institute of Physical Education:Natural Science, 2010, 9(3).
[2] MA Liang-hong,LI Xing,Zhan Liang. Journal of Wuhan Institute of Physical Education, 2008, 42(9), 97-100. [3] Yang Wenxue, LI Tielu, Zhang Yingbo. Journal of Shenyang Sport University, 2012, 31(4), 71-75.
[4] Yang Jian. Journal of Beijing Sport University, 2010, (5), 55-58.
[5] B.Zhang, S. Zhang and G. Lu. Journal of Chemical and Pharmaceutical Research, 2013, 5(9), 256-262. [6] B.Zhang. International Journal of Applied Mathematics and Statistics, 2013, 44(14), 422-430.