Journal of Chemical and Pharmaceutical Research, 2016, 8(6):512-520
Research Article
ISSN : 0975-7384
CODEN(USA) : JCPRC5
Fabrication of PEDOT-PSS modified glassy carbon electrode for Biosensor
and its performance in determining L-dopa in the presence of Ascorbic acid
C. Jayakumar
a, Y. Subba Reddy
a, M. Anbu Kulandainathan
band B. Jeyaraj
a*
a
Department of Chemistry, Loyola Institute of Frontier Energy(LIFE), Loyola College, Chennai, Tamil Nadu, India
bCentral Electrochemical Research Institute (CECRI), Karaikudi, Tamil Nadu, India
_____________________________________________________________________________________________
ABSTRACT
Poly (3,4-ethylenedioxythiophene)-(Poly(4-styrenesulfonate)) was synthesized on the surface of glassy carbon electrode by electrochemical method and used to determine biologically important L-dopa in the presence of a large excess of ascorbic acid by differential pulse voltammetry. The PEDOT-PSS surface was characterized by Scanning electron microscopy and ATR-IR. The oxidation peaks of L-dopa and ascorbic acid (AA) were well separated at PEDOT-PSS modified electrode in phosphate buffer solution (PBS, pH 7.0). A linear relationship between the peak current and concentration of L-dopa was obtained with the correlation co-efficient of 0.999 with the detection limit of 1.6 µM (S/N=3) in the presence of 5mM AA. The proposed method was successfully applied for the determination of L-dopa in pharmaceutical samples.
Key words: PEDOT, PSS, modified electrodes, L-dopa, Ascorbic acid
_____________________________________________________________________________________________
INTRODUCTION
______________________________________________________________________________
electrocatalytic behaviour of PEDOT-PSS film towards the oxidation of L-dopa in the presence of ascorbic acid is described, in addition, the kinetics of mediated electro oxidation of L-dopa at the PEDOT-PSS modified glassy carbon electrode is investigated using cyclic voltammetry. Pulse technique is used to find detection limit of L-dopa. The PEDOT-PSS modified GCE not only exhibits strong catalytic activity towards L-dopa and ascorbic acid but also provides a stable and quantitative analytical reproducible performance.
EXPERIMENTAL SECTION
Reagents and solutions
3,4-ethylenedioxythiophene (EDOT) and Poly(4-styrenesulfonic acid) were purchased from Aldrich Chemicals Germany. LiClO4 and L-dopa were obtained from High media Laboratories and Loba chemie, India. All other
reagents were used of analytical grade and used as received. Aqueous solutions were prepared using double distilled water.
Instrumentations
The electrochemical experiments were carried out using CHI6041C (CH Inc., USA) coupled with a conventional three-electrode cell. The three electrodes namely the working electrode, the auxiliary electrode, and the reference electrode were GCE, Pt wire and Ag/AgCl electrode, respectively. All the potentials in this communication were given against Ag/AgCl. The surface morphology and PSS over PEDOT was characterized by SEM (FEI Quanta FEG 200-High resolution scanning electron microscope) and Perkin Elmer ATR-IR. An (EI-1L model 34 kHz) ultrasonic bath was used for cleaning the electrodes and to prepare a homogeneous mixture
Preparation of PEDOT-PSS modified electrode
Before modifying, the GC electrode was polished with 0.3 and 0.05 µm of alumina slurries for 2 min each, followed by thorough rinsing with double distilled water; the electrode was then sonicated with ethanol and distilled water for 2 min each. After sonicating electrode, it was rinsed with double distilled water and was examined by cyclic voltammetry using standard 1 mM potassium ferric cyanide solution (by evaluating the oxidation and reduction peak potential). The PEDOT-PSS polymer film was electrochemically prepared by electrodeposition from an aqueous solution of 10-3M EDOT and 10-4 M PSS mixture in 0.1M of LiClO4 as supporting electrolyte. Then solution
mixture was sonicated for few minutes and left without any disturbance for few hours. The electrochemical synthesis was carried out by using cyclic voltammetry technique by scanning towards positive potentials from -0.1 to 1.6 V versus Ag/AgCl at a scan rate of 100mVs-1 a typical deep blue colour was observed after 8 cycles. Hereafter, this electrode was named as PEDOT-PSS modified electrode and kept in 0.1M phosphate buffer of pH 7.0 until further use.
RESULTS AND DISCUSSION
Electropolymerization of PEDOT-PSS
The electropolymerization of PEDOT-PSS has been carried out between –1.0 and +1.6 V on the surface of the GCE at a sweep rate of 100 mV s-1 for 8 cycles. (Figure. 1) shows the growth of film during this process of multiple cycles, and current gradually increases with an increase in cyclic time. This indicates PEDOT-PSS polymerization over the surface of GCE. It is clear from the cyclic voltammogram, two oxidation peaks were absorbed namely P1 and P2 at 1.38 V vs Ag/AgCl and 1.25 V vs Ag/AgCl. In conclusion, polymerization of PEDOT-PSS follows two steps. Adsorption of oxidized species over the electrode surface occurs in the first step. The dimer or oligomers which are formed in the first step get further oxidized in the second step [24, 25].
Figure 1 Cyclic voltammogram of PEDOT-PSS
Characterization of PEDOT-PSS film by ATR-IR and Scanning Electron Microscopy (SEM)
To address the surface distribution of the system, we have examined and compared morphologies of PEDOT (Figure. 2a) and PEDOT-PSS films (Figure. 2b) using scanning electron microscopy (SEM). PEDOT surface looks like irregular granular covered with micro fibers, whereas PEDOT- PSS shows a mixture of micro rings and wrinkles over the surface. This confirms the PEDOT-PSS films on the surface of the GCE [26].
[image:3.595.152.437.538.681.2]Figure 2 SEM image of (a) PEDOT, (b) PEDOT-PSS
______________________________________________________________________________
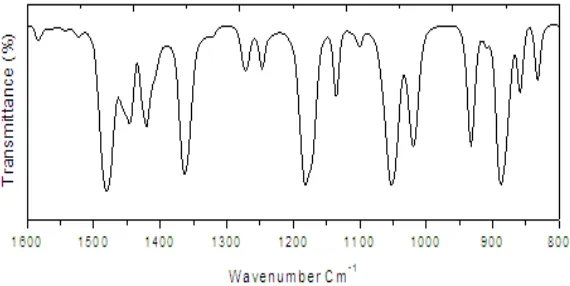
Figure 4 ATR-IR spectra of PEDOT-PSS
Further, Figures 3 and 4 show the FTIR reflectance spectra of EDOT, PEDOT-PSS. The disappearance of bending mode of C-H bond at 885 cm-1, (Figure 4) confirms formation of α-α’-coupled PEDOT molecular chain. Moreover,
the peaks at 1201cm-1 and 934 cm-1 in (Figure 4) are due to PSS stretching frequencies. This result coincides with the earlier reports [24, 26–28]. This clearly confirms the successful formation PEDOT-PSS polymer over GCE.
Electrochemical oxidation of L-dopa
The electrochemical behavior of L-dopa was investigated with CV in 0.1 M phosphate buffer solution at pH 7.0. As shown in (Figure. 5) a weak response and slow electron transaction for L-dopa were observed on a bare electrode. In the +0.40 to 0.5 V region, an oxidation peak of L-dopa at +0.56 vs Ag/AgCl was noted. The PEDOT-PSS modified electrode shows a good electrocatalytic oxidation toward L-dopa indicating that the PEDOT-PSS modified electrode can effectively decrease the oxidation potential of L-dopa to 0.35 V vs Ag/AgCl from 0.46 V vs Ag/AgCl.
Furthermore, the oxidation peak current (Ipa) of L-dopa at PEDOT-PSS modified electrode is three times higher than that of bare electrode with a better reversibility. These results confirm that the PEDOT-PSS on the surface of bare electrode can effectively accelerate the electrochemical redox behavior of L-dopa and significantly increase oxidation current at modified electrode. Thus, the obtained higher oxidation current may be due to π bond attraction
in PEDOT-PSS
Figure 5 Cyclic voltammogram of 5mM L-dopa, (a) bare GCE (b) PEDOT-PSS GCE at pH 7.0
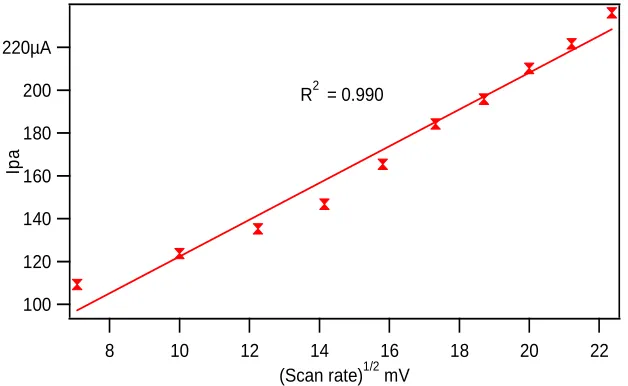
Effect of scan rate
[image:4.595.142.447.498.664.2]200 150 100 50 0 -50 µ A 0.6 0.5 0.4 0.3 0.2 0.1 0.0 -0.1
E/V (vs. Ag/AgCl)
a j 220µA 200 180 160 140 120 100 Ip a 22 20 18 16 14 12 10 8
(Scan rate)1/2 mV R2 = 0.990
[image:5.595.149.453.144.314.2]scan rate from 50 mVs-1 to 500 mVs-1 with a correlation coefficient of 0.990 suggesting that the oxidation of L-dopa at PEDOT-PSS modified GCE’s was diffusion controlled process [29].
Figure 6 CV of the 5mM L-dopa in PBS (pH 7.0) at PEDOT-PSS modified GCE with different scan rates (a–j: 50, 100, 150, 200, 250, 300, 350, 400, 450 and 500 mVs-1)
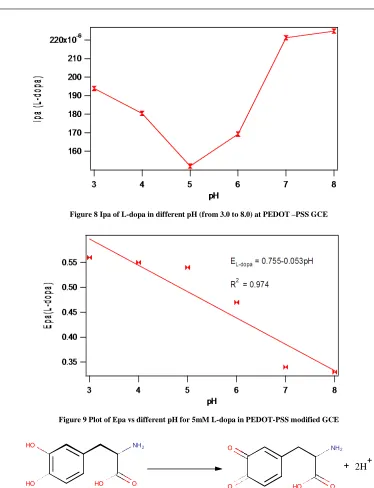
Effect of pH
The CV method was used to study electrochemical response of L-dopa in various pH at PEDOT-PSS modified GCE. Figure. 8a shows anodic peak current of L-dopa in the pH range of 3.0- 8.0. The maximum peak current was observed at 7.0pH. Further increasing of pH shows a nearly saturated current. Thus by considering the biological pH and increasing current, the pH 7.0 was fixed for further study. Moreover (Figure. 8b) demonstrates the Epa of L-dopa at a scan rate of 100mVs-1 in PEDOT-PSS GCE. The Epa of L-dopa shifts towards less oxidation potential. With the increasing of pH, the graph has good linearity with a slope of 53mV/pH. This behaviour nearly obeyed Nernst Equation for equal number of proton and electron transfer reaction [30, 31]. The electrochemical redox process of L-dopa to give dopaquinone is described in Scheme 3.1.
[image:5.595.137.451.465.658.2]______________________________________________________________________________
[image:6.595.125.501.527.581.2]Figure 8 Ipa of L-dopa in different pH (from 3.0 to 8.0) at PEDOT –PSS GCE
Figure 9 Plot of Epa vs different pH for 5mM L-dopa in PEDOT-PSS modified GCE
Scheme 1 Electro oxidation mechanism L-dopa
Determination of L-dopa by DPV
The determination of biomolecules needs high sensitivity. This can be achieved by DPV method normally [32]. Figure 9 shows DPVs obtained from 50µM to 247 µM L-dopa in the presence of 5mM AA at pH 7.0. A clear voltammetric signal was observed for 50µM L-dopa even in the presence of 100 fold higher concentration of AA respectively, which revealed that detection of low concentration of L-dopa is possible even at high concentration of AA.
While varying the concentration of L-dopa in the presence of 5mM AA by standard addition method the oxidation current of L-dopa increased linearly with correlation of co-efficient 0.999 (Figure. 10). Thus, the present modified electrode can be used to determine L-dopa even in the presence of high concentration of AA.
HO
HO HO
NH2
O O
NH2
HO O
O
-Figure 10 DPV of 5mM AA at PEDOT-PSS GCE in the presence of different concentration of L- dopa: (a) 50.0, (b) 77.0, (c) 107.0 (d)
[image:7.595.97.484.87.299.2]147.0 (e) 197.0, (f) 247.0 µM.
Figure 11 Plot of ipa vs Concentration of L-dopa.
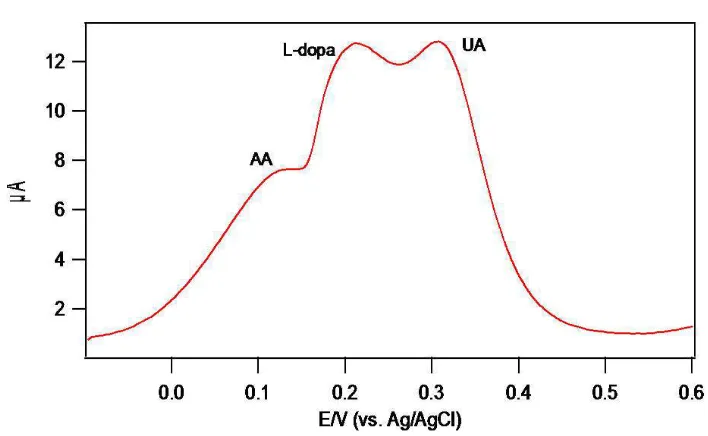
Interference study
______________________________________________________________________________
Figure 12 DPV of 1mM L-dopa, AA and UA in PEDOT-PSS GCE
Figure.12 shows the PEDOT-PSS modified GCE capability to separate the solution mixture of UA, AA and L-dopa. Were as for tryptophan and tyrosine it has highest oxidation potential when comparing with L-dopa, so this eliminates tryptophan and tyrosine interfere in the determination of L-dopa [3338]. According to G. Hu et al though amines like dopamine and epinephrine are electroactive molecule, because of their low concentration in body fluids they do not affect the accurate L-dopa determination [13]. Finally the other foreign species like (100) glucose, (100) urea and (500) NH4+, (500) K+, (500) Na+, (500) Mg2+, (500) Ca2+ were added to (50) L-dopa. The change in peak current was observed with tolerance limit of 5%. The data in the bracket are concentrations of the interfering species in µM
Stability and reproducibility
The PEDOT-PSS was stable and reproducible. However the electrode had to be well treated to remove adsorbed contaminant to maintain the reproducibility. It was found that electrode can be renewed by washing with de-ionized water and continuous scanning in the buffer 0.1M PBS of pH 7.0 after each experiment. Generally, 12 cycles of scanning could be recycled. The PEDOT-PSS had good storage stability in PBS for two days.
Analytical application
The modified electrode was applied to determination of L-dopa in commercial tablets (Syndopa 110); the tablets were purchased from Indian pharmaceuticals. A portion of 0.2 g was weighed accurately and dissolved in 1 mL of 5% acetic acid and made up to 100 mL using 0.1 M PBS at pH 7.0. The standard addition method was used for the determination of L-dopa; the results are shown in Table 1. The average recovery is 98%, indicating applicability and reliability of the proposed method.
Table1 Detection of L-dopa in commercial tablets
Powder tablets Samples
Concentration of L-dopa (µM) Recovery
(%)
Added Found
Sample I 90µM 88µM 97.7%
Sample II 90µM 87µM 96.6%
CONCLUSION
technique, was used to find the detection limit. In comparing with bare electrode, the PEDOT-PSS modified electrode shows higher oxidation current for both L-dopa and AA. This was attributed to greater surface area of PEDOT-PSS. Moreover, the PEDOT-PSS modified electrode having an ability to detect 1.6µM L-dopa in the presence of 5mM AA. Further, it was found that this modified electrode is able to detect L-dopa in tablets with satisfactory recovery percentage.
REFERENCES
[1] JEF Reynolds, Martindale The Extra Pharmacopaeia, 30th Edition, The Pharmaceutical Press, London 1993; 466-472.
[2] Y Misu, Y Goshima, Neurobiology of DOPA as a Neurotransmitter, CRC Press, London, 2005; 261–269. [3] A Barbeau, The Lancet., 1971, 297(7695)395
[4] E Cubo, CG Goetz, Encyclopedia of the Neurological Sciences, Academic press, USA, 2003; 820–825.
[5] C Hannson, G Agrup, H Rorsman, AM Rosengren, E Rosengren, LE Edholm, J. Chromatogr., 1979, 162 (1) 7– 22.
[6] A Tolokan, I Klebovich, K Balogh-Nemes, G Horvai, J. Chromatogr. B., 1997, 698 (1-2) 201–207. [7] J Coello, S Maspoch, N Villegas, Talanta., 2000, 53 (3) 627–637.
[8] P Nagaraj, RA Vasantha, KR Sunitha, J. Pharm. Biomed. Anal., 2001, 25 (3-4) 417–424. [9] EJ Greenhow, LE Spencer, Analyst., 1973, 98 (1168) 485–492.
[10] S Shahrokhian, E Asadian, J. Electroanal. Chem., 2009, 636 (1-2) 40–46.
[11] NF. Atta, MF El-Kady, A Gala, Sens. Actuators, B: Chem., 2009, 141 (2) 566–574. [12] P Prabu, RS Babu, S Narayanan, Sens. Actuators, B: Chem., 2011, 156 (2) 606–614. [13] G Hu, L Chen, Y Guo, X Wang, S Shao, Electrochim. Acta., 2010, 55 (16) 4711–4716. [14] M Arvand, G Navid, Sens. Actuators, B: Chem., 2014, 204 (12) 393–401.
[15] MM Ardakani, A Khoshroo, L Hosseinzadeh. Sens. Actuators, B: Chem., 2014, 204 (12) 282–288. [16] SY Yi, JH Lee, HG Hong, J Appl Electrochem., 2014, 44 (5) 589–597.
[17] U Lange, NV Roznyatovskaya, VM Mirsky, Anal. Chim. Acta., 2008, 614 (1) 1–26. [18] C Li, H Bai, G Shi, Chem. Soc. Rev., 2009, 38 (8) 2397–2409.
[19] J Janata, M Josowicz, Nat. Mater., 2003, 2 (1) 19–24. [20] M Ates, AS Sarac, Prog.Org. Coat., 2009, 66 (4) 337–358. [21] D Kul, CMA Brett, Electroanalysis., 2014, 26 (6) 1320–1325. [22] B Fan, X Mei, J Ouyang, Macromolecules., 2008, 41 (16) 5971–5973.
[23] RR Smith, AP Smith, JT Stricker, BE Taylor, MF Durstock, Macromolecules., 2006, 39 (18) 6071–6074. [24] M Nikolou, GG Malliaras, Chem. Rec., 2008, 8 (1) 13–22.
[25] F Louwet, L Groenendaal, J Dhaen, J Manca, JV Luppen, E Verdonck, L Leenders, Synth. Met., 2003, 135(1-8) 115–117.
[26] F Zhang, A Petr, H Peisert, M Knupfer, L Dunsch, J.Phy. Chem. B., 2004, 108 (45) 17301–17305. [27] TF Otero, JG Martinez, K Hosaka, H Okuzaki, J. Electroanal. Chem., 2011, 657 (1) 23–27.
[28] N Sakceche, S Aeiyach, JJ Aaron, M Jouini, JC Lacroix, PC Lacaze, Langmuir., 1999, 15 (7) 2566–2574. [29] D Han, G Yang, J Song, L Niu, A Ivaska, J. Electroanal. Chem., 2007, 602 (1) 24–28.
[30] N Sakmeche, JJ Aaron, S Aeiyach, PC Lacaze, Electrochim.Acta., 2000, 45 (12) 1921–1931. [31] L Chun, T Imae, Macromolecules., 1994, 37 (7) 2411–2416.
[32] BD Martin, N Nikolov, SK Pollack, A Saprigin, R Shashidhar, F Zhang, PA Heiney, Synth. Met., 2004,142 (1-3) 187–194.
[33] AJ Jeevagan, SA John, Electrochim. Acta., 2013, 95 (8) 246–250.
[34] U Chandra, BEK Swamy, O Gilbert, BS Sheriga, Electrochim. Acta., 2010, 55 (24) 7166–7174. [35] T Thomas, RJ Mascarenhas, BEK. Swamy, J. Mol. Liq., 2012, 174 (1) 70–75.
[36] HR Zare, N Nasirizadeh, MM Ardakani, Electroanal. Chem., 2005, 577 (1) 25–33.
[37] MM Ardakani, B Ganjipour, H Beitollahi, MK Amini, F Mirkhalaf, H Naeimi, M Barzoki, Electrochim. Acta.,
2011, 56 (25) 9113–9120.