International Journal of Emerging Technology and Advanced Engineering
Website: www.ijetae.com (ISSN 2250-2459,ISO 9001:2008 Certified Journal, Volume 2, Issue 12, December 2012)
676
Power Flow Control In A Transmission Line Through UPFC
Parvej khan
1, Himmat singh
21,2Department of electrical engineering, MITS Gwalior
Abstract - Flexible AC transmission system (FACTS) devices uses power electronics components to maintain controllability and capability of electrical power system FACTS controller includes unified power flow controller (UPFC), Static synchronous compensators(STATCOMs), Thyristor controlled series compensators (TCCs), Static series synchronous compensators (SSSCs) and Static VAR compensators (SVCs), are able to modify voltage, phase angle and impedance at particular bus in a power system. The (UPFC) is the most versatile and complex power electronic equipment that has emerged for the control and optimization of power flow in electrical power transmission system. In this paper we see how the UPFC increases the transmission capacity and reduce the power congestion in the transmission line. This paper shows the results that we obtained by implementing a Transmission system in MATLAB Simulink by using UPFC and without using UPFC.
Keywords - FACTS, (UPFC ), AC transmission system, power flow control, STATCOM, SSSC.
I. INTRODUCTION
The unified power flow controller (UPFC) is one of the most widely used FACTs controllers and its main function is to control the voltage, phase angle and impedance of the power system thereby modulating the line reactance and controlling the power flow in the transmission line.
The basic components of the UPFC are two voltage source inverters (VSIs) connected by a common dc storage capacitor which is connected to the power system through a coupling transformers. One (VSIs) is connected in shunt to the transmission system through a shunt transformer, while the other (VSIs) is connected in series to the transmission line through a series transformer. Three phase system voltage of controllable magnitude and phase angle (Vc) are inserted in series with the line to control active and reactive power flows in the transmission line. So, this inverter will exchange active and reactive power with in the line. The shunt inverter is operated in such a way as to demand this dc terminal power (positive or negative) from the line keeping the voltage across the storage capacitor (Vdc) constant.
So, the net real power absorbed from the line by the UPFC is equal to the only losses of the inverters and the transformers.
The remaining capacity of the shunt inverter can be used to exchange reactive power with the line so to provide a voltage regulation at the connection point .The two VSI‟s can work independently from each other by separating the dc side. So in that case, the shunt inverter is operating as a (STATCOM ) that generates or absorbs reactive power to regulate the voltage magnitude at the connection point. The series inverter is operating as ( SSSC) that generates or absorbs reactive power to regulate the current flowing in the transmission line and hence regulate the power flows in the transmission line. The UPFC has many possible
operating modes. (1)VAR control mode:-The reference
input is a simple var request that is maintained by the control system regardless of bus voltage variation. (2) Automatic voltage control mode:-The shunt inverter reactive current is automatically regulated to maintain the transmission line voltage at the point of connection to a reference value with a defined slope characteristics the slope factor defines the per unit voltage error per unit of inverter reactive current within the current range of the inverter. In Particular, the shunt inverter is operating in such a way to inject a controllable current into the transmission line. The figure 1 shows how the (UPFC) is connected to the transmission line.
International Journal of Emerging Technology and Advanced Engineering
Website: www.ijetae.com (ISSN 2250-2459,ISO 9001:2008 Certified Journal, Volume 2, Issue 12, December 2012)
[image:2.612.330.559.328.519.2]677
Fig-2 Shows the Single line diagram of a 500kv/230kv transmission system using UPFC
.
Fig 2.
Description of above single line diagram:
The power flow in a 500 kV /230 kV transmission systems is shown in single line in fig 2. The system is connected in a loop configuration, consists of five buses (B1 to B5) interconnected through three transmission lines (L1, L2, L3) and two 500 kV/230 kV transformer banks Tr1 and Tr2. Two power plants located on the 230 kV system generate a total of 1500 MW (illustrated in figure 2) which is transmitted to a 500 kV, 15000 MVA equivalent and to a 200 MW load connected at bus B3. Each plant model includes a speed regulator, an excitation system as well as a power system stabilizer (PSS). In normal operation, most of the 1200 MW generating capacity power plant P1 is exported to the 500 kV equivalents through two 400 MVA transformer connected between buses B4 and B5 .The UPFC is connected at the right end of line L2 is used to control the active and reactive power at the 500kv bus B3 the UPFC used here include two 100 MVA, IGBT based converters (one series converter and one shunt converter) both the converter are interconnected through a DC bus two voltage source inverter connected by a capacitor charged to a DC voltage realize the UPFC the converter number one which is a shunt converter draws real power from the source and exchange it (minus the losses) to the series converter the power balance between the shunt and series converter is maintained to keep the voltage across the DC link capacitor constant.The single line diagram is implemented on MATLAB Simulink.
The series converter is rated 100MVA with a maximum voltage injection of 0.1pu the shunt converter is also rated 100MVA the shunt converter is operated in voltage control mode and the series converter is operated in power flow control mode the series converter can inject a maximum of 10% of nominal line to ground voltage.
Fig-3 MATLAB Simulink model of single line diagram
of above transmission System withoutusing UPFC.
Fig 3.
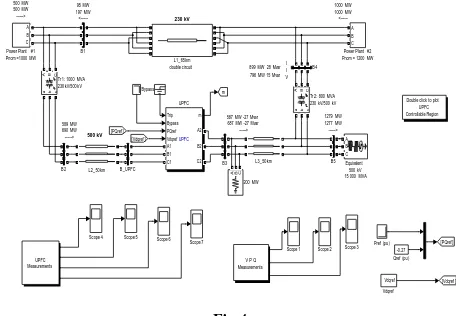
Fig 4: MATLAB Simulink model of above single line
diagram transmission system using UPFC
1000 MW
<---I I V 197 MW
<---1277 MW ---> 500 MW
--->
690 MW --->
687 MW -27 Mvar --->
230 kV
500 kV
796 MW 15 Mvar 95 MW
500 MW 1000 MW
589 MW
587 MW -27 Mvar 1279 MW 899 MW 28 Mvar
Vdqref Vdqref V P Q
Measurements UPFC Measurements UPFC Trip Bypass PQref Vdqref m A1 B1 C1 A2 B2 C2 UPFC
Tr 2: 800 MVA 230 kV/500 kV
ABC
abc
Tr 1: 1000 MVA 230 kV/500 kV
ABC
abc
Double click to plot UPFC Controllable Region Scope 7 Scope 6 Scope 5 Scope 4 Scope 3 Scope 2 Scope 1
Qref (pu ) -0.27 Pref (pu ) Power Plant #2 Pnom = 1200 MW
A B C Power Plant #1
[image:2.612.328.556.557.715.2]Pnom =1000 MW A B C L3_50 km L2_50 km L1_65 km double circuit [PQref ] [Vdqref ] [Vdqref ] [PQref ] m Equivalent 500 kV 15 000 MVA A B C Bypass B_UPFC A B C a b c B5 A B C a b c B4
ABC abc
B3 A B C a b c B2 A B C a b c B1 A B C a b c
200 MW
ABC
Fig 4.
1000 MW
<---I I V 197 MW
<---1277 MW ---> 500 MW
--->
690 MW --->
687 MW -27 Mvar --->
230 kV
500 kV
796 MW 15 Mvar 95 MW
500 MW 1000 MW
589 MW
587 MW -27 Mvar 1279 MW 899 MW 28 Mvar
V P Q Measurements
Tr 2: 800 MVA 230 kV/500 kV
A BC
abc
Tr1: 1000 MVA 230 kV/500 kV
ABC
ab c
Scope 3 Scope 2 Scope 1
Power Plant #2 Pnom = 1200 MW
A B C Power Plant #1
Pnom =1000 MW A B C L3_50 km L2_50 km L1_65 km double circuit Equivalent 500 kV 15 000 MVA A B C B_UPFC A B C a b c B5 A B C a b c B4
A BC abc
B3 A B C a b c B2 A B C a b c B1 A B C a b c
200 MW
International Journal of Emerging Technology and Advanced Engineering
Website: www.ijetae.com (ISSN 2250-2459,ISO 9001:2008 Certified Journal, Volume 2, Issue 12, December 2012)
678
Series injected voltage in pu through a (VSIs) connected in series to the transmission line Through a series transformer without using UPFC.
Note- X-axis represents time in second and Y-axis represents series injected voltage in pu For both upfc and without upfc
.
Fig.5 Graphical result with out using UPFC
Series injected voltage in pu through a (VSIs) connected in series to the transmission line Through a series transformer using UPFC.
Fig.6 Graphical result by using UPFC
Graphical results shows the comparison between the real power flows in the transmission line with and without and using UPFC
Note- Y- axis represents the real power in MW.
Fig.7 Graphical result by using UPFC
Fig.8 Graphical result Without using UPSC
Comparison between reactive power flows in the transmission line with and without using UPFC.
International Journal of Emerging Technology and Advanced Engineering
Website: www.ijetae.com (ISSN 2250-2459,ISO 9001:2008 Certified Journal, Volume 2, Issue 12, December 2012)
679
Fig.9 Graphical result Without using UPFC
Fig.10 Graphical result by using UPFC
II. RESULTS
In the single line diagram the (UPFC) is connected to bus B3 and the simulink results thus we obtain shows that how the(UPFC) reduces the reactive power in the line, without using(UPFC)the reactive power at bus B3 is -27 MVAR and real power at bus B3 is 587MW and remain constant up to t=20sec. but with (UPFC)for a series voltage injection from 0.0094 to 0.1 pu at t= 10 sec the angle of injected voltage start varying at a rate of 45deg/sec the shunt converter is in voltage control mode and the series converter is in power flow control mode the (UPFC) active and reactive power are set in magenta blocks labeled Pref(pu) and Qref(pu) initially the bypass breaker is closed and the resulting power flow at bus B3 is 587MW and the reactive power flow is -27Mvar at t=10sec when the breaker opened the net real power of the(UPFC) is increased by 100MW.
The increase in real power tends to decrease the congestion on bus 5 this can be seen from the simulink result thus we obtained above when the breaker opened the oscillation of reactive power was finished and the reactive
power was then constant at -27Mvar. after
t=10sec the
real power increased by 100MW i.e. from 587MW to
687MW.
III. CONCLUSION
It is necessary to maintain the voltage magnitude, phase angle and line impedance of the transmission system. In this paper the (UPFC) simulation study, matlab simulink is used to simulate the model of UPFC connected to a 3 phase transmission system. This paper presents the control & performance of the UPFC used for power quality improvement. The real and reactive powers increase with the increase in angle of injection. Simulation results show the effectiveness of UPFC to control the real and reactive powers. It is found that there is an improvement in the real and reactive powers through the transmission line when UPFC is introduced. The UPFC system has the advantages like reduce maintenance and ability to control real and reactive powers.
REFERENCES
[1 ] vibhor gupta , “Study and effects of UPFC and its control system for
power flow control and voltage injection in power a power system”, International journal of engineering science and technology vol.2(7),2010,2558-2566
[2 ] Hingorani, N.g., “High power Electronics and Flexible AC
Transmission System”, IEEE Power Eng. REV., july 1988.
[3 ] M. Noroozian, L. Angquist, M. Ghandhari, G. Andersson, “Use of
UPFC for optimal power flow”, IEEE Transactions on Power Delivery, vol. 12, No. 4, October 1997.
[4 ] Phasor Model of UPFC control, MATLAB v 7.6, „help‟- UPFC
power flow control .
[5 ] Control Block of UPFC - M. Toufan, U.D. Annakkage, “Simulation
of The Unified Power Flow Controller performance Using PSCAD/EMTDC,” Electrical Power System Research Vol. 46, 1998, pp 67-75
[6 ] A. J. F. Keri, X. Lombard, A. A. Edris, “Unified Power Flow
Controller (UPFC): Modelling and Analysi s”, IEEE Trans. on Power Delivery, Vol. 14, No. 2, April 1999, pp. 648-654.
[7 ] L. Xu and V.G. Agelidis, “Flying Capacitor Multilevel PWM
Converter Based UPFC‟, IEE Proc. Of Electronic Power Application,Vol. 149, No. 4, July 2003. Page(s) 304-310.
[8 ] Narain G. Hingorani, Laszlo Gyugyi, “Understanding FACTS:
Concepts and Technology of Flexible AC Transmission
Systems,”IEEE Press Marketing, 1999, pp. 297-352, pp. 407-424.
[9 ] C. D. Schauder, D.M. Hamai, A. Edris, “Operation of the Unified
International Journal of Emerging Technology and Advanced Engineering
Website: www.ijetae.com (ISSN 2250-2459,ISO 9001:2008 Certified Journal, Volume 2, Issue 12, December 2012)
680
[10 ]I. Papic, P. Zunko, D. Povh, “Basic control of Unified Power Flow
Controller ” IEEE Trans. on Power Systems, Vol. 12, No. 4,November
[11 ]Power World Simluator v2.0- Glover & sarma, power system