Journal of Chemical and Pharmaceutical Research, 2015, 7(3):1218-1223
Research Article
CODEN(USA) : JCPRC5
ISSN : 0975-7384
Identification of environmental parameters’ importance for frequency
electromagnetic fields based on Monte Carlo sensitivity analysis
Zheng Xu
School of Electrical and Electronic Engineering, North China Electric Power University, Beijing, China
_____________________________________________________________________________________________
ABSTRACT
A sensitivity analysis based on Monte Carlo was performed on frequency electromagnetic fields (FEF) to evaluate relative importance of parameters. Charge simulation method and law of Biot-Savart method were used to establish calculation model of FEF intensity. Sensitivity results distinguished the height of transmission line, interphase spacing, split number, split spacing, sub conductor radius as influential factors, while the height ranked the top, followed by interphase spacing, split number and split spacing were not conspicuous as the first two, sub conductor radius and others were identified as negligible factor to power frequency electronic fields (PFEF) intensity. Meanwhile, the height of transmission line and current were recognized as factors to affect power frequency magnetic field (PFMF), the contribution of height to intensity is proved to be more significant compared with the current. This study provides some useful findings to electromagnetic environment research and high voltage transmission line design
Key words: Monte Carlo, Sensitivity analysis, Frequency Electromagnetic Fields, Charge simulation method, Law of Biot-Savart
_____________________________________________________________________________________________
INTRODUCTION
The unbalance distribution of primary energy and load centers stimulates high-voltage electricity transmission turning to large-scale, long-distance, high-efficiency [1]. The rapid development of high-voltage transmission brings more and more electromagnetic environment concerns [2], some electromagnetic environment parameters determine the route of choice [3], and the electromagnetic environment is an important issue restricting UHV construction.
Great public and scientific concern was raised when early epidemiological studies indicated a correlation between frequency electromagnetic fields (FEF) exposure and the development of childhood leukemia, which has been confirmed by Martje [4] et al, 2014. International Commission on Non-Ionizing Radiation Protection (ICNIRP) required the public exposure values are 5 kV / m for (power frequency electronic fields (PFEF) and 100 µT for power frequency magnetic field (PFMF) at 50 HZ, and each country on the PFMF field exposure values has corresponding provisions [5].
wider application, because of its convenience, accuracy and reliability. PFMF was calculated on the basis of law of Biot-Savart, the calculation method is widely accepted in dimensional calculation [11].
According to these two calculation methods, the FEF intensity is determined by the position of test point and wire, arrangement of wire and phase, characteristics of the wire, voltage and current. Traditionally, influence factors of FEF were distinguished by real data of electromagnetic environment monitoring, but it is a time consuming process and the cost is high [12].
The objective of this paper is to make a sensitivity analysis of FEF calculation model, namely to determine robustness, reliability and efficiency of the model. Consequently, in order to explicitly assess and evaluate the relative importance of each input factor, a probabilistic nondeterministic approach along with a global sensitivity analysis is proposed in this work. Global sensitivity analysis apportions the output uncertainty to the uncertainty in the input factors, covering their entire range space. Variance based methods deliver global, quantitative and model independent sensitivity measures. A sampling-based techniques Monte Carlo simulation is applied; it is focused on the following, (1) which of the input variables variances influences the model output variance at most? And (2) which of the input variables has to be known more accurate to reduce the output variance? Therefore, impact factors and their relative importance are recognized in an easy way, hopes to provide some theoretical basement for the frequency electromagnetic field’s regulation.
EXPERIENTAL SECTION
TRAFFIC INFORMATION FUSION TECHNOLOGY
Charge simulation method is based on the uniqueness theorem of electromagnetic field, the continuously distributed free charge on the electrode surface or bound charge on dielectric surface are equivalent alternative by discrete set of analog charge. The principle of superposition is applied to calculate field quantity of discrete analog charge produced in space. The original continuous distribution of space charge generated electric field distribution is thus obtained.
Taking single homogeneous medium electric field as example, and the application of charge simulation method is as follows:
Firstly, charge simulation equations was established for solving charge density:
1 11 1 12 2 1 2 21 1 22 2 2
1 1 2 2
n
n n
n n
n n nn n
U
Q
Q
Q
U
Q
Q
Q
U
Q
Q
Q
λ
λ
λ
λ
λ
λ
λ
λ
λ
=
+
+ +
=
+
+ +
=
+
+ +
L
L
M
L
(1)where: Ui is the voltage on the wires; Qi is the charge simulation; λij is potential factor and determined by transmission line voltage and phase. Potentiometers coefficient λ can be calculated by following formula:
ii 0
2
1
ln
2
ih
R
λ
πε
=
(2) 01
ln
2
ij ij ijB
D
λ
πε
=
(3)ji
ij
λ
=
λ
(4)where ε0 represents the dielectric constant of the air; hi represents each lead the vertical distance from the ground; Dij is the distance between each conductor; Bij is the distance between the wire and the mirror wire (i = 1, 2, 3, m), Ri is wire radius; as for split wire, Ri is the equivalent radius and it is can be calculated as:
1 i
(
)
n
nr
R
R
R
=
(5)a
180
2 sin(
)
R
n
=
o (6)where a is wire bundle spacing.
And then, electric field intensity near the transmission line at any point P(x, y) can be calculated using Gauss theorem and the principle of superposition:
∑
n i ix i
i=0
0 ij ij
x - x x - x
1
E =
Q (
-
)
2πε
D
B
(7)y 0 0
1
(
)
2
n i i ii ij ij
y
y
y
y
E
Q
D
B
πε
=−
+
=
∑
−
(8)2 2 y
x
E
=
E
+
E
(9)where: x, y are plane coordinate of point P; xi, yi is wire I horizontal and vertical coordinates.
CALCULATION METHOD OF MAGNETIC
PFMF at any point around the wire is deduced according to the law of Biot-Savart [11], ignoring mirror wire. Either current-carrying conductor can be seen as some carriers composed of straight line segments. PFMF at any point around the current carrying conductor can be seen as a vector sum of these straight wires the magnetic field generated at that point. Therefore, limited length current carrying wire model of current carrying wires and law of Biot-Savart are exploited to infer to magnetic field of arbitrary line segments at any point. And then PFMF around the wire at any point can be calculated by superposition theorem. The equations is expressed as follows:
0 x 1
cos
2
n i i i iI
y
y
B
r
µ
ϕ
π
=−
=
∑
(10)0 y 1
sin
2
n i i i iI
x
x
B
r
µ
ϕ
π
=−
=
∑
(11)2 2 x y
B
=
B
+
B
(12)where: xi, yi as the horizontal and vertical coordinates of the wire; x, y coordinate space for horizontal and vertical point P; r is the distance between the point and the wire space P.
SENSITIVITY ANALYSIS METHOD
The sensitivity analysis procedure was carried out using Monte Carlo method, which is a variance-based sensitivity analysis technique, variance-based methods are usually considered to be the most accurate and complete, with the ability to provide a rigorous definition and ranking of input factor importance[13]. It can be decomposed into three stages: pre-processing, numerical simulation and post-processing, with the first and third stages were implemented in a purposefully developed computer program [14-15]. In the first stage, the random variable representing frequency electromagnetic fields parameters is drawn from the uniform statistical distributions. The second stage is implemented by means of the Crystal Ball software package running in the batch mode, with interventions on its input and output files carried out during the simulation, through the developed computer program. In the third stage, the computation of the FEF probability is performed, using the data provided by the numerical simulations to make sensitivity analysis.
RESULTS AND DISCUSSTION
SENSITIVITY ANALYSIS PROCESS
This paper takes the parallel erection single-circuit line defined by Code for design of 1000 kV overhead
electricity is B, A and C. Since all values between the minimum and maximum are equally likely to occur, all parameters are assumed continuous probability distribution. Parameters of FEF and their value range are calculated according to the code and listed in Table 1.
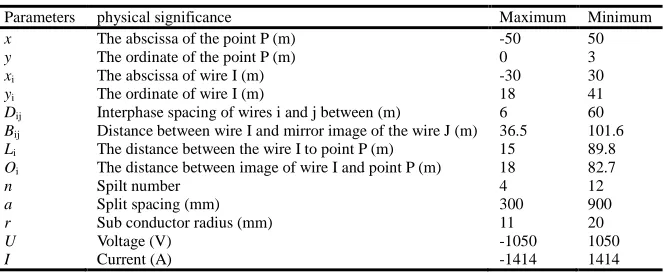
Table. 1: Parameters of frequency electromagnetic fields and their value range
Parameters physical significance Maximum Minimum x The abscissa of the point P (m) -50 50 y The ordinate of the point P (m) 0 3
xi The abscissa of wire I (m) -30 30
yi The ordinate of wire I (m) 18 41
Dij Interphase spacing of wires i and j between (m) 6 60
Bij Distance between wire I and mirror image of the wire J (m) 36.5 101.6
Li The distance between the wire I to point P (m) 15 89.8
Oi The distance between image of wire I and point P (m) 18 82.7
n Spilt number 4 12
a Split spacing (mm) 300 900
r Sub conductor radius (mm) 11 20
U Voltage (V) -1050 1050
I Current (A) -1414 1414
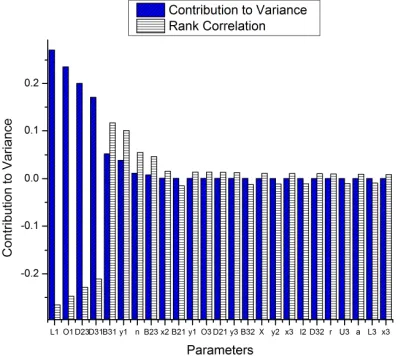
Crystal Ball was exploited to fulfill the sensitivity analysis procedure which contains the following steps: firstly, selecting the set of model input factors that are most relevant; next, attributing suitable probability functions to each input variable. Following this, a sample of input factors is generated from the range of possible input values creating a group of possible model output cases. Subsequently, the model is evaluated for each of the sampled factor combinations to compute the distribution of output indicators. Lastly, Crystal ball ranked their order of importance, returned two sensitivity analysis data the rate of contribution to variance and correlation coefficients. Positive coefficients indicate that an increase in the assumption is associated with an increase in output. Negative coefficients imply the opposite situation. The larger the absolute value of the correlation coefficient, the stronger the relationship. The two output data were graphically depicted by Origin 8.0, as can be seen in Figure 1 and Figure 2.
SENSITIVITY ANALYSIS OF PFEF
The sensitivity study presented within this section reveals several environmental factors influencing the expected PFEF and their relative importance.
At the top of this list is L1 which indicates the distance between monitoring point P and wire A, its contribution to variance is 27.11%, and the correlation coefficient is negative. Namely, increasing the distance between transmission line and the test point will lead to dramatically drop the intensity of PFEF. Other parameters characterized distance are xi, yi and Oi, their contribution to PFEF are also comparatively prominent, the negative coefficient of each parameter indicates the greater the distance, the lower the intensity of PFEF. Elevating wire height is an effective way to cut down the intensity of PFEF on ground; meanwhile, the cost needs to be taken into account in the practical engineering.
It is noteworthy to mention that interphase spacing should be accounted for whenever possible in PFEF analysis. As can be seen from Figure 1, the contribution to variance of interphase spacing is 20.05%, and the correlation coefficient is negative. Contribution to variance of space of wire to image is 5.2%, and the correlation coefficient is positive. So we can get that interphase spacing exhibited moderate impact on PFEF, and the adjustment of interphase is a potential candidate to reduce the intensity of PFEF although effect is not remarkable as hoisting height of wire.
It could be noted here that the spilt number also influences PFEF intensity, and its contribution to variance is 1.16% with the correlation coefficient being positive. Reduction of the conductor the spilt number, the equivalent diameter of wire and wire charge will decrease; therefore, the intensity of PFEF on ground will decrease. It is worth noting: the reduction of spilt number can make the conductor surface electric field increases, and the radio interference and audible noise increase. At present, the improvement of split wire structure and reduction of surface field by increasing the number of split conductors are taken to radio interference reduction for high voltage transmission line and the audible noise level.
The sub conductor radius is a basic structure parameters of transmission line, its influence on PFEF can be seen from the sensitivity analysis results. The correlation coefficient is positive, meaning the reduction of radius will decrease the intensity of PFEF, but the effect is significant negligible.
spacing changes will directly affect the surface electric field of transmission line, and then the transmission line audible noise, radio interference, the ground electric field, natural power, and even the line corridor width have different degrees of impact. Accordingly, many aspects should be taken into account in the actual projects.
Fig.1: Sensitivity of each parameter to the intensity of PFEF
SENSITIVITY ANALYSIS OF PFMF
This paper calculates PFMF according to the law of Biot-Savart, the relative position of test point P and the transmission line and current is measurable, and other influence factors are neglected.
As Figure 2 puts, the sensitivity analysis of PFMF shows that the parameters y1, y2 and y3 which characterize the height of transmission line had the greatest contribution to PFMF intensity on ground. The major contribution to the sensitivities, however, comes from Y1 that phase A wire to ground height, and the negative correlation coefficient indicates the higher transmission line, the lower PFMF intensity. Similarly, the cost of lifting height should be taken into consideration in actual engineering.
The current is recognized by sensitivity analysis as another factor influencing PMEF intensity, and it has slightly smaller effect compared to the height of transmission line. Relative size of two factors can be easily got from Figure 2. The current is directly related to voltage which is set by plan and changed with time. Thus, it can’t be easily to change upon putting the line into operation. While other variables’ contribution to PFMF intensity can be neglected to some extent.
CONCLUSION
A sensitivity analysis based on Monte Carlo was performed on FEF to evaluate relative importance of environmental parameters. Charge simulation method and law of Biot-Savart method were used to establish calculation model of FEF intensity. Sensitivity results indicates the height of transmission line, interphase spacing, split number, split spacing, sub conductor radius were influential factors of FEF intensity, while the height of transmission line ranked the top, followed by the interphase spacing, the split number and split spacing were not conspicuous as the first two, and sub conductor radius and others were identified as negligible factors to PFEF intensity. Meanwhile, the height of transmission line and current were recognized as factors to affect power frequency magnetic field (PFMF), and the contribution of the height to intensity is proved to be more significant compared with the current. Therefore, the tower geometry is a decisive factor of FEF intensity on ground, which is helpful in the electromagnetic environment optimizing and high voltage transmission line designing.
Acknowledgments
This work was supported by the funds for undergraduate innovative experiment plan ofNorth China Electric Power University (national level).
REFERENCES
[1]Humpert C.Energy, 48, 278-283,2012.
[2]Farag A S, Dawoud M M, Cheng T C and Jason S.Electr Pow Syst Res,48, 151-175, 1999. [3]Cassidy P J, Grieve S, Clarke K and Edwards D J. Magn Reson Mater Phy. 14, 20-29,2002. [4]Martje W G D M, Marjolijn D M and Westerink H S.Neurotoxicology. 44, 358-364,2014.
[5]Li C Y, Sung F C, Chen F L, Lee P C, Silva M and Mezei G.Sci Total Environ, 376, 151-159, 2007. [6]Vahidi B, Tayebifar H and Alborzi M J.JElectrostat. 66, 229-233, 2008.
[7]Mimouni A, Rachidi F and Azzouz Z . J Electrostat. 66, 504-513, 2008.
[8]Cai H Z, Xiong B, Han M R and Zhdanov M.Comput Geosci-UK. 73, 164-176, 2014. [9]Doncker P D.Eng Anal Bound Elem. 27, 325-331,2003.
[10]Kawaguchi H and Weiland T. Anal Bound Elem. 36, 968-978, 2012.
[11]Paese E, Geier M, Homrich R P and Rossi R. Appl Math Model. 39, 309-321,2015.
[12]Farag A S, Al-Shehri A, Bakhashwain J, Cheng T C and Penn D.Electr Pow Syst Res. 40, 203-238,1997. [13]Confalonieri R, Bellocchi G, Bregaglio S, Donatelli M and Acutis M.Ecol Model. 221, 1897–906, 2010. [14]Yu X.CMNT, 18, 226-229,2014.