3175
Introduction
There are many studies on the size of an animal or a plant in the literature. For example, mice that overexpressed growth hormone became larger (Palmiter et al., 1982), and in Dictyostelium, smlAmutant cells oversecrete a factor to form very small fruiting bodies (Brock and Gomer, 1999). In Drosophila, mutants in the components of the insulin/insulin-like growth factor 1 (IGF1) signaling pathway have been reported to be smaller (Leevers et al., 1996; Böhni et al., 1999). Many factors known to control body size or growth in various animals are involved in insulin/insulin-like growth factor signaling as described above, or TGFβsignaling (Patterson and Padgett, 2000; Massague, 2000), suggesting that they are major and conserved signal pathways controlling body size. However, the mechanisms of body size determination are largely unknown (Conlon and Raff, 1999).
C. elegansis an excellent model animal for studies on body size control. The number of somatic nuclei is fixed at 959 in an adult hermaphorodite, and their entire cell lineages were elucidated (Sulston and Horvitz, 1977). There are many mutants with an abnormal body size or shape. For example, several mutants in TGFβ signaling factors such as DBL-1/CET-1 (ligand), DAF-4 and SMA-6 (receptor), SMA-2, SMA-3 and SMA-4 (Smad transcriptional factors) are small (Estevez et al., 1993; Savage et al., 1996; Krishna et al., 1999;
Suzuki et al., 1999; Morita et al., 1999). We and others have shown that egl-4mutants have a larger body size (Daniels et al., 2000; Fujiwara et al., 2002; Hirose et al., 2003), and that the egl-4gene encodes cyclic GMP-dependent protein kinases (L’Etoile et al., 2002; Fujiwara et al., 2002; Hirose et al., 2003). We have developed methods to measure body volume, and to analyze morphology and volume of major organs using a confocal microscope: cell size in the major organs is increased in the egl-4 mutants, while cell numbers are not. Genetic interaction studies strongly suggest that the DBL-1/TGFβ pathway functions downstream of EGL-4 for body size control as the body size of a double mutant carrying egl-4and sma-6 or dbl-1mutations is close to that of the single small mutant (Hirose et al., 2003). In contrast to the egl-4 mutants, three small mutants in the DBL-1 pathway have much smaller cell size and indistinguishable cell numbers in major organs (Nagamatsu and Ohshima, 2004). We have also shown that cGMP downregulates body size through EGL-4 (Nakano et al., 2004).
Here, we present studies on the sma-5gene. Its mutant is very small, and has additional phenotypes that are not seen in the mutants of the DBL-1/TGFβ signaling factors. Our findings, based on the identification of the sma-5 gene encoding a MAP kinase homolog, provide novel and interesting insights into the mechanisms that control body size. We have analyzed the sma-5(n678)mutant in C. elegans to
elucidate mechanisms controlling body size. The sma-5
mutant is very small, grows slowly and its intestinal granules look abnormal. We found a 15 kb deletion in the mutant that includes a 226 bp deletion of the 3′end of the W06B3.2-coding sequence. Based on this result, rescue experiments, RNAi experiments and a newly isolated deletion mutant of W06B3.2, we conclude that W06B3.2 is the sma-5 gene. The sma-5 mutant has much smaller intestine, body wall muscles and hypodermis than those of the wild type. However, the number of intestinal cells or body wall muscle cells is not changed, indicating that the
sma-5 mutant has much smaller cells. In relation to the smaller cell size, the amount of total protein is drastically
decreased; however, the DNA content of the intestinal nuclei is unchanged in the sma-5 mutant. The sma-5gene is expressed in intestine, excretory cell and hypodermis, and encodes homologs of a mammalian MAP kinase BMK1/ERK5/MAPK7, which was reported to control cell cycle and cell proliferation. Expression of the sma-5gene in hypodermis is important for body size control, and it can function both organ-autonomously and non-autonomously. We propose that the sma-5gene functions in a MAP kinase pathway to regulate body size mainly through control of cell growth.
Key words: Body size, MAP kinase, C. elegans, SMA-5
Summary
Control of body size by SMA-5, a homolog of MAP kinase
BMK1/ERK5, in C. elegans
Naoharu Watanabe1, Yasuko Nagamatsu1, Keiko Gengyo-Ando2, Shohei Mitani2and Yasumi Ohshima1,*,† 1Department of Biology, Faculty of Sciences, Kyushu University Graduate School, Hakozaki, Fukuoka 812-8581, Japan 2Department of Physiology, Tokyo Women’s Medical University School of Medicine, Kawada-cho, Shinjuku-ku, Tokyo 162-8666,
Japan
*Present address: Department of Applied Life Science, Faculty of Biotechnology and Life Science, Sojo University, 4-22-1, Ikeda, Kumamoto-city 860-0082, Japan †Author for correspondence (e-mail: ohshima@life.sojo-u.ac.jp)
Accepted 9 May 2005
Development 132, 3175-3184
Published by The Company of Biologists 2005 doi:10.1242/dev.01895
Research article
De
Materials and methods
Strains and culture of C. elegansBristol strain N2 was used as the standard wild-type strain. FK312 sma-5(n678) was made by backcrossing three times MT3353 egl-15(n489) sma-5(n678)obtained from CGC with N2 and selecting a non-Egl line. tm448 was isolated using UV-TMP mutagenesis (Gengyo-Ando and Mitani, 2000). The handling of C. elegansstrains was performed as described previously (Brenner, 1974; Sulston and Hodgkin, 1988).
Measurement of body sizes
Total body volume, body length and diameters of a worm were measured as described (Hirose et al., 2003), but only body volume is shown here.
Transgenic animals
Microinjection of DNA was carried out as described (Mello et al., 1991). Total concentration of the DNA at injection was adjusted to 100 µg/ml. A pPDW06-1a, pPDW06-9 or pPDW06-c GFP reporter construct was injected alone at 100 µg/ml into sma-5 mutant animals, and at 50 µg/ml with 50 µg/ml of Bluescript SK+ into N2. Plasmid DNAs or PCR fragments for organ size analysis or rescue were injected at 50 µg/ml together with 50 µg/ml of kin-8::gfp (Koga et al., 1999) as a marker, at 50 µg/ml of dss-1p::gfpor 20
µg/ml of col-19p::gfp (Hirose et al., 2003) with 30 µg/ml of Bluescript SK+.
PCR fragments and plasmid construction
W06B3.2 PCR fragments of 6.7 kb used for rescue were amplified with pfu-turbo polymerase kit (Stratagene) with the primers sense (AACGTGTACGGAACCGGAAA) and W06B3.2-3′UTR4 (TCTGAGTTCACTACGTCTGC) from the wild-type genome. The PCR fragments contain the entire coding region of W06B3.2, a promoter region of 1.6 kb for W06B3.2c and a 3′ untranslated region of 1.8 kb. They were purified by QIAquick PCR Purification Kit (Qiagen).
We prepared three types of gene fusions of GFP and W06B3.2. pPDW06-1a, which is practically a promoter fusion, was prepared by amplifying 1.6 kb sequence upstream of the predicted initiation codon and 14 bp of coding sequence of W06B3.2c. For pPDW06-9, 1.6 kb upstream sequence and the entire coding region of W06B3.2a/c were amplified as above. A PstI site and a SalI site engineered into PCR primers were used to insert the amplified products into the GFP vector pPD95.77 (A. Fire). pPDW06-c was prepared by amplifying 4.9 kb sequence upstream of the 5′ UTR region of W06B3.2a (exon-1). A PstI site engineered into PCR primers were used to insert the amplified products into the GFP vector pPD95.75.
The promoters used in tissue-specific expression of sma-5cDNA included dss-1p (for intestine) (Hirose et al., 2003), vha-1p (for excretory cell) (Oka et al., 1997), vha-7p (for hypodermis) (Oka et al., 2001) and 1.6 kb sma-5 promoter for W06B3.2c as a control. The entire coding region except for termination codon of a sma-5cDNA corresponding to W06B3.2c was amplified by PCR with yk506c3 clone (Y. Kohara) as the template. The cDNA and each of the
promoters were inserted into vector pPD49.26 (A. Fire) with one of the following primer sets: dss-1p-f, 5′ -TTCTGCAGGCTCCGA-GGACGAGGAGAAA-3′; dss-1p-b, 5′ -TTCTGCAGTTCGACTGG-AAATAGGCTGA-3′; vha-1p-f, 5′ -TTCTGCAGCGAAGAGGATC-CGTTT-3′; vha-1p-b, 5′ -TTCTGCAGACCTGAAACATCTGAGTG-3′; vha-7p-f, 5′ -AAAACTGCAGCGACAGGAAATTGTGAGAAG-3′; vha-7p-b, 5′ -AAAACTGCAGCAGATTACGTCGTTGGTGGA-3′; sma-5p-f, 5′-AAAACTGCAGCCAAGTTGGCGGAAAGAGC-3′; sma-5p-b, 5′-AAAACTGCAGTGATGTGATGGGATCCTTTG-3′.
For amplification by PCR, an ExTaq kit (Takara) was used. A PstI site and a SalI site engineered into PCR primers were used to insert the amplified products into the GFP vector pPD95.77.
Alignment of SMA-5
A homology search was carried out at http://blast.genome.ad.jp/, and alignment was done on the web site http://npsa-pbil.ibcp.fr/cgi-bin/npsa_automat.pl?page=npsa_clustalw.html.
Measurement of organ sizes
Volumes of hypodermis, intestine or muscles of worms shown in Table 1 were obtained by YN with analysis of transgenic worms expressing GFP specifically in each organ with Zeiss LSM-410 confocal microscope, as described (Hirose et al., 2003). To express GFP in hypodermis, intestine and muscles, col-19p::gfp, dss-1p::gfp and myo-3p::gfp, respectively, were introduced to sma-5(n678) mutant in this study, as carried out for N2 and egl-4 mutants previously (Hirose et al., 2003). Intestinal or hypodermal volume measurement shown in Fig. 7 was carried out essentially as described previously (Hirose et al., 2003), but using Zeiss LSM-510 (NLO) laser-scanning fluorescent microscope equipped with Zeiss Axiovert 200M microscope using 488 nm Ar laser with 50-60% output and 10-50% transmission depending on fluorescent intensity of the sample. PlanApochromat 20/0.75 objective lens was used. Detector gain values used for the measurement were adjusted by adding 100-140 to, and depending on, the values indicated by Find menu so as to get consistent volumes obtained by LSM-410 or body volumes obtained as described before. Amplitude offset parameter was chosen so as to remove the black image background completely using Range indicator. Images of 512512 pixels were obtained at 1 µm intervals. Other procedures were as described previously. Transgenic lines used for measurement were obtained as described by Nakano et al. (Nakano et al., 2004).
Measurement of nuclear or cell numbers and analysis of DNA contents
[image:2.612.40.566.652.742.2]The procedures for measurement of intestinal or hypodermal nuclei and body wall muscle cells were described previously (Nagamatsu and Ohshima, 2004), except that the power of two photon Mai-Tai laser was increased manually from 20 to 80% during the analysis for determination of nuclear DNA contents. Seam cell numbers were counted under a DIC microscope. Intestinal cell numbers were measured in transgenic lines expressing flr-1::gfp/nls(pMTG24-5) (Take-uchi et al., 1998).
Table 1. Volumes of hypodermis, intestine and muscles of 4-day-old adults
Volume (nl) Relative value Number of Strain Genotype (mean±s.d.) of the mean (%) worms examined Intestine FK290 Ex[dss-1p::gfp] 0.89±0.24 100 21
FK340 sma-5; Ex[dss-1p::gfp] 0.20±0.08 23 17 Hypodermis FK336 Ex[col-19p::gfp] 1.15±0.32 100 20 FK383 sma-5; Ex[col-19p::gfp] 0.53±0.20 46 10
Muscles FK254 Ex[myo-3p::gfp] 0.73±0.16 100 11
FK239 sma-5; Ex[myo-3p::gfp] 0.31±0.11 43 28
De
Analysis of protein contents Total protein contents of 2-day-old animals of the wild type and the sma-5 mutant were measured as described (Nagamatsu and Ohshima, 2004).
Results
Phenotypes of sma-5(n678) mutant
Thesma-5(n678) mutant has three visible phenotypes: small body size (Fig. 1B), very slow growth (Fig. 2), and irregular distribution and less dark color or density of intestinal granules (Fig. 1E). These phenotypes other than the small size are clearly different from those of the small mutants of the DBL-1/TGFβ pathway such as sma-2, sma-3, sma-4and sma-6(Savage et al., 1996; Krishna et al., 1999). The body volume of the sma-5mutant is 1-1.5 nl or one-fifth to one-third of that of the wild type (about 4.5 nl) in 2- to 4-day old adults. It takes 5 or more days to become an adult (Fig. 2). Although larval development of the sma-5mutant is significantly slower than that of the wild type, larval lethality is not significant, based on a survival curve (data not shown). The lifespan of the mutant is shorter than that of the wild type [10.5±2.5 (s.d.) days versus 14.3±4.7 days]. The number of eggs laid by a hermaphrodite is significantly smaller in the sma-5 mutant than that of the wild type [139±28 (s.d.) versus 255±9.8].
Identification of the sma-5 gene
sma-5(n678)had been mapped to a
[image:3.612.208.561.72.497.2]region of 0.6 map unit on chromosome X, right of mes-1and left of or near nuc-1 (http://www.wormbase.org/ and Fig. 3A). Based on this information, we injected YAC and cosmid DNA clones, and found that YAC Y75H1 and cosmid R03B7 (Fig. 3A) could rescue its abnormal phenotypes of the sma-5 mutant (Fig. 1C; data not shown). R03B7 contains four genes (Fig. 3). Among them, only W06B3.2 (PCR fragments of 6.7 kb) rescued the abnormal phenotypes of sma-5 (Fig. 2).
Time after egg-laying (hour)
Vol
u
me (nl)
0 1 2 3 4 5 6
24 48 72 96 120 144 168 192
Young adult
Young adult Young adult
L4 - Young adult sma-5(n678)
i24-1 N2
sma-5(tm448)
i52-1
[image:3.612.292.561.558.735.2]Fig. 2. Growth curves of N2, sma-5(n678), sma-5 (tm448), i24-1 (sma-5 (n678);Ex[W06B3.2 genomic gene, kin-8::gfp]) and i52-1 (sma-5(tm448); Ex[sma-5 genomic gene, kin-8::gfp]. Error bars indicate standard deviations. Number of worms examined for each time point was 8-39.
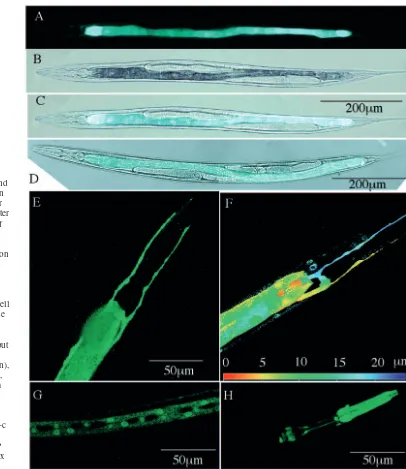
Fig. 1.DIC microphotographs of an L4 stage animal of N2 (A), sma-5(n678) (B) and sma-5; Ex[Y75H1, kin-8::gfp] (C). (D-F) Higher magnification views of a part of the worm shown in A-C, respectively. These pictures were taken using an AxioCam CCD camera mounted on Zeiss Axiophot 2.
De
Body volumes of the rescued lines are much larger than that of sma-5, but not as large as that of the wild type. Their growth rate and distribution of intestinal granules are similar to those of the wild type (Fig. 2; Fig. 1F). We found a deletion of about 15 kb in the genome of sma-5(n678) (Fig. 3B). The deleted region contains the four genes C49F5.3, C49F5.5, C49F5.6 and C49F5.7 (http://www.wormbase.org/), and 226 bp from the 3′ end of W06B3.2-coding sequence. We prepared PCR fragments of C49F5.3, C49F5.5, C49F5.6 and C49F5.7, and injected each into the sma-5 mutant. Those PCR fragments could not rescue the sma-5 mutant phenotypes (data not shown).
In order to confirm that W06B3.2 is the sma-5 gene, we performed RNAi experiments (Fire et al., 1998). We injected dsRNA corresponding to nucleotides from 148 to 901 of W06B3.2c into wild-type animals, and observed phenotypes of F1 animals. They exhibited Sma-5 phenotypes: small body size (Fig. 3C), slow growth and abnormal intestinal granules. In addition, we recently isolated a second allele of sma-5, tm448, that has 748 bp deletion in W06B3.2 (Fig. 3B). The tm448 mutant shows phenotypes similar to those of sma-5(n678): it is small, grows very slowly (Fig. 2) and its intestinal granules are abnormal. As in the case of sma-5(n678), PCR fragments partially rescued its abnormal phenotypes (Fig. 2; data not
B0198 W03G11
C15A7 W06B3
C49F5
R03B7 C24C12
W06B3.2 W06B3.1 VW06B3R.1 B0198.2
B0198.2 W06B3.2
Y75H1
mes-1 (nuc-1)
7.0 6.5
gaP7
LGX
A
B
C
Body vol
u
me (nl)
0 1 2 3 4 5 6 7
Control Control2 RNAi-1 RNAi-2 RNAi-3 sma-5
(n678) 500bp
W06B3.2(3324bp)
5' 3'
Deletion in sma-5(n678)mutant
W06B3.2c
W06B3.2d
1497nt ORF (498aa) 2036 bp cDNA
1350nt ORF (449aa) 1852 bp cDNA
3a 4 5 6 7 8 9
3b 4 5 6 7 8 9
10
Deleted region in tm448
2 3a 4 5 6 7 8 9 1497nt ORF (498aa)1654 bp cDNA
1 W06B3.2a
2
10
[image:4.612.184.560.221.748.2]10
Fig. 3.Cloning of the sma-5 gene, mRNA structure and RNAi experiments. (A) Physical map of the region around sma-5 gene. The YAC DNA clone, cosmid DNA clones and PCR fragments used for identification of the sma-5gene are shown. Thick lines represent regions carrying functional sma-5gene. (B) Location of deletions in W06B3.2 and structure of mRNAs. White and grey rectangles indicate coding and non-coding exons, respectively. (C) RNAi experiments. Average volumes of progeny born after injection of dsRNA of W06B3.2 into N2 (RNAi-1, 2, 3), control progeny born from a parent injected with water or sma-5(n678)mutant worms are shown together with standard deviations. Two-day-old adult animals were used for measurement.
De
shown). Based on these results, we conclude that W06B3.2 is the sma-5gene.
The sma-5 gene encodes MAP kinase homologues
A recent version of WormBase describes W06B3.2a (Fig. 3B) and W06B3.2b. We sequenced cDNAs obtained by RT-PCR and cDNA clones yk506c3 and yk1526e1.3 obtained from Y. Kohara, to identify two alternative forms of the mRNA (a and b) that differ at the 5′ends. The open reading frame (ORF) or coding sequence of W06B3.2a exactly matches that of our ‘a’ mRNA (498 amino acids), but W06B3.2a has an extra non-coding exon 3.6 kb upstream of the initiation codon (exon 1 in Fig. 3B). W06B3.2b carrying an ORF lacking exon 9 does not match our mRNA a or b. The structures of our a and b mRNA are shown in Fig. 3B as W06B3.2c and W06B3.2d. All these mRNAs encode homologs of a mammalian MAP kinase BMK1/ERK5/MAPK7 (Fig. 4 for W06B3.2a or W06B3.2c) (Lee et al., 1995; Zhou et al., 1995). C. elegans W06B3.2a has 38% amino acid identity and 60% similarity with human MAPK7/ERK5.
Expression patterns of the sma-5 gene
To examine the expression pattern of the sma-5 gene, we prepared three GFP reporter constructs. pPDW06-1a expresses a GFP fusion with N-terminal five amino acids of W06B3.2a/c under a control of promoter for W06B3.2c of 1.6 kb. GFP expression was found in intestine (Fig. 5A,C,E,F) and excretory cell (Fig. 5E,F), in all stages of a transgenic line carrying extrachromosomal arrays of
pPDW06-1a. In the intestine, the four most anterior cells show stronger GFP expression, although entire intestine is fluorescent. The expression in the excretory cell (White, 1988) was confirmed by comparison with the expression pattern of vha-1p::gfpthat is predominantly expressed in the excretory cell (Oka et al., 1997). GFP in the excretory cell is seen continuously along the lateral lines for most of the length of the worm (data not shown). Weak expression in hypodermis is also seen (Fig. 5F). A second GFP fusion construct pPDW06-9, which contains the same promoter for W06B3.2c and the entire genomic region of W06B3.2a/c except for the termination codon, rescued the phenotypes of the sma-5 mutant, and looks to be expressed in the same regions as was pPDW06-1a (Fig. 5D for intestinal expression). This fusion protein is localized throughout the intestine. The third construct pPDW06-c carries the 4.9 kb sequence upstream of exon 1 and a GFP gene. GFP in this promoter fusion is expressed in hypodermis and pharynx (Fig. 5G,H).
Sizes of major organs and their cells of the sma-5 (n678) mutant
Because the sma-5mutant has a markedly reduced body size in adults, the number or the size of cells in major organs is probably decreased. We analyzed morphology of three major organs in the adults. To do this, a whole transgeneic animal expressing GFP specifically in intestine, hypodermis or muscles was examined using a confocal laser-scanning microscope. Based on a series of sectional fluorescent images, a 3D image was reconstructed and its volume was calculated with an image-processing system, as described in the Materials and methods. Fig. 6 shows examples of 3D images of these organs in the sma-5(n678) mutant. The morphology of hypodermis, intestine and muscles in 2-day-old adults of the sma-5mutant looked normal when compared with those of the wild type that were described earlier (Hirose et al., 2003).
[image:5.612.231.562.59.464.2]Results of volume measurement are presented in Table 1. The numbers of cells or nuclei in these organs were also measured (Table 2). The volume of whole intestine decreased 10 20 30 40 50 60 70 80 MSPPQENRSPKAEYLNNFFNTNPTNGKSRGSQEAPRKPLGQTNLNVQGSMPAKKEGFNRVLDGLKKRQLQHDFKLERAAE |: | :: | . . || |.| : : | : : | || |.:: |.: : MAEPLKE---ED---G--EDGSAEPPAR---EGRTRPHRCLCSAKNLALLKARSFDVTFDVG---D
90 100 110 120 130 140 150 160 TYEPTQNIGSGAFGIVCEAVETSSNQKVAIKKVAHASATPTLARRTLREIRVLRYINHPNIVPLRDIFRTKGPLG--IDV || :.||.||:|:|..| . :.|:|||||:.:| . | |:|||||:::|::::| ||:.::||:|.. | | .| EYEIIETIGNGAYGVVSSARRRLTGQQVAIKKIPNAFDVVTNAKRTLRELKILKHFKHDNIIAIKDILRPTVPYGEFKSV
170 180 190 200 210 220 230 240 FLVMDLMQNNLHHIIYGNEDPLEEHYINAFLGQLLRGLEYLHAACIAHRDLKPSNLLVNQDGTLRIADFGMAKCADNSSK ::|:|||:.:||:||:..: || .::. || ||||||:|:|:| : ||||||||||||:: |:|.|||||: .|.
250 260 270 280 290 300 310 320 KHDDEEHCYYMTQHVATLPYRAPELLFVLPEHSTAVDMWAVGCIFGEMVIRNEILPGRSVQGQIKMLLTMLGQPPQEVIN || |:||::||| ||||||:: | |:: |:|:|:||||||||: |.:::||:. |::::: :|| |. ||: ----AEHQYFMTEYVATRWYRAPELMLSLHEYTQAIDLWSVGCIFGEMLARRQLFPGKNYVHQLQLIMMVLGTPSPAVIQ
330 340 350 360 370 380 390 400 | .:|.| ||.: : . |: : |
AVGAERVRAYIQSLPPRQPVPWETVYPGADRQALSLLGRMLRFEPSARISAAAALRHPFLAKYHDPDDEPDCAPPFDFAF
410 420 430 440 450 460 470 480 DDQIVRGNCDTIDFVKQLFQYDAQKRINIQDALLHPYIQRVIP---| : : : . :DDQIVRGNCDTIDFVKQLFQYDAQKRINIQDALLHPYIQRVIP---| :: ::.DDQIVRGNCDTIDFVKQLFQYDAQKRINIQDALLHPYIQRVIP---|::. DDQIVRGNCDTIDFVKQLFQYDAQKRINIQDALLHPYIQRVIP---|: ::DDQIVRGNCDTIDFVKQLFQYDAQKRINIQDALLHPYIQRVIP---| :DDQIVRGNCDTIDFVKQLFQYDAQKRINIQDALLHPYIQRVIP---| DDQIVRGNCDTIDFVKQLFQYDAQKRINIQDALLHPYIQRVIP---| .
DREALTRERIKEAIVAEIEDFHARREGIRQQIRFQPSLQPVASEPGCPDVEMPSPWAPSGDCAMESPPPAPPPCPGPAPD
490 500 510 520 530 540 550 560 ---AEAPQKKCPFRVKKDMMQVEDLNHQELIS |||: : |. .:: : |: .::. TIDLTLQPPPPVSEPAPPKKDGAISDNTKAALKAALLKSLRSRLRDGPSAPLEAPEPRKPVTAQERQREREEKRRRRQER
570 580 590 600 610 620 630 640 ::: | |. . ||| . :||:. |:..|.:::. : ::| | : :: AKEREKRRQERERKERGAGASGGPSTDPLAGLVLSDNDRSLLERWTRMARPAAPALTSVPAPAPAPTPTPTPVQPTSPPP
650 660 670 680 690 700 710 720 ---GPLAQPTGPQPQSAGSTSGPVPQPACPPPGPAPHPTGPPGPIPVPAPPQIATSTSLLAAQSLVPPPGLPGSSTPGVLPYF
730 740 750 760 770 780 790 800 ---PPGLPPPDAGGAPQSSMSESPDVNLVTQQLSKSQVEDPLPPVFSGTPKGSGAGYGVGFDLEEFLNQSFDMGVADGPQDGQ
810 820 830 840
---ADSASLSASLLADWLEGHGMNPADIESLQREIQMDSPMLLADLPDLQDP
Fig. 4.Alignment of amino acid sequences of W06B3.2a/c (upper line) and human MAPK7/ERK5 (lower line). A vertical line indicates identical amino acid, a colon indicates strong similarity and a dot indicates weak similarity between amino acids. A broken line indicates absence of corresponding amino acids.
De
Table 2. Numbers of cells and nuclei in 2-day-old adults
Number Relative value Number of Genotype (mean±s.d.) of the mean (%) worms examined Intestinal cells (L1 stage) Wild type (N2) 18±0.8 100 7
sma-5(n678) 18±0.6 100 10 Intestinal nuclei Wild type (N2) 32±1.5 100 15
sma-5(n678) 27±2.4* 84 11
sma-5; Ex[pPDW06-9]† 31±1.4 97 14
Hypodermal seam cells/side Wild type (N2) 16.5±1.3 100 12
sma-5(n678) 16.2±0.8 98 5 Hypodermal nuclei/side Wild type (N2) 89±10 100 6
sma-5(n678) 69±4* 76 8
Body wall muscle cells in two Wild type (N2) 47±0.69 100 20
quadrants sma-5(n678) 46±1.1 98 20
*Significantly different from the wild-type value (P<0.01, t-test).
[image:6.612.66.562.569.718.2]†pPDW06-9 plasmid contains full length of the sma-5 genomic gene fused with GFP gene.
Fig. 5.Expression patterns of sma-5::gfpreporter genes. (A-C) A dorsal fluorescent image (A), a DIC image (B) and the merge of A and B (C) of an entire L4 animal transgenic for pPDW06-1a carrying a promoter for W06B3.2c. (D) A merge of dorsal fluorescent and DIC images of a young adult expressing a SMA-5/GFP fusion protein in intestine from pPDW06-9. (E) A confocal microscopic, dorsal/ventral image of a part of the body showing H-shaped excretory cell and the anterior end of intestine in an L4 worm expressing pPDW06-1a. (F) A similar confocal microscopic image, but color-coded depending on the depth, showing intestine (green), excretory cell (blue or yellow), and nuclei and faint cytoplasm of hypodermis (blue). (G,H) Lateral confocal microscopic images of an L2 worm transgenic for pPDW06-c carrying a promoter for W06B3.2a that expresses GFP in hypodermis (G) and pharynx (H).
De
to 23% of the wild-type value in the sma-5mutant. Although the average number of intestinal nuclei slightly decreased in the mutant, the number of intestinal cells was the same as that of the wild type (Table 2). Therefore, intestinal cells in the sma-5mutant must be much smaller than those in the wild type. The number of intestinal nuclei was recovered to nearly the same as that of the wild type by introduction of the sma-5gene (Table 2). The volume of hypodermis decreased to 46% in the mutant. Most of the hypodermis is occupied by a single, giant syncytium hyp7 that covers the nearly entire body and contains 133 nuclei out of the 188 hypodermal nuclei in total (White, 1988). In the sma-5mutant, therefore, the volume of this hyp7 syncytium should be decreased approximately to half. Although the number of hypodermal seam cells in the sma-5 mutant is very close to that in the wild type, the number of total hypodermal nuclei in the mutant is decreased to 76% of that of the wild type (Table 2). Volume of the muscles expressing myo-3p::gfp (body wall muscles, vulval, uterine and intestine-associated muscles) (Okkema et al., 1993) was decreased to 43% of that of the wild type (Table 1). A great majority of those muscle cells consist of body wall muscle cells, and their number was not changed in the mutant (Table 2). These results suggest that the sma-5mutant has the same number of cells, and that the cell size is much smaller.
Effect of sma-5 gene expression in the sma-5 (n678) mutant on body and organ sizes
To elucidate where the sma-5gene expression is required for body size control, we examined the effect of expression of extrachromosomal sma-5 cDNA under a tissue-specific promoter or a sma-5promoter, as well as that of the genomic sma-5 gene (Fig. 7). The results are presented as bars and percentages showing body volume, intestinal or hypodermal volumes relative to those in the wild-type background. As to the total body size, expression of the 6.7 kb genomic gene carrying promoters for W06B3.2c and W06B3.2d, or sma-5 cDNA under the sma-5promoter for W06B3.2c, led to increase of more than twice of the volume of the sma-5mutant. Among the specific promoters examined, vha-7 promoter specific to hypodermis is most effective for recovery of the body volume, and vha-1 promoter, which predominantly directs expression in excretory cell, has a small but significant effect, and dss-1 promoter specific to intestine is not effective. For organ sizes, cDNA expression in hypodermis leads to increase in the volume of hypodermis and intestine. The expression in excretory cell increases intestinal volume.
Analysis of DNA content and total protein content
To elucidate the mechanisms of cell size decrease in the sma-5mutant, we have analyzed chromosomal ploidies and total protein content in the wild type and the mutant. Chromosomal ploidy is a well known, universal control factor for cell size (Conlon and Raff, 1999). For analysis of chromosomal ploidy, we examined intestinal and neuronal nuclei of worms stained with 4′,6-diamidino-2-phenylindole (DAPl) as described in the Materials and methods. Intestinal nuclei in the wild-type C. elegans become 32C by the adult stage, which is the highest ploidy in the wild type, while neuronal nuclei remain diploid (Hedgecock and White, 1985). In addition, intestinal cells show the greatest volume reduction in the sma-5mutant. Thus, chromosomal ploidy in intestine of the sma-5 mutant could possibly be less in the sma-5mutant than those in the wild type. Average intestinal chromosomal ploidy of the sma-5 mutant adult was estimated to be 34, assuming that neuronal nuclei are diploid (as in the wild type) and the value in the wild type was 35. Because these values are very close, we conclude that intestinal chromosomal ploidy is not changed in the sma-5 mutant.
We were also interested to know whether the level of general gene expression is altered in this mutant. Total protein content of a worm should be a good measure of the level of general gene expression. Indeed, the protein content of the sma-5 mutant was only 18% of that of the wild type (0.16 compared with 0.88 µg/worm).
Discussion
Identification of the sma-5 gene
[image:7.612.44.294.365.702.2]The sma-5(n678)mutant is small and has smaller but almost the same number of cells. We found that the sma-5gene is W06B3.2, which encodes homologs of mammalian MAP kinase MAPK7/BMK1/ERK5. W06B3.2a and W06B3.2c encode the same protein of 498 amino acids (Fig. 3B). They share expression in hypodermis, but are also expressed in different regions (the former in pharynx, and the latter in
Fig. 6.Three-dimensional reconstructed images of hypodermis (A), intestine (B) and muscles (C) in the sma-5(n678) background. Scale bar: 200 µm.
De
intestine and excretory cell). The endogenous sma-5 gene is probably expressed in all of these sites. As cDNA corresponding to W06B3.2c is functional in our assay and W06B3.2a has the same ORF, W06B3.2a should also be functional. We have not examined whether W06B3.2d lacking exon 2 and W06B3.2b lacking exon 9 have functions.
Extrachromosomal arrays of Y75H1, R03B7 or W06B3.2 PCR fragments rescued the abnormal phenotypes of the sma-5mutant to the same extent. The rescue of the body size by any of these was not complete, although growth rate and irregular distribution of intestinal granules were almost completely rescued. We prepared a transgenic line it22-1: sma-5; In[W06B3.2 PCR fragment, kin-8::gfp] by UV radiation (Mitani, 1995) in which the extrachromosomal arrays of the PCR fragments were integrated. But that integrated line is as large as the extrachromosomal transgenic lines. A plausible reason for the incomplete rescue of the sma-5body size by W06B3.2 may be that the pattern, strength or timing of the exogenous gene expression is somewhat different from those of the endogenous sma-5gene.
sma-5functions in post-embryonic development
We measured the volume of eggs
(embryos) laid by wild-type and the sma-5(n678) mutant. There was little difference between them (both were ~0.03 nl). In addition, there was little difference in morphology and volume of L1 larvae about 2 hours after hatch between them. sma-5::gfpwas expressed in some embryos, but it is not clear whether sma-5 expression is necessary for embryonic development. sma-5::gfpexpression is seen in all larval stages, which suggests that it is required for normal larval development from L1 stage.
The sma-5 gene regulates body size mainly through control of cell growth
BMK1/ERK5/MAPK7 is the newest subfamily of the MAP kinase family in mammals, and it has some characteristic features: a large C-terminus and a unique loop 12 sequence (Lee et al., 1995). Mammalian BMK1/ERK5 was shown to be activated by oxidative stress, hyperosmolarity and several growth factors, including epidermal growth factor and nerve growth factor (Abe et al., 1996; Chao et al., 1999; Lee et al., 1995; Zhou et al., 1995; Kato et al., 1998; Kamakura et al., 1999). It has also been reported that BMK1/ERK5 regulates cell proliferation and cell cycle in cultured cells (Kato et al., 1998; Chao et al., 1999). Recent reports have demonstrated that the homozygous deletion of BMK1/ERK5 results in embryonic
lethality in mice with extra-embryonic vascular and embryonic cardiovascular defects (Regan et al., 2002; Sohn et al., 2002). As the sma-5 mutant has significantly smaller but indistinguishable numbers of cells, we propose that SMA-5 regulates body size mainly through control of cell growth. Measurement of embryonic size described in the Results and growth curves shown in Fig. 2 for larvae and adults suggest that embryonic cell sizes in the sma-5 mutant are similar to those of the wild type. They also suggest that cell growth in the mutant is much slower in larval development so that cell proliferation is slower and that final cell sizes are smaller. The results of measurement of hypodermal and intestinal nuclear numbers suggest that SMA-5 also has a limited function in nuclear proliferation in these organs. As postembryonic hypodermal nuclei in the large hyp7 syncytium are born by fusion with postembryonic hypodermal cells, SMA-5 has also a function in cell proliferation. Thus, the function of SMA-5 in C. elegans seems to be somewhat different from that of BMK1/ERK5 in mammalian cells, but has a common function in cell proliferation. It is not clear whether BMK1/ERK5 controls body size in mammals because the knockout mice are lethal (Regan et al., 2002; Sohn et al., 2002). By contrast, the tm448 mutant carrying a large deletion in the sma-5 gene should be a null mutant, but it is viable and has quite similar 7 -a h v 1 -a h v 1 -s s d 5 -a m s 5 -a m s ) e n e g c i m o n e g ( r e t o m o r
P Expressionsite
e n i t s e t n I l l e c y r o t e r c x E s i m r e d o p y H e n i t s e t n I l l e c y r o t e r c x E s i m r e d o p y H e n i t s e t n I l l e c y r o t e r c x E s i m r e d o p y H
Relative volume (%)
[image:8.612.214.560.75.308.2]0 0 1 0 8 0 6 0 4 0 2 0 y d o b e l o h W e n i t s e t n I s i m r e d o p y H * * * * * * * *
Fig. 7.Effect of expression of extrachromosomal sma-5genomic gene (second group of columns) or sma-5cDNA under the indicated promoter (lower groups of columns) in the sma-5 (n678)mutant on body and organ volume in 2-day-old adults. Body volumes relative to those of the wild-type body volume (white bar), and intestinal volumes (gray bar) or hypodermal volumes (black bar) relative to those of the dss-1::gfpor col-19p::gfptransgenic lines in the wild-type background are shown by bars. The top group of columns show the results of the sma-5 (n678) mutant. T-shaped bars represent s.e.m., which was calculated by the formula (fDx2/y2+x2fDy2/y4)1/2/n1/2where x and fDx are mean and s.d. of the volume of the indicated
strain, and y and fDy are those of the wild-type volume (Bevington and Robinson, 2003). The smaller of the numbers of worms examined for the indicated and the wild-type worms was taken as n. An asterisk indicates significant difference in t-tests (P0.05) from the value for the sma-5mutant. One-hundred percent (wild-type volume) corresponds to 4.39±0.41 nl,
0.88±0.068 nl and 1.01±0.20 nl for body, intestinal and hypodermal volumes, respectively. Hypodermal volume of a worm expressing sma-5cDNA under dss-1promoter was not obtained because a corresponding transgenic line was not obtained.
De
characteristics as the sma-5(n678) mutant. Thus, our results indicating the function of SMA-5 in body size control are novel and interesting.
Site and mode of action of the sma-5 gene
Based on the results presented in Fig. 7, the hypodermis seems to be the most important site of sma-5gene expression for the control of body and organ size. Although promoter for W06B3.2c drives only weakly visible expression in hypodermis, the far upstream promoter for W06B3.2a probably makes the expression stronger for the endogenous sma-5 gene. The importance of hypodermal expression for body size control was also reported previously for sma-6 (Yoshida et al., 2001), sma-3(Wang et al., 2002) and egl-4 (Nakano et al., 2004). Although expression of sma-5 in the excretory cell may be interesting, we do not have any evidence to see whether the same mechanism works there as in hypodermis. Because the expression in hypodermis increases hypodermal volume, and both expression in hypodermis and that in excretory cell increase intestinal volume, the sma-5gene can function both organ- or cell-autonomously and non-autonomously, as has been shown for the egl-4gene (Nakano et al., 2004). The reason why intestinal expression of the cDNA failed to increase intestinal volume is not clear.
Conserved features of body size control in C. elegans
We notice two conserved characteristics in the body size mutants in C. elegans so far analyzed. First, little or no changes in cell numbers from those in the wild type are seen in the sma-5mutant analyzed here – the three small mutants of the DBL-1/TGFβpathway and a sma-1mutant (Nagamatsu and Ohshima, 2004), as well as egl-4large mutants (Hirose et al., 2003). These results may be related to the small number of somatic cells and rather rigid cell lineages in C. elegans (Sulston and Horvitz, 1977), and may suggest that a mutation leading to a significant change in the overall cell number is hard to obtain or is lethal. Although extra cell divisions were observed in cul-1/lin-19or lin-23mutants, they are lethal or sterile (Kipreos et al., 1996; Kipreos et al., 2000). To examine these ideas, further efforts will be required to obtain body size mutants in which cell number is significantly altered. Second, protein contents are decreased in all the small mutants analyzed roughly in proportion to their reduced body size (this report) (Nagamatsu and Ohshima, 2004). We propose that the level of general protein expression has an important relation to the cell size in C. elegans. A close link between cell size and protein and ribosome synthesis has been suggested in yeast and other organisms (Jorgensen et al., 2002; Saucedo and Edgar, 2002).
Some nematode strains were obtained from the Caenorhabditis Genetic Center, which is funded by a grant from the National Institute of Health for Research Resources. We thank A. Fire for vectors; Y. Kohara for cDNA clones; T. Oka for vha-1p::gfp; K. Ishii and T. Tani for dss-1::gfp; T. Ishihara for general support; M. Fujiwara, M. Koga and other members of our laboratory for discussion; M. Fujiwara for critical reading of the manuscript; and M. Ohara for language assistance. This work was supported by The Japan Society for the Promotion of Science (Research for the Future 97L00401) and a grant from the Ministry of Education, Science, Technology, Sports and Culture of Japan to Y.O.
References
Abe, J., Kusuhara, M., Ulevitch, R. J., Berk, B. C. and Lee, J. D.(1996). Big mitogen-activated protein kinase 1 (BMK1) is a redox-sensitive kinase.
J. Biol. Chem. 271, 16586-16590.
Bevington, P. R. and Robinson, D. K.(2003). In Data Reduction and Error Analysis for Physical Sciences, 3rd edn, Chapter 3, p. 41. New York: McGraw-Hill.
Böhni, R., Riesgo-Escovar, J., Oldham, S., Brogiolo, W., Stocker, H., Andruss, B. F., Beckingham, K. and Hafen, E. (1999). Autonomous control of cell and organ size by CHICO, a Drosophila homolog of vertebrate IRS1-4, Cell 97, 865-875.
Brenner, S.(1974). The genetics of Caenorhabditis elegans. Genetics77, 71-94.
Brock, D. A. and Gomer, R. H.(1999). A cell-counting factor regulating structure size in Dictyostelium. Genes Dev. 13, 1960-1969.
Chao, T. H., Hayashi, M., Tapping, R. I., Kato, Y. and Lee, J. D.(1999). MEKK3 directly regulates MEK5 activity as part of the big mitogen-activated protein kinase 1 (BMK1) signaling pathway. J. Biol. Chem. 274, 36035-36038.
Conlon, I. and Raff, M.(1999). Size control in animal development. Cell96, 235-244.
Daniels, S. A., Ailion, M., Thomas, J. H. and Sengupta, P.(2000). egl-4acts through a transforming growth factor-β/SMAD pathway in Caenorhabditis elegansto regulate multiple neuronal circuits in response to sensory cues.
Genetics156, 123-141.
Estevez, M., Attisano, L., Wrana, J. L., Albert, P. S., Massague, J. and Riddle, D. L.(1993). The daf-4gene encodes a bone morphogenetic protein receptor controlling C. elegansdauer larva development. Nature365, 644-649.
Fire, A., Xu, S., Montgomery, M. K., Kostas, S. A., Driver, S. E. and Mello, C. C.(1998). Potent and specific genetic interference by double-stranded RNA in Caenorhabditis elegans. Nature391, 806-811.
Fujiwara, M., Sengupta, P. and McIntire, S. L.(2002). Regulation of body size and behavioral state of C. elegansby sensory perception and EGL-4 cGMP-dependent protein kinase. Neuron36, 1091-1102.
Gengyo-Ando, K. and Mitani, S. (2000). Characterization of mutations induced by ethyl methanesulfonate, UV, and trimethylpsoralen in the nematode Caenorhabditis elegans. Biochem. Biophys. Res. Commun. 269, 64-69.
Hedgecock, E. M. and White, J. G.(1985). Polyploid tissues in the nematode
Caenorhabditis elegans. Dev. Biol. 107, 128-133.
Hirose, T., Nakano, Y., Nagamatsu, Y., Misumi, T., Ohta, H. and Ohshima, Y.(2003). Cyclic GMP-dependent protein kinase EGL-4 controls body size and lifespan in C. elegans. Development130, 1089-1099.
Jorgensen, P., Nishikawa, J. L., Breitkreutz, B. J. and Tyers, M.(2002). Systematic identification of pathways that couple cell growth and division in yeast. Science294, 395-400.
Kamakura, S., Moriguchi, T. and Nishida, E. (1999). Activation of the protein kinase ERK5/BMK1 by receptor tyrosine kinases. J. Biol. Chem.
274, 26563-26571.
Kato, Y., Tapping, R. I., Huang, S., Watson, M. H., Ulevitch, R. J. and Lee, J. D. (1998). Bmk1/Erk5 is required for cell proliferation induced by epidermal growth factor. Nature395, 713-716.
Kipreos, E. T., Lander, L. E., Wing, J. P., He, W. W. and Hedgecock, E. M.(1996). cul-1is Required for cell cycle exit in C. elegans and identifies a novel gene family. Cell85, 829-839.
Kipreos, E. T., Gohel, S. P. and Hedgecock, E. M.(2000). The C. elegans
F-box/WD-repeat protein LIN-23 functions to limit cell division.
Development127, 5071-5082.
Koga, M., Take-uchi, M., Tameishi, T. and Ohshima, Y.(1999). Control of DAF-7 TGF-βexpression and neuronal process development by a receptor tyrosine kinase KIN-8 in Caenorhabditis elegans. Development126, 5387-5398.
Krishna, S., Maduzia, L. L. and Padgett, R. W. (1999). Specificity of TGFβ signaling is conferred by distinct type I receptors and their associated SMAD proteins in Caenorhabditis elegans. Development126, 251-260.
Lee, J. D., Ulevitch, R. J. and Han, J.(1995). Primary structure of BMK1: a new mammalian map kinase. Biochem. Biophys. Res. Commun. 213, 715-724.
Leevers, S. J., Weinkove, D., MacDougall, L. K., Hafen, E. and Waterfield, M. D.(1996). The Drosophilaphosphoinositide 3-kinase Dp110 promotes cell growth. EMBO J. 15, 6584-6594.
L’Etoile, N. D., Coburn, C. M., Eastham, J., Kistler, A., Gallegos, G. and
De
Bargmann, C. I.(2002). The cyclic GMP-dependent protein kinase EGL-4 directs olfactory adaptation in C. elegans. Neuron 36, 1079-1089.
Massague, J.(2000). How cells read TGF-βsignals. Nat. Rev. Mol. Cell. Biol.
1, 169-178.
Mello, C. C., Kramer, J. M., Stinchcomb, D. and Ambros, V.(1991). Efficient gene transfer in C. elegans: extrachromosomal maintenance and integration of transforming sequences. EMBO J. 10, 3959-3970.
Mitani, S.(1995). Genetic regulation of mec-3gene expression implicated in the specification of the mechanosensory neuron cell types in Caenorhabditis elegans. Dev. Growth Diff. 37, 551-557.
Morita, K., Chow, K. L. and Ueno, N.(1999). Regulation of body length and male tail ray pattern formation of Caenorhabditis elegansby a member of TGF-βfamily. Development126, 1337-1347.
Nagamatsu, Y. and Ohshima, Y.(2004). Mechanisms for the control of body size by a G-kinase and a downstream TGFβ signal pathway in
Caenorhabditis elegans. Genes Cells9, 39-47.
Nakano, Y., Nagamatsu, Y. and Ohshima, Y.(2004). cGMP and a germ-line signal control body size in C. elegansthrough cGMP-dependent protein kinase EGL-4. Genes Cells9, 773-779.
Oka, T., Yamamoto, R. and Futai, M.(1997). Three vha genes encode proteolipids of Caenorhabditis elegans vacuolar-type ATPase. J. Biol. Chem. 272, 24387-24392.
Oka, T., Toyomura, T., Honjo, K., Wada, Y. and Futai, M.(2001). Four subunit a isoforms of Caenorhabditis elegansvacuolar H+-ATPase. Cell-specific expression during development. J. Biol. Chem. 276, 33079-33085.
Okkema, P. G., Harrison, S. W., Plunger, V., Aryana, A. and Fire, A.
(1993). Sequence requirements for myosin gene expression and regulation in Caenorhabditis elegans. Genetics135, 385-404.
Palmiter, R. D., Brinster, R. L., Hammer, R. E., Trumbauer, M. E., Rosenfeld, M. G., Birnberg, N. C. and Evans, R. M.(1982). Dramatic growth of mice that develop from eggs microinjected with metallothionein-growth hormone fusion genes. Nature 300, 611-615.
Patterson, G. I. and Padgett, R. W.(2000). TGF β-related pathways. Roles in Caenorhabditis elegansdevelopment. Trends Genet. 16, 27-33.
Regan, C. P., Li, W., Boucher, D. M., Spatz, S., Su, M. S. and Kuida, K.
(2002). Erk5 null mice display multiple extraembryonic vascular and embryonic cardiovascular defects. Proc. Natl. Acad. Sci. USA99, 9248-9253.
Saucedo, L. J. and Edgar, B. A.(2002). Why size matters: altering cell size.
Curr. Opin. Genet. Dev. 12, 565-571.
Savage, C., Das, P., Finelli, A. L., Townsend, S. R., Sun, C. Y., Baird, S. E. and Padgett, R. W.(1996). Caenorhabditis elegansgenes sma-2, sma-3, and sma-4 define a conserved family of transforming growth factor β pathway components. Proc. Natl. Acad. Sci. USA93, 790-794.
Sohn, S. J., Sarvis, B. K., Cado, D. and Winoto, A.(2002). ERK5 MAPK regulates embryonic angiogenesis and acts as a hypoxia-sensitive repressor of vascular endothelial growth factor expression. J. Biol. Chem. 277, 43344-43351.
Sulston, J. E. and Horvitz, H. R.(1977). Post-embryonic cell lineages of the nematode, Caenorhabditis elegans. Dev. Biol. 56, 110-156.
Sulston, J. and Hodgkin, J. (1988). Methods. In The Nematode Caenorhabditis elegans(ed. W. B. Wood and the Community of C. elegans
Researchers), pp. 587-606. Cold Spring Harbor: Cold Spring Harbor Laboratory.
Suzuki, Y., Yandell, M. D., Roy, P. J., Krishna, S., Savage-Dunn, C., Ross, R. M., Padgett, R. W. and Wood, W. B.(1999). A BMP homolog acts as a dose-dependent regulator of body size and male tail patterning in
Caenorhabditis elegans. Development126, 241-250.
Take-uchi, M., Kawakami, M., Ishihara, T., Amano, T., Kondo, K. and Katsura, I.(1998). An ion channel of the degenerin/epithelial sodium channel superfamily controls defecation rhythm in Caenorhabditis elegans.
Proc. Natl. Acad. Sci. USA95, 11775-11780.
Wang, J., Tokarz, R. and Savage-Dunn, C.(2002). The expression of TGFβ signal transducers in the hypodermis regulates body size in C. elegans.
Development129, 4989-4998.
White, J.(1988). The anatomy. In The Nematode Caenorhabditis elegans(ed. W. B. Wood and the Community of C. elegansResearchers), pp. 81-122. Cold Spring Harbor: Cold Spring Harbor Laboratory.
Yoshida, S., Morita, K., Mochii, M. and Ueno, N. (2001). Hypodermal expression of Caenorhabditis elegans TGF-βtype I receptor SMA-6 is essential for the growth and maintenance of body length. Dev. Biol 240, 32-45.
Zhou, G., Bao, Z. Q. and Dixon, J. E.(1995). Components of a new human protein kinase signal transduction pathway. J. Biol. Chem. 270, 12665-12669.

![Fig. 2. Growth curves of N2, i24-1 (and i52-1 (8::gfp]sma-5(n678), sma-5 (tm448),sma-5 (n678);Ex[W06B3.2 genomic gene, kin-8::gfp])sma-5(tm448); Ex[sma-5 genomic gene, kin-](https://thumb-us.123doks.com/thumbv2/123dok_us/8920408.964108/3.612.208.561.72.497/fig-growth-curves-sma-genomic-gene-genomic-gene.webp)