MINING ROAD TRAFFIC ACCIDENT DATA TO IMPROVE
SAFETY IN DUBAI
1ABDELAZIZ ARAAR, 2AMIRA A. EL TAYEB
1Assoc. Prof., College of Information Technology, Ajman University, UAE 2
Lecturer, Department of Information Technology, Preston University, UAE
E-mail: [email protected] , [email protected]
ABSTRACT
Road traffic accidents are a major public health concern, resulting in an estimated 1.2 million deaths and 50 million injuries worldwide each year. Dubai in particular experiences a high rate of such accidents. Research on road safety has been conducted for several years, yet many issues still remain undisclosed and unsolved. Specifically, the relationships between drivers' characteristics and road accidents are not fully understood. In this work, we started by collecting a dataset between 2008 and 2010 from Dubai Police. After preprocessing, we modeled the data to 19 attributes and 5 classes. We used WEKA data mining software with the 4 classifier methods (Decision trees, Rules induction, BayesNet, and MultilayerPerceptron). We applied data mining technologies to link recorded accident, driver, and road factors to accident severity in Dubai, and generated a set of rules that could be used by the Dubai Police to improve safety. Empirical results showed that the developed models could classify accidents within reasonable accuracy. The comparison of these classifiers showed that the neural networks classifier (MultilayerPerceptron algorithm) is the best classifier for all classes. We generated recommendations and conclusions.
Keywords: Decision Trees; Rules Induction; Bayesnet; Multilayerperceptron; WEKA; Dubai Car Accidents
1. INTRODUCTION
In the United Arab Emirates, there are about 600 people killed in car accidents each year. Road traffic accidents are the second major cause of deaths in the UAE. Dubai in particular has suffered a loss of Dh4.7 billion due to traffic accidents in the last seven years. According to Engineer Hussain Al Banna, Director of Traffic at the Dubai Roads and Transport Authority (RTA), traffic accidents are not only resulting in loss of lives and injuries but are also causing a huge dent to the emirate's economy. Traffic accidents in 2007 caused an economic loss of some Dh720 million which is around one per cent of the gross domestic product (GDP) of Dubai. The losses include the cost of damages to vehicles and road infrastructure, and estimated charges for police and ambulance movements. Therefore, methods to reduce traffic accident severity in Dubai are of great interest. Analyzing, interpreting and making maximum use of the data is difficult and resource demanding due to the exponential growth of many businesses, governmental and scientific databases [1].
and limits of such scientific disciplines, many scholars try to indicate the basic tasks of data mining. Data mining is defined as the analysis of (often large) observational data sets to find unsuspected relationships and to summarize the data in novel ways that are both understandable and useful to the data owner [2].
Data mining can also be seen as a combination of tools, techniques and processes in knowledge discovery. In other words, it uses a variety of tools ranging from classical statistical methods to neural networks and other new techniques originating from machine learning and artificial intelligence in improving database promotion and process optimization. Six basic functions or activities of data mining are classified into directed and undirected data mining. Specifically classification, estimation and prediction are directed, where the available data is used to build a model that describes one particular variable of interest in terms of the rest of the available data. Affinity grouping or association rules, clustering, description and visualization on the other hand are undirected data mining where the goal is to establish some relationship among all variables. Up to recent time, the only analysis made on data to get meaning out of it, is simple statistical manipulation that has no power to show all the necessary information content of a given data. But data mining technology, on the other hand has the greatest potential in identifying various interesting patterns for enabling organizations to control data resources for strategic planning and decision-making in their domain area [3].
Traffic control system is one of the various areas, here critical data about the well-being of the society is recorded and kept. Various aspects of a traffic system like vehicle accidents, traffic volumes and concentration are recorded at different levels. In connection to this, injury severities resulted from road traffic accident are one of the areas of concern.
According to a report prepared by the research and studies wing of Abu Dhabi Police, traffic accidents are the second leading cause of death in the UAE. Over 86% of road accidents are the result of human error, and the remaining 14% of accidents are attributed to various factors such as the state of roads and weather conditions [4].
Dubai in particular experiences terrible human and financial losses caused by traffic accidents. According to Al Banna, Director of Traffic at the Dubai Roads and Transport Authority (RTA), statistics indicate a possible 5,200 fatalities and more than 27,000 injuries over the next eight years,
plus an economic loss of around Dh20.1 billion by 2015. In managing and controlling the city’s traffic system, the Dubai traffic office is structurally organized under three major departments’ namely administrative support, accident investigation, security and control [5,6].
The automated traffic information system for Dubai Traffic Office aims helping the office in information handling. It has been seen that data especially in some regions where the traffic and number of vehicles are huge, does not get enough attention to use it as a base for decision-making. Identifying and knowing a given pattern of data in a given traffic office will help the decision makers in deciding on the specific future activities. Thus, through this research work an attempt has been made to apply data mining tools and techniques in analyzing and determining interesting patterns especially with respect to injury severity, on road accidents data at Dubai Region Traffic Control System. In order to plan and implement effective strategies in reducing the severity of the injury and vehicle accident at large in UAE, there is a need for actionable information which is obviously a result of a research work. So, in the effort of alleviating the current problem of vehicle accidents, identifying factors leading to accidents through developing a capacity to design and implement an effective traffic information system that can provide timely and accurate traffic information is very crucial. Timely and reliable data collected about vehicle accidents can be used to identify major determinants and risk factors for vehicle accidents, severe injury and fatalities and to take preventive measures so that the effort of improving the quality of life will be enhanced. All the previous researches were conducted by using small proportion of the accumulated data. Besides, in those researches data analysis was conducted by using simple statistical methods.
Since the analysis made by using traditional methods focus on problems with much more manageable number of variables and cases than may be encountered in real world, they have limited capacity to discover new and unanticipated patterns and relationships that are hidden in conventional databases
accident in particular and improving the quality of life in general. Moreover it will also be an input for researches in the same area.
The experiment basically comprises training; building and validation of the models in addition to analysis and interpretation of the results using WEKA software for the Emirate of Dubai. Some conclusions are provided towards the end.
2. ROAD TRAFFIC ACCIDENT AND INJURY ANALYSIS
The costs of fatalities and injuries due to traffic accidents have a great impact on the society. In recent years, researchers have paid increasing attention to determining factors that significantly affect severity of driver injuries caused by traffic accidents. There are several approaches that researchers have employed to study this problem. These include neural network, nesting logic formulation, log-linear model, fuzzy ART maps and so on.
Applying data mining techniques to model traffic accident data records can help to understand the characteristics of drivers’ behavior, roadway condition and weather condition that were causally connected with different injury severities. This can help decision makers to formulate better traffic safety control policies.
Researchers applied data fusion, ensemble and clustering to improve the accuracy of individual classifiers for two categories of severity (bodily injury and property damage) of road traffic accidents. The individual classifiers used were neural network and decision trees. They applied a clustering algorithm to the dataset to divide it into subsets, and then used each subset of data to train the classifiers. They found that classification based on clustering works better if the variation in observations is relatively large as in Korean road traffic accident data [7].
Others used neural networks to analyze vehicle accident that occurred at intersections in Milan, Italy. They chose feed-forward MLP using BP learning. The model had 10 input nodes for eight variables (day or night, traffic flows circulating in the intersection, number of virtual conflict points, and number of real conflict points, type of intersection, accident type, road surface condition, and weather conditions). The output node was called an accident index and was calculated as the ratio between the number of accidents for a given intersection and the number of accidents at the most
dangerous intersection. Results showed that the highest accident index for running over of pedestrian occurs at non-signalized intersections at nighttime [8,9]
Chang 2006 used an analysis of traffic injury severity for nonparametric classification tree techniques to prevent accidents [10]. Beshah 2010 studied the relationship between drivers’ age, gender, vehicle mass, impact speed or driving speed measure with fatalities. The general objective of the research was to investigate the potential applicability of data mining technology in developing a model that can support road traffic accident severity analysis in the effort of preventing and controlling vehicle accident at the city of Addis Ababa [11, 12]. Chong 2011 studied the traffic accident analysis using decision trees and neural networks [13]. Vandana 2012 studied the data mining concept for road traffic accident which is defined as any vehicle accident occurring on a public highway. It includes collisions between vehicles and animals, vehicles and pedestrians, or vehicles and fixed obstacles. Single vehicle accidents, which involve a single vehicle, that means without other road user, are also included [14].
At all levels, whether at national or international level, road traffic accidents continue to be a growing problem. In connection with this, according to a World Health organization WHO/World Bank Report, deaths from non-communicable diseases are expected to grow from 28.1 million a year in 1990 to 49.7 million by 2020, which is an increase in absolute number of 77%. Traffic accidents are the main cause of this rise. Road traffic injuries are expected to take higher place in the rank order of disease burden in the near future.
The tragedy is more or less similar in UAE, Dubai. The rate of traffic accidents in Dubai goes up together with the increase of motor vehicles and population size. The rise in automobile ownership together with the poor condition of the roads has resulted in the high level of traffic safety and congestion problems.
As to the cause of road traffic accidents in UAE, the first four leading causes as identified by the Dubai Road Transport Authority (RTA) are not respecting speed limit, driver characteristics, not giving priority for pedestrian, and vehicle defects. Especially with respect to the vehicle defects although there is an annual program for technical investigation of vehicles, it is not enough when compared to the magnitude of the problem. Consequently, conducting occasional technical investigation have got due attention now days.
3. EXPERIMENT SETUP
Our study is based on the records from the year 2008 to 2010. We developed from the real data 19 attributes which cover accident, driver, and road/vehicle conditions from the real data. Recently, UAE poses restrictive rules and regulation for drivers.
3.1 Accident Data Collection at Dubai Traffic Office
Dubai traffic police department assigns an investigator to collect the necessary details about a given accident. Notifications are normally reported by the drivers or any party being involved or having interest on it because the low requires doing so. On site investigation and recording is done with the aim of finding detailed and accurate information as to its cause, determine whether or not there has been violation of the law and ultimately to prevent the re-occurrence of further accidents. But sometimes as reported by the officers, due to time gap between the accident and the arrival of traffic officers, some details like the severity level and cause of an accident may not be identified effectively.
This accident record is basically used for various purposes in the office and for other stakeholder.
National and regional transport offices use the data in directing their focus of attention in decision and policy makers with regard to road safety. Different health offices and non-governmental organizations working in this area use the data in determining and managing health problem in society.
Recent analysis proved that 81% of the accident all over the county is due to drivers fault and the other is due to vehicle, pedestrian and road faults. The main road safety problems are:
• Drivers not respecting pedestrian priority; • Over speeding;
• Unsafe utilization of freight vehicles for passenger transportation;
• Poor skill and undisciplined behavior of drivers;
• Less engineering effort in road design to consider safety;
• Poor vehicle conditions;
• Pedestrian not taking proper precautions; • Not enough traffic law enforcement;
•
Lack of proper emergency medical services.
Road safety publicity, targeted traffic law enforcement, hazardous location identification, pedestrian awareness, upgrading drivers skill and behavior both technically and with respect to keeping rules should get due consideration [15].
We studied the occurrence and driver
characteristics associated in Dubai. The purpose of the study was to determine the incidence density of hospital treated motor vehicle injuries and to identify driver and vehicle characteristics placing them at increased risk of inflecting injuries.
3.2 Accident Data Set: Data Understanding
A good understanding of the data at hand leads to a better success in achieving the data mining goal. The success criterion for this data mining research is the discovery of accident severity classification rules that would find out and differentiate accidents which are serious to those which are potentially not serious in different levels. Provided that reasonable accident severity classification rules are discovered, the office could device a means to reduce the number of fatal and serious injuries and be able to recognize the level of severity when an accident has occurred. In short, this can help decision makers to formulate better traffic safety control policies.
The target attribute has five classes: death, severe, moderate, minor, and no injury.
3.3 Attribute/Variable Selection
Table 1: Class Labels
Table 2: Selected 19 Attributes with Their Data Type and Description (Accident, Driver, Road)
Attribute Name SN Data Type
Description
Accid_day -- Nominal The accident occurred on which day of the week.
Accid_year -- Nominal Year of accident
N_of_P_injuried -- Nominal Number of injured persons
Accid_cause 9 Nominal Cause of the accident
Accid_type 10 Nominal Type of the accident
Driv_age -- Nominal Age of the driver
Driv_nation 44 Nominal Nationality of the driver
Driv_gen 3 Nominal Gender of the driver
Driv_exp -- Numeric Driving experience of the driver
Driv_vec_type 9 Nominal Driver’s vehicle type causing the accident
Driv_
lice_source
-- Numeric Source of the driver's license
Driv_drink 4 Nominal Whether the driver was drunk or not
Driv_belt 4 Nominal The usage of the belt during driving
Road_
speed_limit
-- Numeric The road speed limit
Road _accid_place
-- Nominal Place of the accident
Road_
accid_type
10 Nominal Type of the accident road
Road_
light_condition
4 Nominal Light condition at the time of the accident
Weather_
Condition
5 Nominal The condition of the weather
Road_surface 5 Nominal Whether the surface of the road was dry, wet, sandy, oily,….
Table 3: The Detailed SN for Accid_cause Attribute
Tables 4-6 shows the numbers of records from 2008 to 2010 as follows: (1=death, 2= severe, 3= moderate, 4= minor and 5= no injury).
No. Class Label Class Description
1 Death One or more persons dies within 30 days of the accident.
2 Severe A person is injured and requires intensive care.
3 Moderate One or more persons injured and detained in hospital for more than twelve hours.
4 Minor All persons involved either not detained in hospitals or detained for not more than twelve hours.
5 No_ injury No injury is reported with or without property loss.
SN# Accident Cause
1 Lack of vehicle control
2 Not keeping in lane
3 Not looking before entering the road
4 Not keeping enough distance
5 Jumping red signals
6 Speeding
7 Reckless driving
8 Tire burst
Table 4: The 603 Records for Year 2008
Table 5: The 630 Records for Year 2009
Table 6: The 654 Records for Year 2010
File 1 2 3 4 5
Naïf 0 1 18 13 37
Hatta 0 13 26 10 21
Bur Dubai 0 8 14 23 75
Al Rashidiya 0 15 30 27 33
Al Qusais 0 13 24 22 82
Almurqabat 0 1 21 17 60
Mixed (regions) 50 0 0 0 0
Sum of each class 50 51 133 112 308
4. DATA PREPARATION FOR ANALYSIS
Among 1887 records collected from the police department, some of them are not complete, or do not cover all attributes. The process of data cleaning from incomplete, inconsistent and noisy data is found in Han and Kamber 2006 [16].
4.1 Stratified Sampling
In statistics, stratified sampling is a method of sampling from a population. In a stratified sampling, the sampling frame is divided into non-overlapping groups or strata, e.g. geographical areas, age-groups, genders. A sample is taken from each stratum. Since this sample taken is a simple
random sample, it is referred to as stratified random sampling.
When subpopulations within an overall population vary, it is useful to sample each subpopulation (stratum) independently. Stratification is the process of dividing members of the population into homogeneous subgroups before sampling. The strata should be mutually exclusive; every element in the population must be assigned to only one stratum. [17,18]. Finally, the number of records to be considered is:
Table 7: The 600 Selected Records for 2008-2010 Dataset
Class Year
2008 2009 2010
1 17 16 15
2 5 17 16
3 29 47 41
4 68 28 34
5 81 92 94
Total 200 200 200
4.2 WEKA Toolkit
The WEKA (Waikato Environment for Knowledge
Analysis) is an easy to use graphical user interface
that harnesses the power of the WEKA software [19, 20]. The major WEKA packages are Filters, Classifiers, Clusters, Associations, and Attribute Selection is represented in the Explorer along with a Visualization tool, which allows datasets and the predictions of Classifiers and Clusters to be visualized in two dimensions. The workbench contains a collection of visualization tools and algorithms for data analysis and predictive modeling together with graphical user interfaces for easy access to this functionality. It was primarily designed as a tool for analyzing data from agricultural domains. Now it is used in many different application areas, in particular for educational purposes and research.
It was In WEKA, datasets should be formatted to the ARFF format. The WEKA Explorer will use these automatically. An ARFF (Attribute-Relation File Format) file is an ASCII text file that describes a list of instances sharing a set of attributes. ARFF files were developed by the Machine Learning Project at the Department of Computer Science of The University of Waikato for use with WEKA.
File 1 2 3 4 5
Bur Dubai(1) 0 5 28 74 83
Bur Dubai(2) 0 6 28 60 75
Bur Dubai(3) 1 3 32 71 87
Bur Dubai(4) 50 0 0 0 0
Sum of each class 51 14 88 205 245
File 1 2 3 4 5
Naïf 0 3 23 20 57
Al Qusais 0 14 20 26 91
Al Rashidiya 0 15 43 24 46
Jebel Ali 0 20 63 19 96
Bur Dubai & mixed 50 0 0 0 0
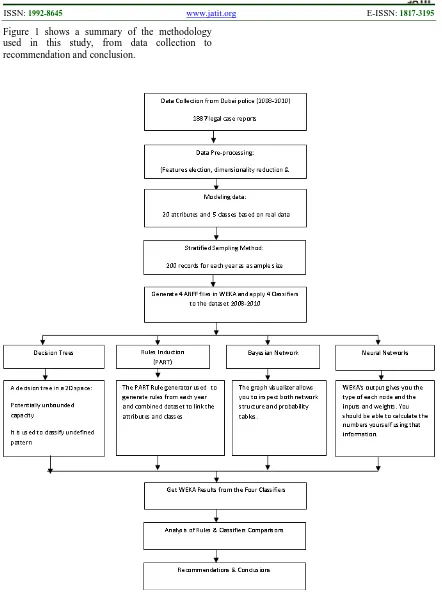
Figure 1 shows a summary of the methodology used in this study, from data collection to recommendation and conclusion.
5. EXPERIMENT RESULTS
There are two parts in the results. First, the analysis of the rules applying PART algorithm is discussed. Second, a comparison of the different classifiers to find out which classifier is more suitable for traffic accidents.
The confusion matrix is used to compute the accuracy rate of each class. It shows, for each class, how instances from that class received the various classifications. All correct guesses are located in the diagonal of the table, so it's easy to visually inspect the table for errors.
[image:8.612.86.304.587.740.2]Table 8 shows that the total numbers of the diagonal = (22+13+93+94+267) = 489 correctly classified instances out of 600 instances. This implies that the accuracy is 81.5 %.
Table 8: Confusion Matrix for PART Algorithm
In this section, analysis of the rules for the years 2008 to 2010 is discussed for each of the five classes; Death, Severe, Moderate, Minor, and No injury. 9 rules were generated for the death class, 5 rules were generated for the severe class, 22 rules were generated for the moderate class, 21 rules were generated for the minor class, and 1 rule was generated for the no_injury class by WEKA.
5.1 Analysis for the Death Class
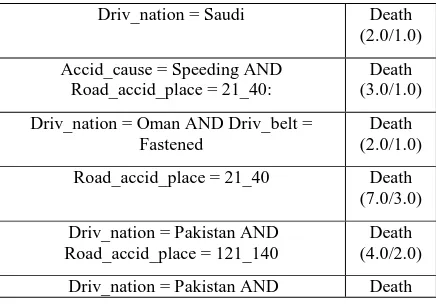
Based on the rules obtained, death class occurs in the following cases:
Driv_nation = Saudi Death
(2.0/1.0)
Accid_cause = Speeding AND Road_accid_place = 21_40:
Death (3.0/1.0)
Driv_nation = Oman AND Driv_belt = Fastened
Death (2.0/1.0)
Road_accid_place = 21_40 Death (7.0/3.0)
Driv_nation = Pakistan AND Road_accid_place = 121_140
Death (4.0/2.0)
Driv_nation = Pakistan AND Death
Road_accid_place = 61_80 AND Road_light_cond = Daylight AND
Road_speed_limit <= 50
(4.0/2.0)
Driv_nation = Lebanon Death
(3.0/2.0)
Driv_nation = India AND Accid_type = Stationary_hit
Death (3.0/1.0)
Driv_nation = India AND Accid_type = Run_over AND Accid_day = Sa:
Death (3.0/1.0)
Through the generated rules, it was noticed that fatal accidents occurred during the day for the three years of study. Most accidents took place most probably on Saturdays caused by drivers of nationalities: Saudi, Oman, Pakistan, Lebanon, or India, due to speeding, and where the accident type is run over or stationary hit. The place of accidents included mainly all places between Al Dheyafa Road and Al Maktoum Hospital Street, or Al Nakheel Road and Al Safa Road, or Doha Road junction of Dubai Financial Market Road and Etisalat junction.
5.2 Analysis for the Severe Class
Based on the rules obtained, severe class occurs in the following cases:
Driv_nation = UAE AND Driv_age = 19_and_under
Severe (3.0)
Driv_nation = Pakistan AND Road_accid_place = 61_80 AND Driv_age
= 35_39
Severe (3.0/1.0)
Driv_nation = Pakistan AND Road_accid_place = 161_180
Severe (3.0/1.0)
Driv_nation = India AND Accid_type = Run_over
Severe (9.0/5.0)
Driv_belt = Not_fastened Severe (3.0/1.0)
Through the generated rules, it was noticed that severe accidents occurred in places between Al Nakheel Road and Al Safa Road, or Jebel Ali Airport City and Junction of Halab Street and Damascus Street. The type of these accidents was run- over, and most likely caused by drivers of ages between 19 years and under, or between 35 to 39 years old with seatbelts were not fastened, and of nationalities: UAE, Pakistan, or India.
a B c d E classified as
22 3 13 10 0 a = Death
6 13 14 5 0 b = Severe
5 2 93 17 0 c = Moderate
5 3 28 94 0 d = Minor
5.3 Analysis for the Moderate Class
Based on the rules obtained, moderate class occurs in the following cases:
Accid_cause = Tire_burst AND Road_accid_place = 121_140
Moderate (2.0)
Accid_cause = Not_looking_bef_enter_rd
Moderate (25.0/10.0)
Driv_nation = Syria AND Driv_exp <= 4
Moderate (4.0/1.0)
Driv_nation = Jordon Moderate (3.0/1.0)
Accid_cause = Jumping_red_signal AND Road_speed_limit > 70
Moderate (10.0/3.0)
Accid_cause = Reckless_driving Moderate (17.0/9.0)
Road_light_cond = Daylight AND Accid_cause = Not_keeping_distance
AND Accid_day = Sa
Moderate (6.0/1.0)
Driv_nation = Palestine Moderate (5.0/2.0)
Driv_nation = Philippines Moderate (3.0/1.0)
Accid_cause = Speeding Moderate (13.0/7.0)
Road_accid_type = One_direction AND Road_light_cond = Daylight AND
Road_speed_limit > 50
Moderate (3.0)
Road_accid_type = 1Direction_2lanes Moderate (3.0/1.0)
Driv_nation = UK Moderate (3.0/1.0)
Driv_nation = UAE AND Accid_year = 2008
Moderate (11.0/3.0)
Driv_nation = Egypt: Moderate (7.0/2.0)
Driv_nation = Iran: Moderate (5.0/2.0)
Case17: Driv_nation = UAE: Moderate (10.0/6.0)
Driv_nation = Pakistan AND Road_accid_place = 61_80 AND Accid_year =2008 AND Accid_cause =
Lack_of_respect_for_rd_users AND Road_speed_limit <= 50:
Moderate (3.0/1.0)
Driv_nation = Pakistan AND Driv_age = 25_29:
Moderate (5.0/2.0)
Driv_nation = India AND Accid_type = Run_over AND Accid_day = Tu:
Moderate (3.0)
Driv_belt = Unknown: Moderate
(5.0/2.0)
Road_accid_place = 121_140 AND Driv_exp <= 2:
Moderate (2.0)
Through the generated rules, it was noticed that moderate accidents occurred during the day in places between Al Nakheel Road and Al Safa Road, or Doha Road junction of Dubai Financial Market Road and Etisalat junction. The type of these accidents was run- over, and most likely caused by tire burst or not looking before entering the road or jumping red signal or reckless driving or not keeping enough distance or speeding or lack of respect for road users, by experienced drivers for four years or less whose ages between 25 to 29 years old. Drivers were of nationalities: Syria, Jordon, Palestine, Philippines, UK, Egypt, Iran, UAE, Pakistan, or India.
5.4 Analysis for the Minor Class
Based on the rules obtained, minor class occurs in the following cases:
Driv_nation = Bangladesh Minor (12.0/5.0)
Accid_cause = Not_looking_bef_enter_rd AND Accid_year = 2008
Minor (14.0/2.0)
Driv_nation = Others Minor (12.0/5.0)
Driv_nation = Syria Minor (3.0)
Road_light_cond = Daylight AND Accid_cause = Not_keeping_distance AND
Accid_year = 2008 AND Driv_belt = Fastened
Minor (7.0)
Road_light_cond = Daylight AND Accid_cause = Not_keeping_distance
Minor (15.0/7.0)
Accid_cause = Jumping_red_signal Minor (5.0)
Road_accid_type = Roundabout Minor (6.0/1.0)
Road_light_cond = Dark_light_not_functional
Minor (3.0)
N_of_p_injured = 2 AND Accid_day = Sa Minor (4.0/1.0)
(4.0/1.0)
Driv_nation = Iran AND Road_accid_type = 2 Directions_4_ or _more _lanes
Minor (3.0/1.0)
Driv_nation = Pakistan AND Road_accid_place = 101_120
Minor (6.0/1.0)
Driv_nation = Egypt AND Accid_year = 2008
Minor (5.0/1.0)
Driv_nation = Pakistan AND Road_accid_place = 121_140 AND
Accid_year = 2008
Minor (5.0/1.0)
Driv_nation = Pakistan AND Road_accid_place = 201_228
Minor (3.0)
Driv_nation = Pakistan Minor (7.0/3.0)
Driv_nation = Lebanon AND Accid_cause = Others
Minor (3.0/1.0)
Driv_nation = India AND Accid_type = Side_collision AND Driv_exp > 10
Minor (3.0)
Driv_nation = India AND Accid_type = Run_over AND Road_accid_type = 1
Direction _ 1 lane
Minor (4.0/2.0)
Road_accid_place = 121_140 Minor (2.0)
Through the generated rules, it was noticed that minor accidents occurred during the day in places between Al Wuheida Road and Doha Road or between Doha Road junction of Dubai Financial Market Road and Etisalat junction or between Naif Road Service Road and Zabeel Park parking. The type of these accidents was side collision or run- over, and most likely due to not looking before entering the road or not keeping enough distance or jumping red signals others, by experienced drivers for more than 10 years. Drivers were of nationalities: Bangladesh, Syria, Iran, Pakistan, Egypt, Lebanon, or India. The type of roads was either roundabout or 2Directions_4_or_more_lanes, or 1Direction_1lane.
5.5 Analysis for the No Injury Class
Only one rule is generated for this class. It occurs in the following case:
N_of_p_injured = 0: No_injury (267.0)
This class generates only one trivial and obvious condition.
5.6 Comparison of Classifiers
In this section, comparisons of the performance of the four classifiers in WEKA; J48, BayesNet, PART, and MultilayerPerceptron is discussed.
The number of correctly classified and incorrectly classified instances and the time taken to build the model in each classifier is described in tables 9 and 10. The correctly and incorrectly classified instances show the percentage of test instances that were correctly and incorrectly classified. They merely give the number of instances the model correctly modeled, incorrectly modeled, and a total for good measure. The percentage of correctly classified instances is often called accuracy or sample accuracy [21, 22, 23].
As shown in tables 9 and 10,
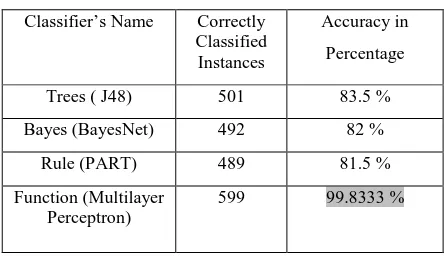
MultilayerPerception gave the highest accuracy or percentage of the number of correctly classified instances, and BayesNet algorithm gave the highest speed to build the model.
[image:10.612.314.536.376.505.2]The values of the Kappa statistic indicate that there are no discrepancies among the different classifiers.
Table 9: Accuracy of Classifiers
Classifier’s Name Correctly Classified Instances
Accuracy in
Percentage
Trees ( J48) 501 83.5 %
Bayes (BayesNet) 492 82 %
Rule (PART) 489 81.5 %
Function (Multilayer Perceptron)
[image:10.612.318.533.535.621.2]599 99.8333 %
Table 10: Times Taken to Build Each Model
Classifier’s Name Times/Second
Trees ( J48) 0.25 seconds
Bayes (BayesNet) 0.17 seconds
Rule (PART) 0.86 seconds
Table 11 Comparison Of Classifiers With Respect To Error
As shown in table 11, Multilayerperceptron gave the best performance in terms of Kappa statistic because it gave the highest value, and also the best in terms of mean absolute error and root mean squared error because it gave the least values.
5.6.1 Comparison of classifiers with respect to accuracy by classes
Let TP, FP, FN and TN, denote true positive rate, false positive rate, false negative and true negative respectively. Figure 2 summarizes the predicted and the actual classes [24].
Predicted class(observation)
T F
Actual
expectation
T
TP : correct result FN (Type II error) [image:11.612.323.527.162.288.2]F
FP: (type I error) TN: correct absence of resultsFigure 2: Summary of Measures (Confusion Matrix)
Accuracy – The proportion of the total number of predictions that were correct:
Accuracy(%) = (TN + TP) / (TN + FN + FP + TP)
Precision – The proportion of the predicted relevant data that were correct:
Precision(%) = TP / (FP + TP)
Accuracy indicates proximity of measurement results to the true value; it is from the confusion matrix.
While precision indicates to the repeatability or reproducibility of the measurement see Figure 3.
Figure 3: Difference Between Accuracy and Precision [25]
The measurement system is designated valid, if it is both accurate and precise. Classifiers with high precision and accuracy and low FP rates are preferred. In this paper, we use a new measurement: AP = accuracy * precision
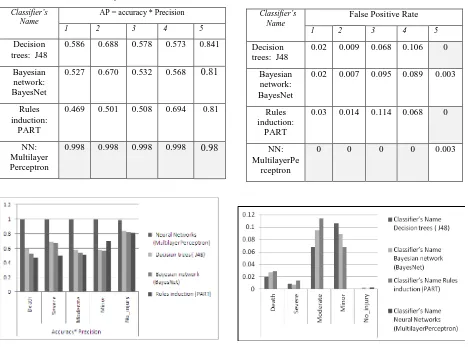
Table 12 and figure 4 show the comparison among these classifiers based on AP. The impact of AP is amplified in order to conclude which algorithm is the most suitable one with the application. Number of classes shows how many classes with good performance measures.
(1=death, 2= severe, 3= moderate, 4= minor and 5= no njury).
Classifier’s Name Kappa Statistic
Mean absolute
error
Root mean squared
error
Trees ( J48) 0.7647 0.0861 0.2074
Bayes (BayesNet) 0.7433 0.104 0.2246
Rule (PART) 0.7361 0.0971 0.2204
Function (MultilayerPerceptron)
[image:11.612.76.304.451.549.2]Table 12: Product of Accuracy by Precision (AP) for All Classifiers
Figure 4: The Histogram of Table 12
5.6.2 Comparison of classifiers with respect to errors by classes
False positive – The proportion of the predicted irrelevant data that were correct:
FP (%) = TN / (TN + FN)
FP Rate is shown in table 13 and figure 5 to give a better picture for each class.
Table 13: FP Rate for All Classifiers
Figure 5: The Histogram of Table 13
Based on the values of AP and FP Rate that are performed by each of the different classifiers, we observe the following:
MultilayerPerception gave the best performance since it gave high values of AP for the five classes. In addition, it also gave a low value for FP Rate for four classes out of five (death, severe, moderate, and minor) but it takes more time for processing
Decision trees J48 is categorized as the second the classifier after neural networks.
Rules PART is categorized as categorized as the last classifier except for minor class.
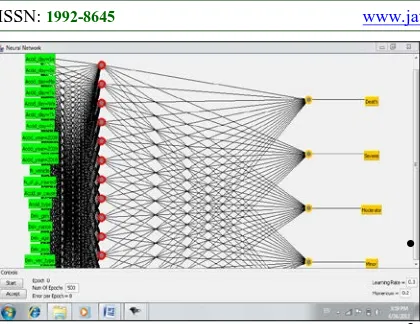
Figure 6 shows that the ANN classifier has as input 19 attributes, 19 neurons in the hidden layer and as output 5 classes.
Classifier’s Name
AP = accuracy * Precision
1 2 3 4 5
Decision trees: J48
0.586 0.688 0.578 0.573 0.841
Bayesian network: BayesNet
0.527 0.670 0.532 0.568 0.81
Rules induction:
PART
0.469 0.501 0.508 0.694 0.81
NN: Multilayer Perceptron
0.998 0.998 0.998 0.998 0.98
Classifier’s
Name False Positive Rate 1 2 3 4 5
Decision trees: J48
0.02 0.009 0.068 0.106 0
Bayesian network: BayesNet
0.02 0.007 0.095 0.089 0.003
Rules induction:
PART
0.03 0.014 0.114 0.068 0
NN: MultilayerPe
rceptron
Figure 6: MultilayerPerceptron Classifier
6. DISCUSSIONS & RECOMMENDATIONS
From this research, a number of interesting facts were found, some of which were expected and some were quite surprising. As stated previously, a sample of accidents occurred during the period between 2008 and 2010 were selected for applying the data mining methods. The analysis of the severity in the 600 selected individual accidents of study illustrated that 8% of the crashes resulted in a death, 6% of the crashes resulted in a severe injury, 20% resulted in a moderate injury, 21% resulted in a minor injury, and 45% resulted in no injury crashes. From all accidents in the total records received there were a total of 151 deaths. Although it would be much better if this figure was 0, this level was reasonably acceptable considering the large volumes of traffic which were recorded for the various areas of Dubai. It was found that death accidents caused by drivers with fastened seatbelts. This is quite surprising because these types of incidents often generate a lot of press coverage and so it is commonly known that unfastened seatbelts drivers are at greater risk than others.
Severe accidents were caused by drivers of ages between 19 years and under, or between 35 to 39 years old with seatbelts were not fastened. Moderate classes were caused by experienced drivers for four years or less whose ages between 25 to 29 years old. This is really surprising that more accidents are caused by experienced drivers.
It was also noticed that a number of attributes were surprisingly unseen in the conjunction of the Boolean tests upon attributes in the IF part of the rules for the five classes, although these attributes were normally viewed as being large factors in many road traffic accidents. These attributes were unseen because all values were covered in the rules; all possible values were present in the rules, so they
were pruned and eliminated by WEKA and considered irrelevant
.
Based on the review process of accident reports and obtained results, some recommendations related to road safety are suggested to improve safety in Dubai. The following are some of these recommendations:
• Reduce the speed limit in highways or major roads in Dubai since most number of fatal and severe accidents due to high speed.
• Increase the number of speed cameras in black spot sites where the highest number of death and severe accidents occurred.
• Improve black spot places conditions and more focus should be given while designing new highways and big roads in Dubai.
• Improve light conditions in black spot places to reduce the number of fatal accidents.
• More awareness campaigns should be conducted related to the distraction of drivers’ attentions. Many accidents were caused because of lack of respect for other road users, carelessness and lack of attention, and lack of control. The penalty should be reviewed on the national level.
• Collection of accident data on electronic forms makes storage, retrieval, and analysis of accident data easier, more accurate, and less time and labor consuming. This encourages future research and studies.
The following restrictions were found during this research:
o The data collected from the Dubai police authority were a sample of the traffic case reports for the traffic accidents for the three years of study not the whole reports.
o The focus of the research was on the road traffic accidents during the period between 2008 and 2010 in Dubai.
o The number of received traffic case reports from the Dubai police was not uniform for the three years of study and the five class labels. Some classes had more number of reports than other classes which might affect the mining process.
o There are many data mining techniques. This research focused on four classification algorithms.
7. CONCLUSION & FUTURE WORKS
Our experiments showed that although neural network classifiers can be very accurate for car accidents in Dubai, they take the longest to train and have extensibility issues due to their extremely large and complex nature. It helps decision makers to understand 3 factors, accident, driver’s behavior, and road conditions resulting in fatalities or serious injuries so as to formulate better traffic safety control policies.
The classification accuracy of the classifiers is between 81.5 and 99.8 %. However, when we used AP as a metric, neural network is the best classifier. Police Dept. should take measures to store all its records with all the necessary attributes in an electronic format and to make all decisions based on collected records.
As a future work, it is proposed to study the clustering of the real data to find outliers and to use association rules to find some hidden patterns in the dataset. We can use temporal data diming to the road accident dataset to determine and analyze the historical trends [26].
ACKNOWLEDGEMENT
We would like to thank the staff of the General Traffic Department at Dubai Police for providing all accident records from 2008 to 2010.
REFERENCES:
[1] Ossenbruggen, P. J., J. Pendharkar, et al. (2001) "Roadway safety in rural and small urbanized areas." Accidents Analysis and Prevention 33(4): 485-498,
[2] http://www.dataminingtechniques.net/
[3] A. Bener, D. Crundall, (2005), "Road traffic accidents in the United Arab Emirates compared to Western countries”, Advances in Transportation Studies an international Journal,
[4] Faouzi Kamoun, Naoufel Werghi, Mohammed Al Blushi, (2010) “On the Appropriateness of Incident Management Systems in Developing Countries: A Case from the UAE”, journal of Technology Management & Innovation
[5] http://www.dubaipolice.gov.ae/dp/english
[6]http://gulfnews.com/news/gulf/uae/traffic- transport/traffic-accidents-are-second-leading-cause-of-death-in-uae-1.89596
[7] Sohn, S. & S. Lee, (2002) "Data fusion, ensemble and clustering to improve the classification accuracy for the severity of road traffic accidents in Korea." Safety Science 41(1): 1-14
[8] Wong, J. & Y. Chung, (2008) "Comparison of Methodology Approach to Identify Causal Factors of Accident Severity." Transportation Research Record 2083: 190-198
[9] Miao M. Chong, Ajith Abraham, Marcin Paprzycki,(2004) “Traffic Accident Analysis Decision Trees and Neural Networks”, IADIS International Conference on Applied Computing
[10] Chang, L. & H. Wang, (2006) "Analysis of traffic injury severity: An application of non-parametric classification tree techniques Accident analysis and prevention", Accident analysis and prevention 38(5): 1019-1027 [11] T. Beshah & S. Hill, (2010) "Mining Road
Traffic Accident Data to Improve Safety: Role of Road-related Factors on Accident Severity in Ethiopia", Proceedings of AAAI Artificial Intelligence for Development (AI-D'10)
[12] Beshah, T.; Ejigu, D.; Abraham, A.; Snasel, V.; Kromer, P., (2011) “Pattern recognition and knowledge discovery from road traffic accident data in Ethiopia: Implications for improving road safety”, World Congress on Information and Communication Technologies (WICT)
[13 ]Chong, M., Abraham A., & d Paprzycki M. (2011), Traffic Accident Analysis Using Decision Trees and Neural Networks. Available at with URL: http://falklands.globat.com/~softcomput
ing.net/informatica1.pdf
[14] Vandana Munde, Sachin Deshpande, S.K.Shinde, (2012) “Data Mining for Traffic Accident Analysis”, International Conference on Advances in Computing and Management [15] Wong, J. & Y. Chung, (2008) "Comparison of
Methodology Approach to Identify Causal Factors of Accident Severity." Transportation Research Record 2083: 190-198
[16] Han J. and Kamber M. (2006) “Data Mining: Concepts and Techniques, 2nd ed.” Morgan Kaufmann Publishers, ISBN 1-55860-901-6 [17] S.Krishnaveni, & Dr.M.Hemalatha, (2011)
[18] S.Krishnaveni, & Dr.M.Hemalatha, (2011) “A Perspective Analysis of Traffic Accident using Data Mining Techniques”, International Journal of Computer Applications
[19] www.cs.waikato.ac.nz/aml/weka [20] http://weka.wikispaces.com/Primer
[21] J. Ashok Kumar and P.R. Rao, “Errors of
Supervised Classification Techniques on Real World Problems”, V1, N5, 2010,
Journal of Global Research in Computer Science, Available Online at www.jgrcs.info [22] Lihua Feng & Weihu Hong (2009),
“Classification Error of multilayer perceptron neural networks”, Neural Computing & Applications 18:377–380
[23]
Bryant, www.comp.rgu.ac.uk/staff/chb/teach ing/cmm510/lec5_counting_cost.pdf
[24] Xhemali D, Hinde C J & Stone R ( 2009), “ Naïve Bayes vs. Decision Trees vs. Neural Networks in the Classification of Training Web pages”, IJCSI V4 N1, pp 16-23.
[25] http://en.wikipedia.org/wiki/Sensitivity_and_s pecificity
![Figure 3: Difference Between Accuracy and Precision [25]](https://thumb-us.123doks.com/thumbv2/123dok_us/8916746.962200/11.612.323.527.162.288/figure-difference-accuracy-precision.webp)
![Assessment of Physiological Health Status in Relations to Different Anthropometric and Cardio respiratory Measures of Head Supported Load Carrying Male Porters of Sikkim, India [Article Retracted]](data:image/gif;base64,R0lGODlhAQABAIAAAP///wAAACH5BAEAAAAALAAAAAABAAEAAAICRAEAOw==)