U P D A T E
Open Access
A randomised trial of adaptive pacing therapy,
cognitive behaviour therapy, graded exercise,
and specialist medical care for chronic fatigue
syndrome (PACE): statistical analysis plan
Rebecca Walwyn
1,8*, Laura Potts
1, Paul McCrone
2, Anthony L Johnson
3,4, Julia C DeCesare
7, Hannah Baber
7,
Kimberley Goldsmith
1, Michael Sharpe
5, Trudie Chalder
6and Peter D White
7Abstract
Background:The publication of protocols by medical journals is increasingly becoming an accepted means for promoting good quality research and maximising transparency. Recently, Finfer and Bellomo have suggested the publication of statistical analysis plans (SAPs).The aim of this paper is to make public and to report in detail the planned analyses that were approved by the Trial Steering Committee in May 2010 for the principal papers of the PACE (Pacing, graded Activity, and Cognitive behaviour therapy: a randomised Evaluation) trial, a treatment trial for chronic fatigue syndrome. It illustrates planned analyses of a complex intervention trial that allows for the impact of clustering by care providers, where multiple care-providers are present for each patient in some but not all arms of the trial.
Results:The trial design, objectives and data collection are reported. Considerations relating to blinding, samples, adherence to the protocol, stratification, centre and other clustering effects, missing data, multiplicity and
compliance are described. Descriptive, interim and final analyses of the primary and secondary outcomes are then outlined.
Conclusions:This SAP maximises transparency, providing a record of all planned analyses, and it may be a resource for those who are developing SAPs, acting as an illustrative example for teaching and methodological research. It is not the sum of the statistical analysis sections of the principal papers, being completed well before individual papers were drafted.
Trial registration:ISRCTN54285094 assigned 22 May 2003; First participant was randomised on 18 March 2005.
Keywords:Statistical analysis plan, chronic fatigue syndrome, myalgic encephalomyelitis, randomised controlled trial, PACE trial
Update
Background
Publication of statistical analysis plans
The review and publication of study protocols by medical journals are increasingly becoming an accepted means for promoting good quality research and maximising
transparency. Since 1997 The Lancet has actively invited investigators to submit their protocols to the journal for peer review, offering a provisional commitment to publish the principal results where their criteria are satisfied [1-4]. Since 2001, following a call from Chalmers and Altman [5],
BioMed Central has been inviting trialists and other re-searchers to publish their full protocols online [6]. The
British Medical Journal, while not offering peer review or publication as yet, has required authors to submit trial pro-tocols with their manuscripts since January 2005, making them available to editors and reviewers as additional * Correspondence:[email protected]
1
MH&N Clinical Trials Unit, Institute of Psychiatry, King’s College London, DeCrespigny Park, London SE5 8AF, UK
8
Clinical Trials Research Unit, Leeds Institute of Clinical Trials Research, University of Leeds, Leeds LS2 9JT, UK
Full list of author information is available at the end of the article
documentation [7]. More recently, calls have been made for the publication of other key trial documentation. Chan, for instance, has argued the case for public access to regulatory agency submissions [8]. In an editorial for Critical Care and Resuscitation, Finfer and Bellomo suggested the publi-cation of statistical analysis plans [9]. The plans for the NICE-SUGAR (Normoglycaemia in Intensive Care Evalu-ation and Survival Using Glucose Algorithm RegulEvalu-ation) and RENAL (Randomised Evaluation of Normal versus Augmented Level of Replacement Therapy) studies [10,11] were published in the same issue.
A statistical analysis plan (SAP) is defined within the International Conference on Harmonisation’s guidance on the statistical principles for clinical trials (ICH E9) as ‘a document that contains a more technical and detailed elaboration of the principal features of the analysis de-scribed in the protocol, and includes detailed procedures for executing the statistical analysis of the primary and secondary variables and other data’ [12]. According to ICH E9, the statistical analysis plan should be pre-specified, completed after the protocol has been finalised but reviewed and possibly updated as a result of a blind review of the data carried out after the completion of data collection. It is suggested that details of the primary analysis should be clearly distinguished from those of supporting analyses and that the methods for handling missing data, outliers and multiplicity be described [12]. While the statistical analysis plan is clearly an important document, at present it is rarely made available to people outside of the study.
There are many reasons why study-specific statistical analysis plans should be published in full, with electronic journals offering the greatest potential for this to be commonplace. Due to space constraints, the paper pro-viding the principal results often contains only a very limited description of the analyses that were planned or carried out. If the study protocol is published, further in-formation is likely to be available. However, this is often insufficient to enable full replication of the analyses. The statistical analysis plan complements both the protocol and the principal paper by providing a systematic and comprehensive description of the planned analyses, tak-ing into consideration any relevant methodological or clinical developments that may have arisen since the study’s inception. Its publication enables any changes to the original plan to be laid out, increasing the scientific rigour and transparency with which the principal ana-lyses are currently reported.
Maximum transparency regarding what decisions were madea prioricould be achieved by publishing the statis-tical analysis plan, which has been approved by the Trial Steering Committee (TSC), before the results of a study are known. The final analyses reported may differ from those planned, allowing for post-hocanalysis where it is
indicated (as Finfer and Bellomo [9] have noted), reporting alternative methods if statistical models do not converge, and omitting planned analyses that are superseded, redun-dant, or no longer of interest. Assessment of the validity of the analyses, reporting and consequent interpretation would also be made easier by the increased visibility of se-lective or misreporting. This may, in turn, encourage more balanced, accurate and complete reporting of results and ultimately help to raise the standard of trial analyses. Peer review has particular advantages, as it encourages dia-logue, the quality of which is likely to be improved by the level of detail given. Knowledge of this added scrutiny should, in turn, act to promote the quality of the submit-ted plan. This process would be especially valuable if the research is anticipated to generate debate or if it might have a large impact on clinical practice.
The benefits of publication go beyond those specific to the study. Making statistical analysis plans accessible will help future statisticians and other researchers design and analyse better studies. This is because each study throws up different issues, often more complex than the stand-ard textbook ones. Publishing details of the ways in which different groups choose to address these helps to generate discussion and could also promote greater communication and collaboration between methodolo-gists, applied statisticians and researchers.
The PACE trial
The rationale for the trial is outlined in the protocol [13] and main clinical paper [14]. To be brief, chronic fatigue syndrome is characterised by chronic disabling fatigue in the absence of an alternative diagnosis, present in 0.2 to 2.6% of the population. The National Institute for Health and Clinical Excellence (NICE, UK) recommends two treatments: cognitive behaviour therapy (CBT) and graded exercise therapy (GET), but patient organisations recom-mend a third treatment: adaptive pacing therapy (APT). A definitive randomised trial was therefore needed to com-pare all three treatments with specialist medical care (SSMC) and to compare the established treatments (CBT, GET) against the new treatment (APT).
these changes in no way alter the strategy for analysis. The SAP supplements the published protocol [13], the main clinical [14] and health economics [15] papers and the authors’reply [16] to a selection of correspond-ence published by the Lancet [17-24]. They also pro-vide an illustration of the planned analyses of a complex intervention trial taking into account the im-pact of clustering by care providers, where multiple care providers are present for each patient in some but not all arms of the trial. Details of the statistical aspects of multiple therapist-per-patient designs are published elsewhere [25].
Statistical analysis plan
Introduction
Purpose and scope of statistical analysis strategy This document details the presentation and analysis strategy for the principal paper(s) reporting results from the PACE Trial. It is intended that the results reported in these papers will follow the strategy set out here; subse-quent papers of a more exploratory nature will not be bound by this strategy but will be expected to follow the broad principles laid down for the principal papers. The principles are not intended to curtail exploratory analysis or to prohibit sensible statistical and reporting practices, but they are intended to establish the strategy that will be followed, as closely as possible, when analysing and reporting the trial. Reference was made to the published trial protocol [13], ICH Guidance on Statistical Princi-ples for Clinical Trials (E9) [12], CPMP points to con-sider on multiplicity [26], and CONSORT guidelines for the reporting of harms [27] and for non-pharmacological treatment trials [28].
Analysis strategy group The Statistical Analysis Strat-egy was developed by the PACE Analysis StratStrat-egy Group whose members were:
– Michael Sharpe (Chair, Principal Investigator)
– Rebecca Walwyn, Laura Potts, Tony Johnson and Kim Goldsmith (Statisticians)
– Paul McCrone (Health Economist)
– Peter White and Trudie Chalder (Principal Investigators)
– Julia DeCesare and Hannah Baber (Trial Managers)
ConventionThroughout this Statistical Analysis Strategy the four individual randomised interventions are referred to as APT (adaptive pacing therapyplusstandardised spe-cialist medical care), CBT (cognitive behaviour therapy
plus standardised specialist medical care), GET (graded exercise therapyplusstandardised specialist medical care), and SSMC (standardised specialist medical carealone).
Unless stated otherwise‘intervention’refers to the four randomised interventions (group), and‘therapy’refers to APT, CBT, or GET. ‘Treatment’ is used more generally and embraces all forms including drugs.
The anchoring date for visits and assessments is random-isation; thus 24 weeks refers to 24 weeks from randomisation.
Trial design and objectives
Study objectives The PACE trial aims to answer the questions set out below under primary objectives, sec-ondary objectives, and health economics objectives.
Primary objectives:
1. Is APT more effective than SSMC in reducing (i) fatigue or (ii) disability up to 52 weeks from randomisation?
2. Is CBT more effective than SSMC in reducing (i) fatigue or (ii) disability up to 52 weeks from randomisation?
3. Is GET more effective than SSMC in reducing (i) fatigue or (ii) disability up to 52 weeks from randomisation?
4. Is CBT more effective than APT in reducing (i) fatigue or (ii) disability up to 52 weeks from randomisation?
5. Is GET more effective than APT in reducing (i) fatigue or (ii) disability up to 52 weeks from randomisation?
Secondary objectives:
1. Is the pattern of results relating to the primary objectives replicated with the outcome as the participants’self-rated clinical global impression change rating?
2. Do different interventions have differential effects on the two primary outcomes (that is, fatigue versus disability)?
3. Are the differences across interventions in the primary outcomes associated with similar differences in secondary outcomes?
Health economics objectives
The primary health economics objectives are as indi-cated below:
2. To assess the relative effectiveness and cost-utility of APT, CBT, GET, and SSMC (with costs based on health, social care, and informal care) up to 52 weeks.
The secondary health economics objectives are as indi-cated below:
1. To compare care costs (including the costs falling to health service agencies, other agencies and also those borne by patients and their carers) and lost-employment costs between randomisation and 24 weeks for (i) CBT versus APT; (ii) GET versus APT; (iii) SSMC versus APT; (iv) CBT versus SSMC; (v) GET versus SSMC; and (vi) CBT ver-sus GET.
2. To assess the relative effectiveness and cost-utility of APT, CBT, GET, and SSMC (with costs based on health, social care, and informal care) up to 24 weeks.
3. To describe the annual healthcare and societal costs at baseline and their association with clinical and demographic characteristics. 4. To describe and compare patterns of service
utilisation up to 24 weeks and up to 52 weeks across the four interventions.
5. To identify patient characteristics which predict service costs for each intervention.
6. To identify patient characteristics which predict cost-effectiveness/cost-utility up to 24 weeks, and up to 52 weeks for each intervention.
Health economic hypotheses
The primary hypotheses are:
1. Health and other service costs do not differ between APT, CBT, and GET up to 24 weeks, and up to 52 weeks, but are all higher than the costs for SSMC.
2. Total (health and societal) costs up to 24 weeks, and up to 52 weeks, are highest for SSMC, followed by APT, and with no substantial difference between CBT and GET.
3. APT has better cost-effectiveness and cost-utility than SSMC up to 24 weeks, and up to 52 weeks. 4. Both CBT and GET have better cost-effectiveness
and cost-utility than SSMC and APT up to 24 weeks, and up to 52 weeks, but their cost-effectiveness does not differ substantially.
The secondary hypotheses are:
1. Higher healthcare costs are associated with being female, being older and having comorbid conditions,
particularly mood disorders and having other symptom-based diagnoses.
2. Higher total societal costs are associated with being male, being younger, having more severe physical disability, pervasive passivity (measured by actigraphy), certain illness beliefs, and having comorbid conditions, particularly mood disorders and having other symptom-based diagnoses.
Outcome measuresThe primary outcome measures will be:
1. Fatigue Chalder Fatigue Questionnaire (CFQ) (Likert scoring) [29].
2. Physical Disability SF-36 physical function (SF-36PF sub-scale, Version 2) [30].
Secondary outcome measures include safety outcomes, efficacy outcomes and health economics outcomes.
Safety outcomes are:
1. Serious deterioration (primary) defined as one or more of the following up to 52 weeks:
a. SF-36 physical function score diminishing by 20 or more points between baseline and any two consecutive assessment interviews.
b. Participant-rated CGI change score of“much worse”or“very much worse”at two consecutive assessment interviews.
c. Withdrawal from therapy (APT, CBT, or GET) later than 8 weeks due to participant’s reported worsening of their condition.
d. A serious adverse reaction.
2. Serious adverse events (includes serious adverse reactions and suspected unexpected serious adverse reactions).
3. Serious adverse reactions (includes suspected unexpected serious adverse reactions).
4. Non-serious adverse events (includes non-serious ad-verse reactions); numbers, proportions, and examples. 5. Withdrawals from the interventions.
The four components of ‘serious deterioration’ will be reported in addition to the composite outcome.
Efficacy outcomes are:
1. Participant rated Clinical Global Impression (CGI) [31] change category.
2. Anxiety measured by HADS-A subscale of the Hos-pital Anxiety and Depression Scale [32].
4. Six-Minute Walking Test [33].
5. Work and Social Adjustment measured by WSAS [34]. 6. Participant Satisfaction (7-point item from very satisfied
to very dissatisfied).
7. Centers for Diseases Control (CDC) Symptoms -Number of symptoms [35].
8. Jenkins sleep score [36].
A selection of the above efficacy outcomes will be reported in the primary paper as required to aid in-terpretation of the primary outcomes; other second-ary outcomes will be reported in subsequent papers. The selection will, in part, be determined by space constraints.
Health economics outcomes are:
1. CSRI (service, societal, NHS and insurance/benefits costs) [37].
2. EuroQol [38].
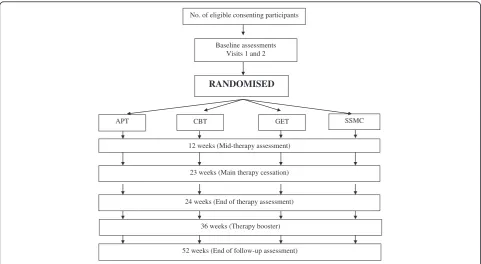
Trial designFigure 1 gives an overview of the trial design.
Basic design (including sample size)
Date of First Randomisation: 18 March 2005 Date of Last Randomisation: 28 November 2008 Target for Randomisation: 600
Number Randomised: 641
Eligibility criteria:
1. Written informed consent from the participant 2. Clinical diagnosis of CFS based on Oxford research
diagnostic criteria
3. Therapy needs make participation appropriate 4. Aged 18 years or over
5. Adequate level of English comprehension 6. Chalder Fatigue bimodal score of 6 or more 7. SF-36 physical function subscale score of 65 or less 8. No psychiatric exclusions listed in the Oxford
research diagnostic criteria
9. Able to attend for therapy and research assessments 10. No contraindications to any of the trial interventions 11. No previous trial therapy at a PACE centre
Randomised interventions(all manuals are available from www.pacetrial.org):
1. Adaptive pacing therapy + standardised specialist medical care (APT).
APT is based on the illness model of CFS/ME as a currently undetermined organic disease, with the assumption that APT can improve quality of life while not affecting the core disease other than providing the best conditions for natural recovery. APT is essentially an energy management approach, which involves assessment of the link between
No. of eligible consenting participants
RANDOMISED
APT SSMC
12 weeks (Mid-therapy assessment)
CBT GET
Baseline assessments Visits 1 and 2
23 weeks (Main therapy cessation)
24 weeks (End of therapy assessment)
[image:5.595.57.539.454.718.2]52 weeks (End of follow-up assessment) 36 weeks (Therapy booster)
activity and subsequent symptoms and disability, using a daily diary, with advice to plan and pace activity to avoid exacerbations.
2. Cognitive behavioural therapy + standardised specialist medical care (CBT).
CBT is based on the illness model of fear avoidance, used in the three previous trials of CBT [39-41]. There are three essential elements: (a) assessment of illness beliefs and coping strategies; (b) structuring of daily rest, sleep, and activity, with a graduated return to normal activity; and (c) collaborative challenging of unhelpful beliefs about symptoms and activity.
3. Graded exercise therapy + standardised specialist medical care (GET).
GET is based on the illness model of
deconditioning and exercise intolerance, used in the previous trials [42,43]. Therapy involves an assessment of physical capacity, negotiation of an individually designed home exercise programme with set target heart rates and times, and participant feedback with mutual planning of the next fortnight’s exercise programme.
4. Standardised specialist medical care alone (SSMC). SSMC is given to all participants and includes visits to the clinic doctor with general, but not specific advice, regarding activity and rest management, such as advice to avoid the extremes of exercise and rest, as well as symptomatic pharmacotherapy. SSMC is standardised in the SSMC Doctor’s Manual. SSMC participants, like all other participants, will already have received the patient clinic leaflet (PCL). There will be no additional therapist involvement, and, in particular, there will be no diary monitoring with consequent advice.
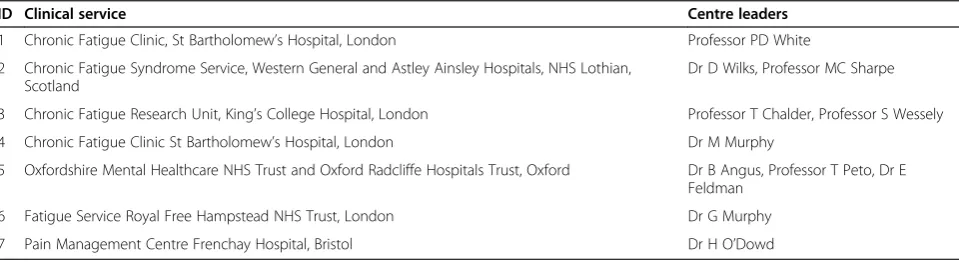
Participating centres:
Table 1 gives the details of the participating centres, including their IDs.
Sample size calculation taken from the protocol (v5.2)
The following is quoted from the PACE trial protocol (v5.2) (see also [13]) and describes sample size estimation based on percentages responding to the trial interventions. The primary outcomes were changed subsequently to measures on continuous scales.
At one year we assume that 60% will respond with CBT, 50% with GET, 25% with APT, and 10% with SSMC. The existing evidence suggests that at one-year follow-up, 50 to 63% of participants with CFS/ME had a positive outcome, by intention to treat, in the three RCTs of rehabilitative CBT [39-41] with 69% improved after an educational rehabilitation that closely resem-bled CBT [44]. This compares with 18 to 63% improved in the two RCTs of GET [42,43] and 47% improvement in a clinical audit of GET [45]. For usual medical care 6 to 17% improved by one year in two RCTs [40,41]. There are no previous RCTs of APT to guide us, but we estimate that APT will be at least as effective as the control therapy of relaxation and flexibility used in previous RCTs, with 26 to 27% improved on primary outcomes [39,43].
[image:6.595.58.538.595.726.2]Our planned intention to treat analyses will compare APT against SSMC alone, and both CBT and GET against APT. Assuming α= 5% and a power of 90%, we require a minimum of 135 participants in the SSMC alone and APT groups, 80 participants in the GET group and 40 in the CBT group [46]. However these last two numbers are insufficient to study predictors, process, or cost-effectiveness. We will have low statistical power to detect the difference between CBT and GET, though our estimates will be useful in planning future trials. As an example, to detect a difference in responder rates of 50 and 60%, with 90% power, would require 520 partici-pants per group; numbers beyond a realistic two-arm trial. Therefore, we will study equal numbers of 135 par-ticipants in each of the four arms, which gives us greater than 90% power to study differences in efficacy between APT and both CBT and GET. We will adjust our num-bers for dropouts, at the same time as designing the trial
Table 1 Details of participating centres
ID Clinical service Centre leaders
1 Chronic Fatigue Clinic, St Bartholomew’s Hospital, London Professor PD White
2 Chronic Fatigue Syndrome Service, Western General and Astley Ainsley Hospitals, NHS Lothian, Scotland
Dr D Wilks, Professor MC Sharpe
3 Chronic Fatigue Research Unit, King’s College Hospital, London Professor T Chalder, Professor S Wessely
4 Chronic Fatigue Clinic St Bartholomew’s Hospital, London Dr M Murphy
5 Oxfordshire Mental Healthcare NHS Trust and Oxford Radcliffe Hospitals Trust, Oxford Dr B Angus, Professor T Peto, Dr E Feldman
6 Fatigue Service Royal Free Hampstead NHS Trust, London Dr G Murphy
7 Pain Management Centre Frenchay Hospital, Bristol Dr H O’Dowd
and its management to minimise dropouts. Dropout rates were 12 and 33% in the two studies of GET [42,43] and 3, 10, and 40% in the three studies of re-habilitative CBT [39-41]. On the basis of our own pre-vious trials we estimate a dropout rate of 10%. We therefore require approximately 150 participants in each intervention group, or 600 participants in all. Cal-culation of the sample size required to detect economic differences between intervention groups requires data on cost per change in outcome, which are not currently available.
Stratification at randomisation Allocation of interven-tions to participants was by minimisation with a random component [47] and four stratification factors:
Centre (6 strata): 1 and 4, 2, 3, 5, 6, 7 CDC Criteria (2 strata): Met or unmet London Criteria (2 strata): Met or unmet
Current Depressive Disorder (2 strata): Present or absent Participants found to be incorrectly stratified will be kept in their original strata for the primary analysis in accordance with the principle of intention-to-treat (ITT) [48]. The extent of incorrect stratification will be reported.
Data collection
Screening measures A clinic patient log book was kept of all new CFS/ME referrals to trial centres to facilitate monitoring of recruitment to the trial. Screening infor-mation will not be used in the analysis except for:
1. Reasons for patients not taking part in the trial (see Participant Flow).
2. Chalder Fatigue Questionnaire and SF-36 Physical Functioning subscale scores where these are not available at baseline (see Method for Handling Dropouts and Missing Data).
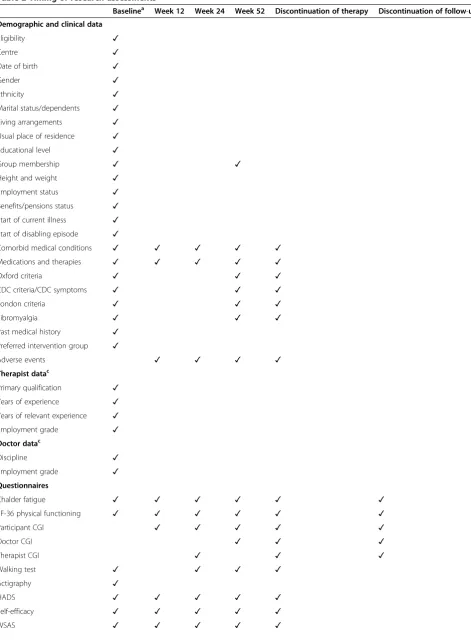
Baseline and outcome measures The information col-lected at baseline and follow-up is presented in Table 2.
In addition, details were recorded for i) training ses-sions, ii) therapist competency, iii) quality control checks of therapy sessions, and iv) homework compliance as-sessments that were made after every therapy session and that will be summarized as part of the general de-scription of intended intervention policies.
Primary and secondary outcome variables will be de-rived from the follow-up data at each relevant time-point as follows.
Primary outcomes:
i) Fatigue total score (Likert scoring, higher scores indicate more fatigue).
ii)Physical disability total score (sum of 10 items multiplied by 5, lower scores indicate more disability).
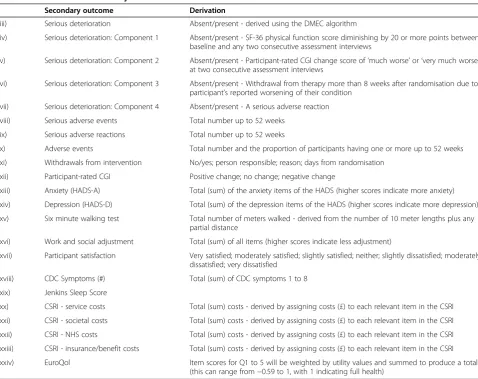
Secondary outcomes are presented in Table 3.
Trial periods (recruitment and follow-up) Recruit-ment was initially intended to be ongoing for 36 months, with three centres recruiting during the first 12 months, six centres recruiting during the subsequent 24 months, and three centres recruiting at twice the annual rate dur-ing the last 12 months. Due to a funddur-ing extension, a seventh centre (Bristol) was added and recruitment was ongoing for 45 months.
SSMC is ongoing over 52 weeks; therapy in APT, CBT and GET is ongoing for the first 23 weeks with one booster session between 36 and 52 weeks. Participants are followed up at 12, 24, and 52 weeks.
Research visit window definitions Screening data are collected prior to baseline visit 1; baseline data are col-lected prior to randomisation. Baseline visit 2 is at least one week after baseline visit 1. Baseline CFQ and SF-36PF should be collected within one month prior to randomisation. Follow-up data should be collected within one week of the expected date where possible. Week 52 follow-up data can be collected at any time after week 52 with no specified upper time limit other than the end of 52 week data collection for the trial (31 January 2010).
When research visits fall outside of the guidance window, they will be analysed according to the most appropriate time point. Specifically, planned visits taking place up to 18 weeks will be used for the 12-week data, while the closest planned visit will be used for the 24- and 52-week data. If a planned visit data is missing, previous unscheduled visit data can be used instead.
Visit windows will be summarised to indicate whether their distribution is similar across interventions; the use of unscheduled visits will also be summarised.
Where variation in visit times is large, or the average visit time differs across interventions, time will be fitted as a continuous instead of a categorical variable. This decision will be made by a consensus judgement of the authors.
General considerations
Table 2 Timing of research assessments
Baselinea Week 12 Week 24 Week 52 Discontinuation of therapy Discontinuation of follow-up
Demographic and clinical data
Eligibility ✓
Centre ✓
Date of birth ✓
Gender ✓
Ethnicity ✓
Marital status/dependents ✓
Living arrangements ✓
Usual place of residence ✓
Educational level ✓
Group membership ✓ ✓
Height and weight ✓
Employment status ✓
Benefits/pensions status ✓
Start of current illness ✓
Start of disabling episode ✓
Comorbid medical conditions ✓ ✓ ✓ ✓ ✓
Medications and therapies ✓ ✓ ✓ ✓ ✓
Oxford criteria ✓ ✓ ✓
CDC criteria/CDC symptoms ✓ ✓ ✓
London criteria ✓ ✓ ✓
Fibromyalgia ✓ ✓ ✓
Past medical history ✓
Preferred intervention group ✓
Adverse events ✓ ✓ ✓ ✓
Therapist datac
Primary qualification ✓
Years of experience ✓
Years of relevant experience ✓
Employment grade ✓
Doctor datac
Discipline ✓
Employment grade ✓
Questionnaires
Chalder fatigue ✓ ✓ ✓ ✓ ✓ ✓
SF-36 physical functioning ✓ ✓ ✓ ✓ ✓ ✓
Participant CGI ✓ ✓ ✓ ✓ ✓
Doctor CGI ✓ ✓ ✓
Therapist CGI ✓ ✓ ✓
Walking test ✓ ✓ ✓ ✓
Actigraphy ✓
HADS ✓ ✓ ✓ ✓ ✓
Self-efficacy ✓ ✓ ✓ ✓ ✓
Table 2 Timing of research assessments(Continued)
SIQb ✓ ✓ ✓ ✓
PHQ-15 ✓ ✓ ✓ ✓ ✓
Exercise and activity ✓ ✓ ✓ ✓ ✓
Jenkins Sleep Scale ✓ ✓ ✓ ✓ ✓
Step test ✓ ✓ ✓ ✓ ✓
Borg Scale ✓ ✓ ✓ ✓ ✓
Participant satisfaction ✓ ✓
SSMC/therapy adherence ✓ ✓ ✓ ✓
EQ-5D ✓ ✓ ✓ ✓
CSRI ✓ ✓ ✓ ✓
a
Baseline was conducted over two research visits prior to randomisation;b
The SIQ is now known as the Cognitive and Behavioural Questionnaire;c
[image:9.595.57.536.337.716.2]The therapist and doctor data will be kept separate from the trial database and summarised by the Trial Manager (see Baseline Comparability of Randomised Groups); Note: CDC, Centers for Disease Control; CGI, clinical global impression; CSRI, client service receipt inventory; EQ-5D, Euroqol 5 dimensions; HADS, hospital anxiety and de-pression scale; PHQ15, physical health questionnaire 15; SF-36, short-form 36; SIQ, symptoms interpretation questionnaire; SSMC, standardised specialist medical care; WSAS, work and social adjustment scale.
Table 3 Derivation of secondary outcomes
Secondary outcome Derivation
iii) Serious deterioration Absent/present - derived using the DMEC algorithm
iv) Serious deterioration: Component 1 Absent/present - SF-36 physical function score diminishing by 20 or more points between baseline and any two consecutive assessment interviews
v) Serious deterioration: Component 2 Absent/present - Participant-rated CGI change score of‘much worse’or‘very much worse’ at two consecutive assessment interviews
vi) Serious deterioration: Component 3 Absent/present - Withdrawal from therapy more than 8 weeks after randomisation due to participant’s reported worsening of their condition
vii) Serious deterioration: Component 4 Absent/present - A serious adverse reaction
viii) Serious adverse events Total number up to 52 weeks
ix) Serious adverse reactions Total number up to 52 weeks
x) Adverse events Total number and the proportion of participants having one or more up to 52 weeks
xi) Withdrawals from intervention No/yes; person responsible; reason; days from randomisation
xii) Participant-rated CGI Positive change; no change; negative change
xiii) Anxiety (HADS-A) Total (sum) of the anxiety items of the HADS (higher scores indicate more anxiety)
xiv) Depression (HADS-D) Total (sum) of the depression items of the HADS (higher scores indicate more depression)
xv) Six minute walking test Total number of meters walked - derived from the number of 10 meter lengths plus any partial distance
xvi) Work and social adjustment Total (sum) of all items (higher scores indicate less adjustment)
xvii) Participant satisfaction Very satisfied; moderately satisfied; slightly satisfied; neither; slightly dissatisfied; moderately dissatisfied; very dissatisfied
xviii) CDC Symptoms (#) Total (sum) of CDC symptoms 1 to 8
xix) Jenkins Sleep Score
xx) CSRI - service costs Total (sum) costs - derived by assigning costs (£) to each relevant item in the CSRI
xxi) CSRI - societal costs Total (sum) costs - derived by assigning costs (£) to each relevant item in the CSRI
xxii) CSRI - NHS costs Total (sum) costs - derived by assigning costs (£) to each relevant item in the CSRI
xxiii) CSRI - insurance/benefit costs Total (sum) costs - derived by assigning costs (£) to each relevant item in the CSRI
xxiv) EuroQol Item scores for Q1 to 5 will be weighted by utility values and summed to produce a total
(this can range from−0.59 to 1, with 1 indicating full health)
sessions of the Data Monitoring Committee. Conse-quently, both DMC and TSC were blind to intervention group, as were the trial statisticians. Data cleaning will be performed as blind to intervention allocation as pos-sible. Decisions made during analysis concerning data or additional analyses will be documented.
Trial samples Numbers (and percentages) of partici-pants satisfying the following definitions will be reported overall and by intervention.
Intention-to-treat sample The intention-to-treat (ITT) sample is defined as all participants who were rando-mised into the trial included in the intervention to which they were randomised, regardless of the presence or absence of follow-up data. Participants will be in-cluded in the stratum in which they were randomised.
Available-case sample The available case sample is de-fined as all participants who were randomised into the trial, who have any outcome data available for analysis, included in the stratum and intervention to which they were randomised. This sample will be a subset of the ITT sample, excluding randomised participants who have no outcome data.
Per-protocol sample The per-protocol sample is de-fined as all participants who were randomised into the trial, who met trial eligibility criteria, and who followed their randomised intervention policy at the centre in which they were randomised; they will be included in the intervention to which they were randomised and with their correct stratum. This sample will be a sub-set of the ITT sample, excluding randomised partici-pants who (i) are confirmed not to have met trial eligibility criteria at randomisation, and (ii) departed from their randomised intervention policy at any point up to 52 weeks.
As-treated sampleThe as-treated sample is defined for the health economic analyses as all participants who were randomised into the trial and received one of the trial interventions. This sample will be a subset of the ITT sample, excluding participants who have not re-ceived any of the four interventions. Participants will be assigned to their received therapy rather than to their randomised intervention if these disagree.
Safety sample The safety sample is the ITT sample for this trial.
Other samples
1. The sample screened for eligibility is defined as all consecutive new outpatients referred to PACE
recruiting centres with a possible or definite clinical diagnosis of CFS/ME between 12 October 2004 and 14 November 2008.
2. The sample assessed for eligibility is defined as all patients consenting to formal eligibility assessment by the research workers.
3. The therapist sample includes all the therapists who were assessed for their competency in delivering trial therapies.
4. The doctor sample includes all the doctors signed up to deliver trial interventions.
5. The research worker sample includes all research assistants or research nurses collecting PACE trial data.
Adherence to the protocol
Blinding of randomised interventions The members of the Data Monitoring Committee, Trial Steering Com-mittee and the trial statisticians were blinded to inter-vention allocation. Participants and all other research and therapy staff were not blinded, since it was impos-sible to do so. The steps taken to minimise and measure bias were:
1. Primary outcomes were self-rated by the participant. 2. Outcome assessments were coordinated by research
workers not directly involved in the interventions participants received.
3. Equipoise was actively encouraged throughout the planning and course of the trial.
4. Baseline staff expectations regarding the outcome of the trial were recorded.
5. Participant intervention preferences and expectations regarding the outcome of their intervention were recorded.
Departure from intended therapy (APT, CBT, GET)
Departures from randomised intervention policy The overall definition of departures from the randomised inter-vention policy is given in terms of session attendance as:
a. Fewer than three sessions of SSMC (participants allocated SSMC only)
b. Fewer than ten sessions of APT, CBT or GET (participants allocated these therapies)
The number of sessions includes both face-to-face ses-sions and those conducted over the telephone. Within this definition, formal withdrawal from intervention after three sessions of SSMC or ten sessions of APT, CBT, or GET have been completed will not be regarded as a departure from the randomised intervention policy. However any participant withdrawing from his or her randomised inter-vention, or initiating another trial therapy prior to the above cut-offs would be regarded as a departure from the randomised intervention (it will be noted when this was by mutual consent). This includes participants randomised to SSMC who, in fact, receive APT, CBT or GET as a trial therapy. The overall compliance variable will therefore be binary separating those who followed their randomised intervention policy from those who did not.
The average (and range) of the numbers of therapy and SSMC sessions attended will be reported by intervention.
Withdrawals from intervention The decision to with-draw a participant from an intervention is made by the clinician or the participant (active withdrawals).
The number of active withdrawals (broken down by initiator (participant, clinical staff, both)) will be re-ported by intervention and centre, and by interval from randomisation. The most common reasons for with-drawal will be summarised.
Withdrawals from the trial and losses to follow-up
The decision to withdraw a participant from follow-up within the trial is made only when the participant with-draws their consent to research follow-up. All reasonable attempts are made to continue to follow up all partici-pants, including those that withdraw from intervention.
For the purposes of analysis, losses to follow-up are those missing all primary outcome scale data at all follow-up assessments, those missing all primary out-come scale data at weeks 24 and 52, or those missing all primary outcome scale data at week 52.
The numbers of withdrawals and losses to follow-up will be reported (see Comparisons of Losses to Follow-Up).
Statistical considerations
Stratification in the analysis The primary analysis of therapy effect will be adjusted by the factors used for strati-fication at randomisation (that is, centre, CDC criteria,
London criteria and current depressive disorder) [12,49] and by the baseline assessment of the outcome variable.
Method for handling centre effects The PACE trial was designed with variation in participant outcomes be-tween centres rather than bebe-tween doctors or therapists in mind. For the primary analysis to be consistent with the trial design, the primary method for handling con-textual variation in the analysis of therapy effects will be to include centre as a fixed covariate. The centre that randomises the largest number of participants will be the reference category. The centre assigned to each par-ticipant will be based on the parpar-ticipant’s centre at ran-domisation. Consideration will also be given to including centre as a random effect [50].
Method for handling other clustering effectsOutcomes at weeks 12, 24 and 52 are nested within participants. The primary method for handling clustering associated with repeated measurements will be to fit a cluster-specific random effects model [51-53] including the par-ticipant as a random intercept, and investigating the addition of a random slope over time. Where therapy fects cannot be interpreted as population-averaged ef-fects because outcomes are binary, a population-average (GEE) model will also be fitted.
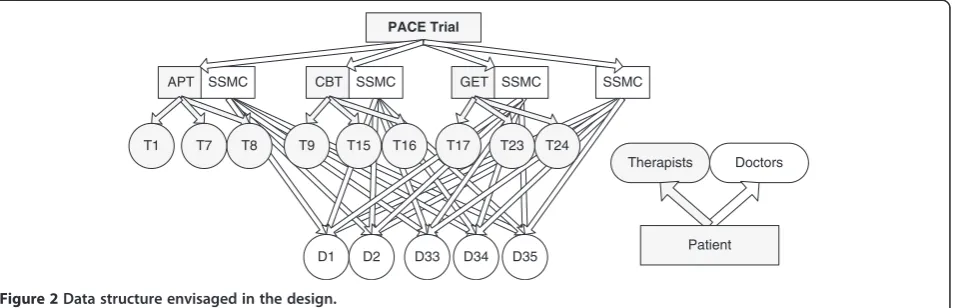
Due to (i) the nesting of participants within therapists and doctors; (ii) the partial nesting of therapists within APT, CBT, and GET as there was no therapist involvement in SSMC; and (iii) the crossing of doctors with interven-tions, variation in participant outcomes between therapists, and in intervention effects between SSMC doctors, are recognised to be potential sources of clustering in this trial [54]. The data structure envisaged in the design (Figure 2) differs from that observed in practice due to a number of planned deviations resulting from unavoidable therapist absences (section 8.6 of Protocol v5.2). To summarise:
a. Local centre cover delivered by a PACE therapist of the same discipline working in a nearby centre will mean that some therapists will be crossed with centres. b. Distant therapy delivered by a PACE therapist of the
same discipline means that participants will not always be seen by a single therapist.
c. Cross-cover therapy delivered by a PACE therapist of a different discipline means that participants will not always be seen by a single therapist and some therapists may be crossed with the therapies. d. Recruitment of a replacement therapist means that
more than one therapist per centre may deliver each therapy.
These deviations are anticipated to affect less than 10% of the trial participants. We will initially assume in-dependence of outcomes within therapists/doctors in the primary analysis. Two further analyses are planned, using two-level heteroscedastic models assuming a fully nested design [54], with clusters based on i) the main care provider and ii) the pair comprising the main ther-apist and the main doctor to assess the robustness of the model to the assumption of independence.
If no clustering is found in (i) supporting the conclu-sions of the primary analysis, then (ii) will not be per-formed. The ‘main care provider’ is defined as the therapist or doctor providing the largest number of trial therapy sessions for each participant. As such, the main care provider is likely to be a therapist for APT, CBT, and GET and a doctor for SSMC. To be explicit, if the doctor provides more sessions than the therapist in APT, CBT or GET then the doctor is the main care provider (see Depar-tures from Randomised Intervention Policy). If there is a tie in number of sessions delivered by two care providers the main care provider will be the one who delivered the earlier sessions.
In summary, three analyses are planned: 1) without ac-counting for therapist effect/clustering, 2) acac-counting for main care provider, and 3) accounting for both the main therapist and main doctor for each participant. The third will not be done if the second shows no clus-tering effects.
An analysis accounting for the effect of clustering on secondary outcomes will be considered.
Any differences in the point estimates, confidence inter-vals (CIs) or conclusions will be reported. Any problems encountered in fitting these models will be reported and the scope of the analyses will be restricted; the weights used within the multiple membership model [55] will be determined by the proportion of participants treated by each therapist/doctor.
Additional models to explore or take account of complex clustering effects may also be fitted; if so, the
motivation for these will be reported together with their results.
Method for handling dropouts and missing data Data are missing completely at random (MCAR) when they represent a simple random sample of the complete sam-ple and the missing data mechanism is independent of all observed and unobserved variables. The assumption that data are missing at random (MAR) is reasonable when missing data represent an identifiable stratified sam-ple of the comsam-plete samsam-ple and the missing data mechan-ism is dependent only on other known and observed variables. Data are missing not at random (MNAR) where missing data represent an unidentifiable stratified sample of the complete sample and the missing data mechanism depends on measured and unmeasured variables. The model describing the missing data mechanism will take any clustering effects into consideration. The planned strategy for handling missing data at the item [56] and scale [57] levels will depend on whether the amount of item-missing data observed is minimal. Within practical constraints it will be assumed that data are missing at ran-dom (MAR) conditional on the variables included in the substantive model.
Missing item data To ensure the same strategy is followed across all scales reported in the principal paper (s) any guidance given by authors of validated question-naires will be superseded by the strategy outlined here. Where item-missing data are considered minimal (de-fined here as no more than 10% of participants with any missing item data across visits where collected or where no more than 20% of the items within a scale are miss-ing within participants), proratmiss-ing (that is, mean imput-ation across items within a scale, or subscale where scales are formed of subscales, for each visit and partici-pant) [56] will be used. The focus will instead be on handling scale-missing data. Any bias or underestima-tion of variance of scores associated with prorating is PACE Trial
APT
D34
D33 D35
T1
D1 D2
SSMC CBT SSMC GET SSMC SSMC
T8
T7 T9 T15 T16 T17 T23 T24
Therapists Doctors
[image:12.595.63.541.90.244.2]Patient
anticipated to be negligible where item-missing data are minimal [56]. We will report the amount of missing item data by the percentage of participants who have more than 10% item missing data for each scale reported.
The amount of item-missing data is expected to be minimal. However, if this is not so for any outcome scale then multiple imputation [58,59] at the item-level will be the primary method used. Items will be imputed 100 times [60] separately for each scale (with the exception of the CFQ and SF-36PF, which will be imputed simul-taneously). All of the other items for that scale across all time points (including baseline), scores (overall and any subscales) across all time points (including baseline), the four stratification factors at randomisation, randomised intervention, main therapist, and main SSMC doctor will be included in the imputation model.
Missing scale data Missing baseline scale data are not an issue for the primary analysis of efficacy; no missing data are expected for the stratification factors. Where the CFQ or SF-36PF is missing at baseline they will be replaced by the relevant scale at screening. There is spe-cific guidance for missing baseline scale data, and this will be followed [61]. That is, we will use mean imput-ation of baseline variables assuming baseline and out-come are correlated less than 0.6.
Where the amount of item-missing data is considered minimal, missing outcome scale-data will be handled within the primary analysis by maximum likelihood [57,62] under a similar model for the missing data mechanism assumed for missing item data (see section above). We will report the amount of missing scale data by the percentage of participants who have more than 10% missing item data for each scale reported.
Loss to follow-upSome participants will withdraw from follow-up during the trial, and for these it may be more appropriate to assume data are missing not at random (MNAR). Where more than 10% of randomised partici-pants are lost to follow-up, the impact of this will be in-vestigated in a sensitivity analysis using the weighting approach described by Carpenter, Kenward and White [63] if multiple imputation is the primary method, or comparing selection model and pattern-mixture model therapy effect estimates [64] where maximum likelihood is the primary method.
Method for handling multiple comparisons and multiplicity The overall probability of falsely claiming a statistically significant result increases when multiple significance tests (or equally CIs) are interpreted simul-taneously. Multiplicity considerations arise in this trial from the presence of (i) multiple outcomes, (ii) multiple intervention comparisons, and (iii) multiple analyses.
The strategy for adjusting, presenting and interpreting the results is set out below.
Multiplicity adjustments will be made as follows:
1. The following five comparisons will be made using two-sided hypothesis tests (alpha = 0.05) at 52 weeks: APT versus SSMC, CBT versus SSMC, GET versus SSMC, CBT versus APT, GET versus APT.
For the co-primary outcomes, fatigue and disability, and for the secondary outcome, the participant-rated CGI,P-values will be presented unadjusted for multiplicity.
2. In addition Bonferroni adjustment (0.05/5) will be applied separately to each of the three outcomes to control the outcome-wise type I error rate at 5%. 3. No adjustment will be made for any sensitivity
analysis as their purpose is to increase confidence in the results obtained from the analysis nominated as primary [26].
4. No adjustment will be made within the principal paper(s) for other analyses including those for safety, secondary outcomes (except the CGI) [26], and health economics.
Presentation will occur as follows:
1. All analyses undertaken will be reported as far as practical (regardless of statistical significance) [65]. 2. Estimated effects will be presented with unadjusted
2-sided 95% CIs andP-values.
3. P-values adjusted for multiplicity will also be presented and explained.
Interpretation will be done as indicated below:
1. Marginal interpretation of the results will be of primary interest and will be based on the size and precision of the observed differences between interventions with reference to point estimates and unadjusted 95% CIs.
2. Intervention recommendations will also take into consideration the consistency of effects
a. across any supportive intervention contrasts, b. across sensitivity analyses, primary outcomes and
time points,
c. across efficacy, safety and cost analyses, and d. with the results of previous studies, and clinical and
consumer opinions.
to which intervention effect estimates reflect the effects of the intervention described in the protocol requires ana-lyses focusing on the effects of the interventions received rather than the interventions prescribed. It is recognised that per-protocol analyses have a number of limitations, most importantly, selection biases resulting from partici-pants who are excluded not being a simple random sam-ple of those randomised. As such, discrepancies between the conclusions of an intention-to-treat analysis and a per-protocol analysis may not reflect discrepancies between the effects of the intervention prescribed and the interven-tion received. Acknowledging these and other limitainterven-tions, a per-protocol analysis will serve as the primary sensitivity analysis investigating the robustness of the conclusions of the primary analysis to assumptions about departures from the randomised intervention policies.
Descriptive analyses
Description of available dataThe patterns of availabil-ity of baseline and follow-up data will be summarised overall and separately for the four interventions and for each assessment visit at the scale level. If one or more case report forms (CRFs) are available for a particular visit then the visit will be regarded as available. If one or more (non-administrative) items are available then the scale will be regarded as available. Availability of baseline and follow-up data will be summarised with differenti-ation of fully, or partially completed measures from those completely missing, or with sketchy detail.
The timing of baseline and follow-up data will be sum-marised overall and by intervention for each assessment visit in terms of the median (lower quartile, upper quar-tile, minimum and maximum) number of days from ran-domisation and the proportion falling outside guideline timeframes. Histograms of distributions will also be ex-amined. Where assessments for a particular visit are car-ried out on more than one date, the timing of CFQ and SF-36PF assessments will be used to summarise visit timing. The extent to which visits are carried out on more than one date will be examined together with any further relevant details.
Description of missing data Where available, the rea-sons for missing baseline and follow-up data will be summarised overall and by intervention at the visit and scale levels. This will be done using relevant information included in the comments fields of the database. It is an-ticipated that such information will be available princi-pally for visit and scale missing data.
Where the level of item-missing data is borderline be-tween‘minimal’and‘important’(see Methods for Handling Dropouts and Missing Data), the appropriateness of pro-rating will be evaluated using the checks outlined by Fayers
et al. [56]. Assumptions regarding the nature of the
missing data mechanism (that is, MAR as compared to MCAR and MAR, conditional on the variables included in the substantive model as compared to additional variables) will be evaluated by looking descriptively at the statistical associations between whether or not data is missing and any potential predictors, including those generated by looking at the comments fields or the data.
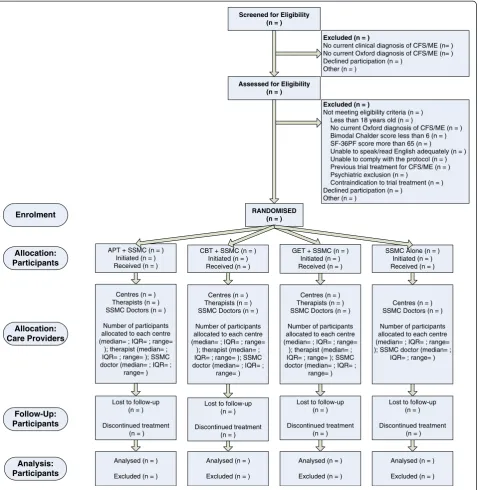
Participant flow Participant throughput will be sum-marised in a CONSORT diagram [28] including the stages of enrolment, allocation, follow-up and analysis (see Figure 3). Where available, similar summary information will also be provided on the flow of therapists and doctors from recruit-ment to analysis [66]. In addition to the median, lower quar-tile, upper quartile minimum and maximum, the arithmetic, harmonic and minimum-variance mean cluster sizes to-gether with the standard deviation will be tabulated by inter-vention as these may be useful for calculating the design effect where cluster sizes are variable in size [67,68].
Any participant attending at least one session of SSMC or at least one session of APT, CBT, or GET will be regarded as having initiated their randomised intervention. The overall definition of departures from randomised intervention policy (see Departures from Randomised Intervention Policy) will be used to define an inadequate randomised intervention.
Representativeness of sample This will be presented within the baseline comparability tables (see Baseline Comparability of Randomised Groups).
Baseline comparability of randomised groupsThe fol-lowing participant-level baseline variables will be sum-marised both overall and between randomised interventions:
i) Oxford criteria met (yes; no)
ii) Centre (Barts, Bristol, Edinburgh, Kings, Oxford, Royal Free)
iii) Diagnostic criteria (neither met; CDC met only; London met only; both met)
iv) Current depressive disorder (present or absent) v) GAD (yes, no)
vi) Agoraphobia (yes, no) vii) Panic disorder (yes, no) viii) Fibromyalgia (met, unmet)
ix) Duration of CFS/ME since start of illness x) Taking hypnotics, analgesics or antidepressants xi) Number of other medications/treatments taken xii) CFQ Score (continuous)
xiii) SF-36PF score
xiv) Age at randomisation (years) (continuous) xv) Age at randomisation (years) (18 to 29; 30 to 39;
xvii) Ethnicity (white; other, unless‘other’can be split further) xviii) Marital status (married and co-habiting, single,
di-vorced/separated/widowed)
xix) Group membership (none; self-help only; national only; both)
xx) Employment status xxi) Health care costs xxii) Social care costs
xxiii) Cost of lost employment
Eyeball comparisons of distributions will be carried out as a measure of the randomisation integrity.
The following therapist-level baseline variables will be summarised overall:
i) Primary professional healthcare qualification ii) Number of calendar years between gaining primary
professional healthcare qualification and start date in PACE
Screened for Eligibility (n = )
Assessed for Eligibility (n = )
Excluded (n = )
No current clinical diagnosis of CFS/ME (n= ) No current Oxford diagnosis of CFS/ME (n= ) Declined participation (n = )
Other (n = )
RANDOMISED (n = )
Excluded (n = )
Not meeting eligibility criteria (n = ) Less than 18 years old (n = )
No current Oxford diagnosis of CFS/ME (n = ) Bimodal Chalder score less than 6 (n = ) SF-36PF score more than 65 (n = )
Unable to speak/read English adequately (n = ) Unable to comply with the protocol (n = ) Previous trial treatment for CFS/ME (n = ) Psychiatric exclusion (n = )
Contraindication to trial treatment (n = ) Declined participation (n = )
Other (n = )
CBT + SSMC (n = ) Initiated (n = ) Received (n = ) APT + SSMC (n = )
Initiated (n = ) Received (n = )
SSMC Alone (n = ) Initiated (n = ) Received (n = ) GET + SSMC (n = )
Initiated (n = ) Received (n = )
Enrolment
Allocation: Participants
Lost to follow-up (n = )
Discontinued treatment (n = )
Lost to follow-up (n = )
Discontinued treatment (n = ) Lost to follow-up
(n = )
Discontinued treatment (n = ) Lost to follow-up
(n = )
Discontinued treatment (n = )
Analysed (n = )
Excluded (n = ) Analysed (n = )
Excluded (n = ) Analysed (n = )
Excluded (n = ) Analysed (n = )
Excluded (n = )
Follow-Up: Participants
Analysis: Participants
Allocation: Care Providers
Centres (n = ) Therapists (n = ) SSMC Doctors (n = )
Number of participants allocated to each centre (median= ; IQR= ; range=
); therapist (median= ; IQR= ; range= ); SSMC doctor (median= ; IQR= ;
range= )
Centres (n = ) Therapists (n = ) SSMC Doctors (n = )
Number of participants allocated to each centre (median= ; IQR= ; range=
); therapist (median= ; IQR= ; range= ); SSMC doctor (median= ; IQR= ;
range= )
Centres (n = ) Therapists (n = ) SSMC Doctors (n = )
Number of participants allocated to each centre (median= ; IQR= ; range=
); therapist (median= ; IQR= ; range= ); SSMC doctor (median= ; IQR= ;
range= )
Centres (n = ) SSMC Doctors (n = )
Number of participants allocated to each centre (median= ; IQR= ; range= ); SSMC doctor (median= ;
[image:15.595.61.541.89.580.2]IQR= ; range= )
iii) Worked in CFS/ME or chronic pain service previously
iv) Employment grade (for health economic analysis)
Doctor variables will be summarised by:
i) Discipline (for example, psychiatrist/physician/GP) ii) Grade (for example, Consultant/SpR/SHO)
Numbers (with percentages) for binary and categorical variables, and ordered categories plus means (and standard deviations), or medians (with lower and upper quartiles) for continuous variables will be presented. No statistical significance tests or CIs will be calculated for differences between randomised interventions on any participant-level baseline variables [69-71]. Differences in therapist-level baseline variables are expected because therapist characteristics are a component of the randomised inter-vention policies.
Median (lower and upper quartile) of number of par-ticipants per therapist will be reported.
Comparison of losses to follow-upLosses to follow-up will be reported at 13, 26, and 52 weeks by intervention and centre. Narrative summaries will be given of the rea-sons when known.
Therapy and other treatment received Summaries will be given of treatment received under the intervention policies; these will include:
i) SSMC and APT/CBT/GET received
a. Median (lower and upper quartile, minimum and maximum) number of SSMC sessions attended b. Median (lower and upper quartile, minimum and
maximum) number of APT/CBT/GET sessions attended
ii) Median (lower and upper quartile, minimum and maximum) of proportion of telephone sessions per participant
iii) Patterns of concomitant medications and treatments received - number (proportion) of participants taking hypnotics, analgesics, antidepressants (all as classified by BNF), non-pharmacological treatments, comple-mentary and alternative medicines, up to 52 weeks.
The number and percentage of those who comply will be reported by randomised intervention within the CON-SORT diagram. In addition, more detailed descriptions will be given by randomised intervention including:
i) Number (percentage) of participants attending (i) fewer than three sessions of SSMC or (ii) fewer than ten sessions of APT, CBT or GET.
ii) Number and percentage of participants initiating a trial therapy other than the one randomised. iii) Number, percentage and details of participants
receiving a trial intervention from (i) more than one therapist/doctor, (ii) a therapist/doctor from a different centre, or (iii) a therapist delivering their second therapy type.
Details of the following will be reported overall and by randomised intervention:
a) Mid-trial modifications to trial interventions and manuals.
b) Partial suspension of randomisation.
Narrative summaries will be given of the reasons for withdrawal when known.
Each primary outcome will be tabulated in a 2 × 4 table by compliance status and randomised intervention.
Unblinding of randomised intervention While this trial is not blinded, due to impracticability, a number of steps were taken to minimise bias arising from this. The apparent success of these steps will be assessed where possible:
1. Extent of any unblinding of the Trial Steering and Data Monitoring Committees or the blinded statisticians will be reported.
2. Extent of primary outcomes data collected over the phone will be reported by randomised intervention. 3. The degree of self-declared expectations of the
trial outcome among the trial team by profes-sional role (that is, SSMC doctor, APT/CBT/GET therapist, therapy leader, centre leader, research staff ) and centre by randomised intervention was collected.
4. Participant preferences will be reported by randomised intervention.
5. Participant expectations of outcome will be reported by randomised intervention.
6. Proportion and type of discrepancies between preferred intervention and randomised intervention will be reported by randomised intervention.
Interim analyses and safety monitoring analyses
No interim analyses were planned or have been carried out.
Analysis of fatigue and disability (co-primary outcomes)
Definition of outcome measure (including trial periods)
The fatigue and physical disability outcomes are continuous scores defined separately at weeks 12, 24, and 52. These are the primary outcomes.
Physical disability will be measured by the continuous scale of the SF36-PF (possible range 0 to 100).
Descriptive statistics for outcome measures The dis-tributions of the Likert Chalder fatigue scores will be presented in frequency histograms both overall and by intervention at each assessment point (baseline, weeks 12, 24, and 52). The distribution of the SF-36 physical function subscale score will also be presented in histograms both overall and by intervention at each as-sessment point. It is anticipated that the distributions of the Likert Chalder fatigue score and the SF-36 physical function subscale score will be approximately normally distributed. Summary statistics (minimum, maximum, mean and standard deviation, median and inter-quartile range) will be tabulated and the response profiles plotted for each continuous score both overall and by intervention at each assessment point. The response profiles over time will also be plotted by outcome and intervention.
The mean scores (Likert Chalder fatigue scores and SF-36 physical function subscale scores) within each main therapist’s caseload will be calculated by therapy (APT, CBT and GET). These means will be plotted to in-vestigate the level of variability in participant outcomes between therapists and to examine the distribution of these summary statistics (that is, whether they are nor-mally distributed or skewed). Differences in the mean scores within each main doctor’s caseload will also be calculated and similar plots based on these presented.
Primary analysis (including method of analysis) The primary analysis addressing primary objectives (1) to (5) and secondary objectives (1) and (3) will be based on the principle of intention-to-treat. If missing data are esti-mated using multiple imputation this analysis will be based on the intention-to-treat sample (see Trial Sam-ples); if missing data are estimated via prorating and maximum likelihood, the analysis will be based on the available-case sample (see Trial Samples) and will ex-clude any participants with no follow-up data in a‘ modi-fied ITT’analysis. The primary outcomes of fatigue and physical disability will be analysed separately using two mixed-effects linear regressions, each including partici-pant as a random intercept and investigating adding a random slope on time. Time (investigating the possibility of linearising across 12, 24 and 52 weeks), the time-by-intervention interaction, baseline CFQ Likert score, baseline SF-36 physical function score and the design factors (that is, centre, CDC criteria, London criteria and current depressive disorder) will be included as fixed effects. Primary interest will be in the fixed contrasts specified in Method for Handling Multiple Comparisons and Multiplicity section at 52 weeks. The statistical models used in the analysis will be reported in full.
Clinical importance of the mean differences in primary outcomes at 52 weeks This will be judged by reference to the trial sample SDs at baseline in this trial supported by estimates from other sources. Spe-cifically, a difference between means of two interven-tion groups, at 52 weeks, of 0.3 SD will be regarded as of minimal clinical importance (a MCID) and of 0.5 SD as a clinically useful difference. From published lit-erature on these scales these differences can be trans-lated into 5 points on the SF-36PF, and 1.2 points on the CFQ, for minimal clinical importance and 8 points on the SF-36PF, and 2.0 points on the CFQ, for clinic-ally useful.
Baseline adjustment By design factors only
Not applicable
By design factors and additional factors
This is the primary analysis.
Model assumption checks The following assumptions will be checked:
1. Independence of residuals will be checked using the supportive analyses described in Method for Handling Other Clustering Effects section. ICC and within-cluster variance estimates will be reported.
2. Distribution of residuals and random effects will be checked visually using Q-Q plots and histo-grams of the residuals and by plotting the between-participant variation in participant out-comes and where appropriate the between-centre, the within-doctor but between-interventions, and the between-therapist variation in participant out-comes. Deviations from a Normal distribution would indicate a violation of model assumptions. In this event an alternative approach to the ana-lysis would be investigated.
3. Equal variance of residuals will be checked visually using plots of the standardised residuals against the predicted values.
4. Absence of an intervention-by-centre interaction will be checked in the primary analysis by including fixed contrasts for the intervention-by-centre interaction.
Other analyses supporting the primary analysisA num-ber of sensitivity analyses will be employed to examine the robustness of the conclusions of the primary analysis to:
1. Categorical responder/improver analysis.
Clinically significant improvement will be taken as a CGI participant score of 1 (very much improved) or 2 (much improved). CGI (P) scores of 3 (a little improved), 4 (no change) and 5 (a little worse) will be considered as non-improvement. CGI (P) scores of 6 (much worse) and 7 (very much worse) will be consid-ered as deterioration. The primary analyses will be re-peated replacing the primary outcomes with the CGI (P) (response versus no response versus deterioration) and using mixed-effects logistic regression.
2. Methods for handling missing data.
The primary analysis will be repeated assuming data are missing not at random (MNAR) as described in Method for Handling Dropouts and Missing Data section.
3. Choice of sample.
A per-protocol analysis will be employed using the per-protocol sample to examine the robustness of the results of the primary analysis to departures from the intended randomised intervention or eligi-bility criteria.
Additional analysesThe CBT versus GET contrast will be reported, recognising its exploratory status.
Secondary objective (2) (Do different interventions have differential effects on primary outcomes?) will be addressed by extracting fixed contrasts for the outcome-type-by-intervention interaction from a bivariate mixed-effects linear regression [51,72-74] fitted with fatigue and physical disability as joint outcomes, participant as a random effect (investigating adding a random slope on time), outcome-type (physical disability versus fatigue), intervention (all contrasts specified), time (investigating linearising this effect across 12, 24 and 52 weeks), the time-by-intervention interaction, the outcome-type-by-intervention interaction, baseline CFQ Likert score, baseline SF-36 physical function score and the design factors (that is, centre, CDC criteria, London criteria and current depressive disorder) as fixed effects. These contrasts directly estimate the differences in the inter-vention effects between the two primary outcomes.
Analysis of secondary outcomes
Efficacy outcomes
Definition of outcome measures (including trial periods) All secondary efficacy outcomes are defined sep-arately at weeks 12, 24 and 52 unless specified otherwise (see Baseline and Outcome Measures). The PACE Scoring Protocol outlines in detail the process for calculating scores
from questionnaire items and variables from case report forms. Participant-, therapist- and SSMC doctor-rated CGI are defined as ordinal variables with three categories. Participant satisfaction is defined as an ordinal variable with seven categories. The anxiety and depression sub-scale scores of the HADS, the Walking Test, and the total score of the Work and Social Adjustment scale are all continuous variables. However, the distribution of these is not pre-specified with the possibility that some or all may be skewed and the Walking Test may be bimodal. The number of CDC symptoms is a count variable and CDC Symptoms (1) and (8) are binary variables.
Descriptive statistics for outcome measures The dis-tributions of all secondary efficacy outcomes will be pre-sented in histograms (continuous/count) or bar charts (ordinal/binary) both overall and by intervention at each assessment point. A single table will be produced includ-ing summary statistics for all secondary efficacy out-comes by intervention and assessment point. Numbers (and percentages) or means (and standard deviations, minimums and maximums) or medians (and inter-quartile ranges, minimum and maximums) will be pre-sented as appropriate. Summary statistics will be further plotted using line graphs for each outcome across time by intervention. The anticipated profiles have not been specified in advance. Potential variability in secondary efficacy outcomes between therapists and between doc-tors will be investigated using an approach similar to that outlined for the primary outcomes.