INTRODUCTION
Numerical simulations of evolution have a long history in ecology and molecular evolution but are less used in cell and developmental biology. Evolutionary computations, in the latter context, face the technical challenges of defining the fitness to be optimized and inventing plausible mutations. To evolve properties of the cell, the selection used in ecology, i.e. reproductive success, is too far removed from the question and it is unclear how to translate mutation rates at the genome level into morphological change.
In two previous papers we have evolved regulatory networks for segmentation and adaptation and confronted the problems of what fitness to optimize and how to chose mutation rates (Francois et al., 2007; Francois and Siggia, 2008). The fitness has to be specific to the process, e.g. reward segment number to evolve segmentation, yet be as general as possible because we can only hope to find networks common to phyla, not individual species. Detailed mutation rates became immaterial once it was shown that the fitness landscape was shaped like a funnel (defining better fitness to be lower), so that any mutational process that sampled all directions would move to the bottom of the funnel. This mathematics recapitulates Darwin’s original insight that small changes in fitness can rapidly lead to the evolution of complex structures such as the eye (Nilsson and Pelger, 1994). Computational evolution functions like a genetic screen in that it enumerates in an unbiased way all models that can be built from a predefined set of parts to achieve a certain function. It favors
models that can be built by incremental improvements in fitness, rather than via multiple neutral steps or transitions through less fit intermediates. Evolution is rapid when it can march along a fitness gradient.
The early history of developmental patterning was rich in concepts, such as morphogen and selector genes, that lacked a molecular identity, yet informed many experiments (Crick and Lawrence, 1975), and it is to that level of description that we wish to return, but in a more quantitative way. There is extensive literature on homeotic mutants and homeotic genes, starting in the 1960s with the description of bithoraxmutants (Lewis, 1963). In his pioneering work, Lewis proposed that fly segmental identities were directed by hypothetical bithorax ‘substances’, specific to a given segment. This idea was generalized to selector genes that had to be compartment specific, have an instructive role in development, and function combinatorially and cell-autonomously (Mann and Morata, 2000). The original selector genes were engrailed, which defines the anterior-posterior (AP) compartments within imaginal disks, and the Hox gene Ultrabithorax.
Hox genes are major determinants in patterning the AP axis in bilaterians. Hox genes have been shown to be the crucial regulators of segmental identity in the fly (McGinnis and Krumlauf, 1992) and of vertebrae identity in vertebrates (Burke et al., 1995), such that Lewis further qualified them as ‘master control genes’ (Lewis, 1992). Other examples of master control genes that direct cellular fates in different contexts at different stages of development include MyoDfor muscles (Weintraub et al., 1991), Pax6for eyes (Kozmik, 2005; Gehring and Ikeo, 1999) and Distal-lessfor legs (Gebelein et al., 2002; Pearson et al., 2005) and the so-called ‘terminal selector genes’, such as che-1, that determine ASE neuronal fates in C. elegans(Hobert, 2008). These master control genes are often embedded in feedback loops that lock commitment to a given cellular fate or identity (Weintraub et al., 1991; Zuber et Development 137, 2385-2395 (2010) doi:10.1242/dev.048033
© 2010. Published by The Company of Biologists Ltd
Center for studies in Physics and Biology, The Rockefeller University, 1230 York Avenue, 10065 New York, NY, USA.
*Author for correspondence (pfrancois@rockefeller.edu)
Accepted 10 May 2010 SUMMARY
During vertebrate embryogenesis, the expression of Hox genes that define anterior-posterior identity follows general rules: temporal colinearity and posterior prevalence. A mathematical measure for the quality or fitness of the embryonic pattern produced by a gene regulatory network is derived. Using this measure and in silico evolution we derive gene interaction
networks for anterior-posterior (AP) patterning under two developmental paradigms. For patterning during growth (paradigm I), which is appropriate for vertebrates and short germ-band insects, the algorithm creates gene expression patterns reminiscent of Hox gene expression. The networks operate through a timer gene, the level of which measures developmental progression (a candidate is the widely conserved posterior morphogen Caudal). The timer gene provides a simple mechanism to coordinate patterning with growth rate. The timer, when expressed as a static spatial gradient, functions as a classical morphogen (paradigm II), providing a natural way to derive the AP patterning, as seen in long germ-band insects that express their Hox genes
simultaneously, from the ancestral short germ-band system. Although the biochemistry of Hox regulation in higher vertebrates is complex, the actual spatiotemporal expression phenotype is not, and simple activation and repression by Hill functions suffices in our model. In silico evolution provides a quantitative demonstration that continuous positive selection can generate complex phenotypes from simple components by incremental evolution, as Darwin proposed.
KEY WORDS: Hox genes, In silico evolution, Mutual entropy, Systems biology
Predicting embryonic patterning using mutual entropy
fitness and in silico evolution
Paul François* and Eric D. Siggia
D
E
V
E
LO
P
M
E
N
al., 2003; Hobert, 2008), and transient activation, locked down via positive-feedback loops, appears to be a rule in developmental gene networks (Davidson et al., 2002; Oliveri et al., 2008).
In both insects and vertebrates, the 3⬘to 5⬘arrangement of Hox genes on the chromosome matches the order of their anterior expression boundaries along the AP axis (McGinnis and Krumlauf, 1992), a property termed ‘spatial colinearity’. Furthermore, in vertebrates and short-germ insects, the temporal order of expression in the posterior region of the growing embryo follows the 3⬘to 5⬘genomic order (Kmita and Duboule, 2003; Ferrier and Minguillón, 2003; Wacker et al., 2004; Shippy et al., 2008), a phenomenon termed ‘temporal colinearity’.
Hox function in the fly follows the posterior prevalence (or dominance) rule, whereby the most posterior Hox gene imposes its fate on all the anterior genes (McGinnis and Krumlauf, 1992; Kmita and Duboule, 2003). Loss-of-function mutations result in anterior homeotic transformations in which a parasegment(s) assumes the fate of the immediately anterior expressed Hox gene (Lewis, 1978). In gain-of-function experiments, a Hox gene that is ectopically expressed anterior to its normal position results in a posterior homeotic transformation, whereas expressed posteriorly it does nothing (Gibson and Gehring, 1988; González-Reyes and Morata, 1990; McGinnis and Krumlauf, 1992; Morata, 1993).
The situation in vertebrates is similar, but more complex. There are four paralogous Hox clusters and the clearest phenotypes are observed when an entire Hox paralog group is removed. There is definitely combinatorial regulation among the paralog groups, in that adjacent Hox genes affect overlapping segments (Horan et al., 1994; Wellik and Capecchi, 2003; McIntyre et al., 2007; Wellik, 2007). However, the number of functional Hox combinations is a linear function of the number of genes, not an exponential one [e.g. see figure 2 in Iimura and Pourquie (Iimura and Pourquie, 2007)]. The boundaries between the major types of vertebrae coincide with Hox domains and are invariant among species, even when the number of vertebrae in each domain changes (Wellik, 2007). Posterior homeotic transformations have been observed by ectopic expression of genes anterior to their normal domains (Kessel et al., 1990; Lufkin et al., 1992).
Our goal in this article is twofold. We first define quantitatively a fitness function (technically, the mutual entropy) that rewards complex patterning. This fitness is an explicit function of the concentration profiles of specific genes that define cellular identities (we will call them ‘realizator’ genes) along the AP body axis. It favors diversity, i.e. there should be many such realizator genes present, each with a unique stable territory, and knowing the realizator it should be possible to infer AP position. A standard mutation-selection evolution algorithm then creates the network that allows for ordered domains of realizator gene expression. Mutual entropy (or information) has many mathematical properties that make it the natural fitness with which to evolve developmental networks in silico, generalizing its prior use in systems neuroscience (Rieke et al., 1999).
We use this fitness to evolve networks to pattern the AP axis under general conditions that span those observed in arthropods and vertebrates: (1) a global morphogen gradient that disappears before the end of embryogenesis; and (2) a sliding morphogen that models patterning during growth (Francois et al., 2007; Peel et al., 2005; Iimura et al., 2009). Position is defined by exposure to the morphogen, but the networks are otherwise cell-autonomous. We define the types of hierarchical networks that can be constructed by incremental improvements in fitness. For the sliding morphogen, which is appropriate to vertebrate Hox
patterning, the pattern forms by means of a timer gene that measures the residence time in the posterior growth zone. Surprisingly, the evolved networks possess properties that are qualitatively similar to actual Hox gene networks, such as anterior homeotic transformations, posterior prevalence and temporal colinearity. The timer gene also naturally explains how to interconvert between static fly-like and dynamic morphogens without gross loss in fitness. Key aspects of Hox regulation simply follow from the exigencies of morphological evolution, suggesting that convergent evolution would channel variable molecular mechanisms towards the same phenotype.
MATERIALS AND METHODS Mutual entropy as fitness
We simulate networks of interacting genes and proteins as a system of differential equations, and we model an embryo as a linear array of Lcells sharing the same genetic network. The fitness must be defined for any network, as we want to begin with networks that pattern poorly or not at all and evolve something better. We also seek to evolve patterning networks common to a phyla, so the fitness should be as generic, smooth and parameter free as possible (Francois et al., 2007; Francois and Siggia, 2008).
We assume that, ultimately, a single gene (which may be the intersection of several conventionally defined selectors) defines or labels segmental identity (Lewis, 1963; Lewis, 1992). Since the fitness should be a property of the pattern of cell types, it will depend only on the spatial distribution of the label genes, henceforth called realizators (Mann and Morata, 2000). Computational evolution, as we will explain, has to discover the realizators as well as the genes and regulatory modules that control them.
Fitness concepts
Fitness should favor: (1) the diversity of genetic expression – the fitness improves monotonically with the number of realizators; and (2) a unique cell fate – one cell should express only a single master control gene for a given segmental identity.
Mathematically, it is natural to measure diversity by entropy as is done in physics. If a system has Npossible states available to it, but only resides in one of them, the entropy is zero, whereas if it spends equal time in each state the entropy is maximum and equals log(N). For the embryo, each realizator gene defines a state and the occupancy of each state is proportional to the integral of the realizator over the embryo. Thus, we define an entropy term, H(diversity), in the fitness that varies between zero when only one realizator is expressed, to log(N) when they are expressed equally.
The second requirement of our fitness is naturally expressed as a conditional entropy, H(diversity|position); namely, at a fixed position in the embryo we want the least diversity possible, i.e. the expression of a single realizator gene. Thus, our fitness requires us to optimize two ‘contradictory’ constraints on the same function: maximizing entropy at the global scale and minimizing conditional entropy locally. To define the trade off between the two desiderata, we assume that duplicating a realizator gene while keeping its expression domain constant is a neutral event. Only one combination of our two entropies satisfies this condition (see Appendix S1 in the supplementary material) and we can define a unique fitness as:
fitness –H(diversity) + H(diversity | position) . (1) We have chosen signs so that fitness is to be minimized; for Nrealizators the optimal fitness is –log(N) when each realizator is restricted to a single expression domain occupying 1/Nth of the embryo. [Our fitness is also called ‘mutual information’ (Shannon and Weaver, 1998) and expresses how well the embryo can define position given concentrations of realizators.]
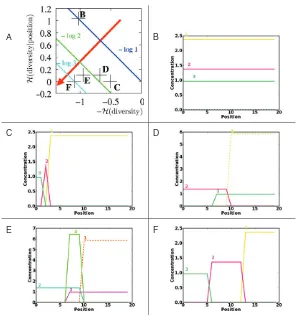
The fitness has to be defined for any profile of the realizators and Fig. 1 illustrates several cases decomposed into the two components of the fitness. The most revealing case is illustrated in Fig. 1D,E. Allowing two realizators to overlap degrades fitness, although one might think that the
D
E
V
E
LO
P
M
E
N
overlap region conveys more ‘positional information’. However, we insist that evolution has to create a gene restricted to the overlap and to designate it as a realizator before the refined patterning of the axis is recognized by the fitness.
Mathematical definition
Let cixbe the concentration of realizator gene iin cell x. We can define a
conditional probability for cell xto be in the realizator state ias:
Note that:
and pi|x⬇1 if one realizator is much larger than all the others. When only
a single realizator is expressed, we are not concerned about its concentration as we assume its activity on downstream targets can be adjusted to ensure their expression.
We define a probability pixnormalized over all cells and realizators as:
where Lis the number of cells in the embryo. From pix, one can define a
probability pito find an realizator ianywhere in the embryo as:
and a probability px1/L, which says that each cell xhas equal weight. With
these definitions, high diversity equates to large entropy, defined as:
H(diversity) is the usual Shannon entropy in information theory. This is maximum for all piequal to 1/Nfor Nselector genes, and therefore is lower
or equal to its maximum value logN.
pi|x= cix
k
∑
ckx . (2)i
∑
pi|x=1 ,pix= cix L
k
∑
ckx , (3)pi= x
∑
pix , (4)H(diversity)= − i
∑
pilogpi . (5)We also define a conditional entropy H(diversity|position) as:
Minimization of H(diversity|position) expresses the realizator gene hypothesis that only one realizator is expressed at a given position (cell) in the embryo. Thus, the fitness naturally resolves into the optimization of two functions: H(diversity) should be large and H(diversity|position) should be small, a situation we have encountered before (Francois and Siggia, 2008). If we also impose the condition that duplication of a realizator is a fitness-neutral event, then only one combination of the two functions is allowed [see equations (6, 8) in Appendix S1 in the supplementary material], namely, the mutual entropy between position and realizators for the probability pix:
(Smaller fitness is better.)
Methods
Our network evolution algorithm follows our earlier work (Francois and Hakim, 2004; Francois et al., 2007; Francois and Siggia, 2008) with some technical modifications specific to the problems treated here (see Appendix S1 in the supplementary material). Both the topology of the network [i.e. the nodes (genes) and the edges (interactions) connecting them] and all the numerical parameters for the expression rates are mutated and selected. The tags designating the realizators can move among the available genes and also be created and destroyed.
Fig. 2 displays a summary of each ‘generation’ of the algorithm. We evolve a population of networks. In one generation the half that is most fit is retained unaltered, and a copy of each is mutated and added back to the population. Therefore, the fitness of the best network can only improve or remain the same.
When a morphogen is supplied as an input, all interactions are transcriptional and cell-autonomous. A transcription factor can act as an activator or repressor, depending on its target. Genes are off, i.e.
non-H(diversity|position)= − i,x
∑
pixlogpix+x
∑
pxlogpx . (6)F(p)=
i
∑
pilogpi+ x∑
pxlogpx− ix∑
pixlogpix . (7)A B
C D
[image:3.612.49.345.56.375.2]E F
Fig. 1. Fitness diagram and gene expression profiles as a function of anterior-posterior (AP) position from cell 1 to 20 illustrate properties of the fitness. Only the realizator genes (solid lines) enter the fitness; other network genes are represented by dashed lines. (A)The two components of fitness are plotted with diagonal colored lines showing contours of constant total fitness (better fitness in red). B-F mark the fitness of subsequent panels. (B)For three genes ubiquitously expressed, both H(diversity) and conditional entropy H(diversity|position) are high and equal, so the actual fitness is zero. (C)Each cell expresses a single gene resulting in zero conditional entropy, but gene 1 occupies most of the embryo, lowering the diversity, giving a fitness of –log1.64. (D)Fitness is defined when realizators overlap, but neither the diversity nor the conditional entropy is optimal and the fitness is –log1.78>–log2. (E)The network in D can be improved by the addition of a new realizator 4 that accounts for the overlap of genes 2 and 3, giving a fitness of –log2.33<–log2. (F)Optimal configuration for three realizators; diversity is high (log3) and conditional entropy is zero, so the actual fitness is –log3.
D
E
V
E
LO
P
M
E
N
expressing, unless a transcriptional activator is supplied. A single activator suffices to turn a gene on, so that positive feedback of a gene on itself can result in bistability. Activators combine through the equivalent of ‘OR’ functions. Similarly, one repressor is enough to suppress transcription and repressors work multiplicatively. Gene duplication is permitted and entails the replication of all interactions impinging on, and emanating from, the duplicated gene. If a realizator is duplicated, a new realizator tag is created and assigned to the new gene. The embryo consists of a line of L20 cells, where cell x1 is anterior.
Although we do not consider molecular noise here, we modestly randomize the input values and select for an invariant (and static) final gene profile. When a morphogen is provided, either static or dynamic, to orient the embryo, we average cixover all initial conditions and then compute pix
and the fitness. When two nearly optimal configurations are mixed in this way (or the realizator expression domains broken up in multiple ways) the fitness is clearly degraded.
There are penalties imposed on pathological expression patterns that are not static at the end of the simulation or in which a cell expresses no realizators. Their precise form does not matter. For further details of the methods, see Appendix S1 in the supplementary material.
The morphogen increases from anterior to posterior, in analogy with
Caudal, which is conserved from insects to vertebrates and believed to be an ancestral morphogen in arthropods (Copf et al., 2004; Olesnicky et al., 2006). We define an AP order on genes, which potentially overlap in expression in the following way. A gene ‘A’ is posterior (respectively anterior) to a gene ‘B’ if the anterior (respectively posterior) boundary of A in space is posterior (respectively anterior) to that of B. For instance, in Fig. 1E, gene 1 is posterior to genes 2 and 3, whereas gene 2 is anterior to genes 1 and 3. To characterize network-derived patterns, we define a posterior index (respectively anterior index) by counting the number of repressions in which one gene is repressed by a more posterior (respectively anterior) gene. For example, in Fig. 1D, if gene 1 represses gene 2, then this repression counts for 1 in the posterior index. On the contrary, if gene 2 represses gene 1, then this repression counts for 1 in the anterior index. In
practice, gene expression profiles are sharp enough that boundary positions can be assigned unambiguously, and we include all genes expressed at the final time in our index count.
We display networks after applying a pruning procedure that eliminates all genes and interactions, the removal of which does not degrade the fitness.
RESULTS
We use the fitness function to evolve a patterning network in two cases that broadly exemplify what is seen in AP patterning in arthropods and vertebrates: (1) a static morphogen gradient that disappears before the fitness is measured; and (2) a sliding, or translating, morphogen, motivated by somitogenesis and Hox patterning (Francois et al., 2007; Dubrulle et al., 2001; Iimura et al., 2009).
Since the network is cell-autonomous, AP fate is defined at the single-cell level, either from the morphogen level (experienced for a fixed time) or the length of time that the cell ‘feels’ a fixed morphogen. These two problems become equivalent through the intermediary of a timer gene. With cell-cell interactions and no morphogen, our algorithm evolves lateral inhibition (see Appendix S1 and Figs S13, S14 in the supplementary material).
[image:4.612.57.468.56.383.2]Evolving with a disappearing morphogen gradient For each simulation, cells are initialized with an exponential morphogen gradient that is present for a fixed time and then removed rapidly (Fig. 3A). (This protocol defines an informative bridge between a morphogen that never disappears and a sliding morphogen tied to growth.) The fitness is computed some time after the morphogen disappears. Fig. 3 provides an example of a network that evolved under these conditions with our mutual entropy fitness. The
Fig. 2. Schematic of the evolutionary algorithm. Differential equations for each network are integrated (step 1). The fitness function is
computed from the steady state of each network (step 2). The best half of the networks is retained (selection), copied (growth, step 3) and randomly mutated (mutation, step 4). Mutations change parameters (kinetics) or the network itself, as exemplified here.
D
E
V
E
LO
P
M
E
N
fitness clearly decreases with generation number, ending up close to –log7.25, with eight realizators expressed at steady state defining eight slightly uneven domains. Movie 1 in the supplementary material shows the time course of embryonic development. For other examples of networks evolved under identical conditions, see Appendix S1 and Figs S1-S8 in the supplementary material.
Despite some network-to-network variability, common structural features can be observed in the network topologies. All the realizator genes are self-sustaining in the final state (the morphogen is gone) and many are individually bistable. Bistability also plays a crucial role in pattern establishment because transient activation by upstream genes can push the realizator above the threshold that leads to a self-maintained high-activity state. This simple process has been described as the basic mechanism for stabilization of regulatory states in the sea urchin embryo (Davidson et al., 2002; Oliveri et al., 2008). Bistability also implies that gene repression can occur by transiently forcing a realizator below its auto-activating threshold, provided that no other activators are present. When a set of realizators are individually bistable, then supplying only a single repressive interaction between each pair of realizators is sufficient to stabilize just those configurations with at most one realizator active. This is most evident in the Boolean limit. Any configuration with two realizators on, would activate the repression between them and eliminate one. The sets of genes (8,4,2) and (1,8,4) in Fig. 3 are examples of this widely used arrangement.
Another prominent feature of the evolved networks is the asymmetry in how the anterior versus posterior limits of the realizator domains are established due to the morphogen. Most posterior boundaries are defined by repression from genes expressed posterior to the one in question, rather than by the loss of an anteriorly expressed activator. Anterior boundaries are generally defined by activation thresholds, often in response to the morphogen. To quantify this asymmetry, we defined (see Materials and methods) network anterior/posterior indexes, the average
values of which are 1.1 and 7.2, respectively, for all the networks in the main text and Appendix S1 that were generated by a disappearing morphogen gradient.
An extreme case with anterior index 0 is provided by Fig. 3, in which genes are only repressed by genes posterior to them. As a consequence, the network itself is very hierarchical, and there is a correspondence between the position of a gene in this hierarchy and its domain of expression. For example, consider the subnetwork made of genes 2, 4, 8 and 1, and order them by the direction of the repressive links. Gene 2 is at the bottom of the hierarchy, being repressed by 4, 8 and 1, whereas gene 4 is repressed by genes 8 and 1, and gene 8 is repressed only by gene 1. Strikingly, this order in network hierarchy (2,4,8,1) is actually the order of gene expression from anterior to posterior at steady state, as can be seen in Fig. 3D. This property is general and can be seen in other evolved examples. So, the bias induced by the input gradient has a clear signature in the structure of the evolved network, imposing a hierarchy in which posterior genes are high and repress anterior genes, which occupy lower positions in the hierarchy.
Gene duplication and mutational events
To understand why there is such a bias in network structure, we looked at a typical evolutionary pathway that creates a new expression domain (Fig. 4). Gene duplication is central to the events pictured, but after all interactions are replicated for the new gene, several (e.g. the mutual activation of genes 1 and 3 in Fig. 4B) are superfluous and disappear.
Then, while the expression domain of one copy is first kept essentially unchanged (gene 3 in Fig. 4C), the domain of expression of the other copy starts drifting to another position (improving the fitness) and becomes locked more posteriorly, new regulations being evolved to ensure that the domains do not overlap (Fig. 4D). Single neutral mutations and fitness-improving parameter changes suffice to traverse the entire pathway. A less A
→
B
t < 1500 t = ∞
[image:5.612.52.528.59.287.2]C D
Fig. 3. A network evolved under the control of a static morphogen gradient.(A)Dynamics of the morphogen gradient, which is constant and then disappears. (B)Evolution of the fitness of the best network as a function of generation number. (C)Network topology; the nodes and edges are defined following the key in Fig. 2. (D)Steady-state profile of genes as a function of their position. Colors and numbers for a given gene correspond to those in C. Posterior index, 9; anterior index, 0; final fitness, –log7.25.
D
E
V
E
LO
P
M
E
N
frequent pathway leading to an equivalent final state is shown in Fig. S15 in the supplementary material. If we freeze the topology of Fig. 4D, randomize the parameters and re-optimize with our fitness, the same hierarchical expression pattern re-emerges (see Fig. S16 in the supplementary material). Other frequent evolutionary pathways following gene duplication are shown in Fig. S17 in the supplementary material, leading to the same topology as in Fig. 4.
Evolving with a sliding morphogen
There is good evidence from somitogenesis in vertebrates that patterning occurs as cells emerge from a posterior growth zone and transit to lower levels of the posterior morphogens FGF and Wnt (Aulehla and Pourquié, 2010). Hox patterns develop contemporaneously (Aulehla and Pourquié, 2010; Iimura and Pourquie, 2006) with somitogenesis. In Xenopus, there are particularly clear data showing that Hox genes are expressed in a 3⬘to 5⬘temporal progression in the non-organizer mesoderm and acquire a fixed position when the cells converge into the organizer and then extend to create the AP axis (Wacker et al., 2004; Durston et al., 2010). Thus, to model Hox patterning coupled to growth, we assume a step-like morphogen profile that translates down a line of cells. High morphogen defines the posterior growth zone, and the step itself corresponds to the organizer, where the morphogen is withdrawn and cells assume a fixed fate. Thus, cells sense their distance from the rostral pole only once they are exposed to morphogen. Cell fate can be controlled by the exposure time to morphogen in the context of digit formation (Nelson et al., 1996), and possibly also during axis formation (Aulehla and Pourquié, 2010), although the process by which time is measured is completely unknown.
Typical networks derived with these input dynamics are presented in Figs S9-S11 in the supplementary material. As for static gradients, realizators tend to auto-activate and be bistable so as to persist after the input disappears. Posterior boundaries are also controlled by repression from posterior genes. For the anterior
boundaries, however, it is not possible just to read a morphogen level, but rather the gene has to measure the time that it is exposed to input. In several cases (e.g. see Fig. S11 in the supplementary material) this is accomplished by early-activated genes repressing those that appear later, i.e. setting their anterior boundaries. In general, it was harder with a sliding gradient than a static one to initiate multi-domain patterns starting from nothing.
Using a timer gene
To accelerate the evolution, we began with the small network shown in Fig. 5B. It is not unreasonable, biologically, to bias evolution in this way because the sliding morphogen really only patterns the trunk and posterior, not the head. Our initial network is common in developmental biology [e.g. the gsc/bra system (Green, 2002)] and was the generic two-domain network we found for a static input. One activator controls two genes with different thresholds, and the high-threshold gene represses the low-threshold gene to make their expression domains disjoint. We generalize it slightly by adding a potential timer protein 3, which is activated by the input, to delay the activation of gene 1 by the morphogen. The subsequent evolution of this small network in shown in Fig. 5, along with the expression profile it generates. Another example of such evolution is shown in Fig. S12 in the supplementary material.
The initial network bias and timer gene 3 facilitate the evolution of simple networks with many states that exhibit topological properties that are similar to those produced with a static input. Again, posterior index is high while anterior index is low. As with the static gradient, posterior boundaries are set up by repression by posterior genes. However, because there is no AP gradient, the mechanism of establishment of anterior boundaries is different, and relies heavily on the timer gene. In Fig. 5, gene 3 accumulates slowly and by virtue of graded activation thresholds, gene 3 directly activates genes 4 then 5 then 6, and indirectly controls the remaining realizators other than gene 2 (which is activated directly by the input and is repressed by gene 3 to restrict it to the anterior).
A B
[image:6.612.56.501.60.273.2]C D
Fig. 4. Example of a typical pathway going from fitness –log2 to –log3.(A-D)Starting with a network with two realizators and two domains of equal size, fitness is –log2 (A); gene 1 is duplicated to create gene 3, with all incoming and outgoing interactions copied and no change in fitness (B). Parameter selection shifts the relative domains of the duplicated realizators, with fitness –log2.1 (C). Eventually, the most posterior gene represses the anterior ones, confining gene 3 to the middle, each step improving fitness until finally, fitness is –log3 (D).
D
E
V
E
LO
P
M
E
N
As a consequence of these successive activations in response to the accumulating timer and in spite of the rather complex network topology, there is an almost perfect correspondence between the temporal order of expression in the posterior cells and the spatial order (Fig. 5C; see Movie 2 in the supplementary material). This property can be related to the so-called temporal colinearity of Hox genes and is therefore a direct consequence of evolution under the control of a timer gene.
The common topological features of networks evolved under the control of static versus sliding morphogens allow an easy translation between the two cases. Since our networks act cell-autonomously, we can literally replace the static morphogen as in Fig. 3D with a timer gene that grows without saturation while exposed to morphogen, and then decays exponentially after the morphogen disappears from the cell in question. When this is done for the network in Fig. 3, the realizator expression order from anterior to posterior does not change (see Figs S19, S20 and Movie 3 in the supplementary material). Similarly, if we turn the ‘timer’ gene into a static morphogen, the network of Fig. 5 patterns an embryo with the exact same anterior to posterior order of gene expression (see Fig. S21 and Movie 4 in the supplementary material). Such a change in morphogen dynamics could explain the evolution from short to long germ-band insects (Liu and Kaufman, 2005).
Lastly, the existence of a timer gene suggests an easy way to couple growth of the embryo to the dynamics of patterning, a property necessary to explain the fact that embryos can develop normally at different rates, such as happens in amphibians at reduced temperature. If the dynamics of the timer gene scale with the growth rate (simulated by the speed of the sliding input), the embryo patterns properly, as shown in Movie 5 in the supplementary material.
Connecting realizators to nested Hox pattern
It is well known that Hox expression domains overlap considerably and are often nested, whereas their ‘master gene’ activity is segmentally restricted. Unknown post-transcriptional events ensure that the activity of anterior Hox genes is repressed by posterior Hox genes, a property called phenotypic repression (or posterior dominance) in fly and posterior prevalence in vertebrates (Duboule and Morata, 1994; Kmita and Duboule, 2003).
The network in Fig. 5 has manifest temporal colinearity in its realizators, but the remaining upstream genes 1, 6 and 9 are not nested in the typical Hox pattern. This is because we have made all of the genes multifunctional, i.e. simultaneously repressors and activators, so that we do not make any distinction between transcriptional and post-transcriptional activities.
However, it is nevertheless possible to formally disentangle these two activities to retrieve a more usual Hox gene transcriptional pattern. For each realizator, we create a new upstream gene that captures all the activating inputs (including from itself). This new gene activates a realizator, which retains all the repressive connections of the original, and accounts for the actual ‘master gene’ activity. Then, the bistable upstream genes will have Hox-like nested expression domains, and the new realizators will retain the localized expression of the original ones (Fig. 5E). Fig. S24 in the supplementary material shows the complete network derived from Fig. 5B by this transformation; for further details, see Appendix S1 and Figs S22-S24 in the supplementary material.
If we smooth our sliding input step to make the transition from off to on gradual, then our model can readily capture another feature of Hox patterning termed ‘anterior spreading’ (Kmita and Duboule, 2003; Iimura et al., 2009). It is most obvious in chick,
A C
B D
[image:7.612.48.391.54.393.2]E F
Fig. 5. Network evolved with a sliding morphogen beginning from a two-domain network.(A)The concentration of gene 0 recedes from anterior to posterior to model the coupling of patterning to growth. (B)Initial network topology and the evolved network topology after 5000 generations. (C)Steady-state profile for the evolved network. Posterior index, 5; anterior index, 0; fitness, –log4.95. (D)Gene expression as a function of time in the posterior-most cell follows the AP order in C, with the exception of the one realizator (gene 8) that is repressed by the ’input’. (E,F)We created two genes (shown by a common color) from each realizator as explained in the text and in Fig. S22 in the supplementary material. The dashed lines display the Hox-like genes of the pair with nested expression profiles, and the solid lines show the new realizator genes with non-overlapping expression domains. (E)Final pattern. (F)For a smoothed morphogen step, most of the genes display anterior spreading: they are first expressed posteriorly and then move anteriorly (see also Movie 6 in the supplementary material).
D
E
V
E
LO
P
M
E
N
and as the name implies, Hox genes first turn on in the posterior and are then expressed more anteriorly. When we simulate the network in Fig. S24 in the supplementary material and Fig. 5E, we see very evident anterior spreading (Fig. 5F; for the full time course for this network, see Movie 6 in the supplementary material).
Simulation of anterior homeotic transformations
The high posterior index that typifies hierarchical networks has a characteristic signature in a loss-of-function experiment when one gene is set to zero. In analogy with the anterior homeotic transformation seen with Hox gene loss of function (Horan et al., 1994; Wellik and Capecchi, 2003; McIntyre et al., 2007), the expression domain of the immediate anterior gene expands posteriorly to fill the hole left by the deactivated gene (Fig. 6), irrespective of whether the network was evolved under a static or sliding input.
DISCUSSION
Network hierarchy and posterior prevalence In silico evolution generates gene regulatory networks with properties similar to the Hox gene networks that pattern the AP body axis. Orientation is derived solely from the morphogen, be it static or sliding (our surrogate for patterning during growth); the gene networks are entirely cell-autonomous, which is not unreasonable biologically, as noted in the Introduction. Since the morphogen disappears before we assess the expression pattern of the realizator genes that define the fitness, the gene networks are inherently multi-stable and are directed towards the appropriate fate by the morphogen.
Our networks were all hierarchical, as abstracted in the module in Fig. 4. The morphogen defines the anterior gene expression boundaries, whereas the posterior boundaries are defined by repression from other genes. The two-gene limit is well known (Green, 2002). We quantified the excess of repression from posterior versus anterior genes by the respective indices (as defined in the Materials and methods) and found, for the 11 networks described in the text and in Appendix S1 in the supplementary material that were evolved under the control of gradient or timer, averages of 6.9 and 1.1. The phenomenon of posterior prevalence is a direct consequence of repression from the posterior gene (Fig. 6).
We obtained gene networks with the phenotypic properties of Hox genes and do not explicitly distinguish transcriptional and post-transcriptional regulation. The ‘genes’ in the simulation may be composites of real genes. The classic nested Hox expression territories occurred when we segregated activator and repressor activities into separate genes (Fig. 5E).
Our conclusions are largely insensitive to mutation parameters in the biologically plausible limit in which the rate of addition of new links/nodes in the network is much slower than parameter
mutation and link/node removal. Repeated simulations for the fate of duplicated genes or parameter reoptimization with fixed network topologies (see Figs S16, S17 in the supplementary material) generally yielded the same outcome (Fig. 4).
Changing mutation rates influences the speed of evolution, not its qualitative outcome, in agreement with previous findings (Francois et al., 2007). Only neutral or fitness-improving mutations survive selection and the fitness consists of plateaux separated by jumps when the topology changes and parameters are optimized in a few generations. The ease of evolving elaborate patterning networks suggests the fitness landscape is funnel-like, providing another argument for the parameter independence of our results.
Morphogen, timer and temporal colinearity The correlation between the spatial, genomic, and (for vertebrates) temporal order of Hox expression across many species has motivated experiments for mechanistic explanations. Genome-ordered Hox arrays are not required for proper AP expression (Seo et al., 2004); they may facilitate temporally ordered expression (Duboule, 1995), but genome order is not part of our phenotypic model. For mouse, experiments that disrupt one of four Hox clusters alter the temporal expression but do not disrupt the final spatial order (reviewed by Tschopp et al., 2009).
Our model for vertebrates assumes that axial patterning occurs progressively as cells exit a region of high posterior morphogen (e.g. Wnt). In amniotes, this is coupled to axial growth from long-term progenitors in the tail bud (Tzouanacou et al., 2009). In amphibians, Hox patterning occurs as cells converge from the ventral-posterior mesoderm and pass through the organizer (Wacker et al., 2004; Durston et al., 2010). Both situations are modeled as a morphogen step that slides (translates) down a line of cells (there is no need to explicitly model cell proliferation or movements). The step inflection is analogous to the organizer. Our networks are cell-autonomous, so the only cue as to AP position comes from the residence time in the high-morphogen posterior region.
In silico evolution connects time to AP position by creating a timer gene that builds up monotonically while the cells experience the morphogen and dies after they exit the morphogen. Cell fate records, through multi-stability, the highest value of the timer gene seen by that cell. Temporal colinearity of Hox expression in the undifferentiated posterior cells is one consequence of the timer gene. Temporal order does not itself generate spatial order, and morphogen versus temporal control is not an issue [except when we compare long and short germ-band insects (see below)]. Other biological properties, such as anterior spreading (Gaunt and Strachan, 1994), can be easily explained by translating a smoothed step.
[image:8.612.50.390.59.183.2]A
B
Fig. 6. Change in expression domains when a single gene 8 is forced to zero. (A)See Fig. 3C; (B) see Fig. 5C. In both cases, the gene directly anterior to 8 extends posteriorly, until it is repressed by the next posterior gene.
D
E
V
E
LO
P
M
E
N
A timer gene is a very natural way to coordinate growth and patterning, which is particularly important in amphibians, the embryonic development of which can vary by a factor of two with temperature. The vertebrate homolog of the posterior insect morphogen Caudal, Cdx(Duprey et al., 1988), has been shown to posteriorize Xenopus embryos in a dose-dependent manner (Pownall et al., 1996; Isaacs et al., 1998). Overexpression or downregulation of Cdx genes shifts multiple Hox domains in a graded way (van den Akker et al., 2002; Gaunt et al., 2008), indicating an upstream position in the global control of Hox genes that is suggestive of a role as a potential timer. Recently, overexpression of Hox genes has been shown to influence axial growth in mice (Young et al., 2009), which is beyond the scope of our model. However, the concept of a timer gene as a mediator between growth and axial patterning has not been proposed previously and we hope that our ‘timer and wavefront’ model functions in an analogous role to the ‘clock and wavefront’ model for somitogenesis.
Transition from short to long germ-band insects There is now abundant evidence from the arthropod phylogeny that long germ-band segmental patterning arose from the ancestral short germ-band mode multiple times (Peel et al., 2005), and recent reviews focus mostly on segmentation (Peel, 2008; Rosenberg et al., 2009). Much less is known about Hox patterning in short as opposed to long germ-band insects, so we assume that its dynamics are qualitatively similar to those of vertebrates. Thus, we model the short to long germ-band transition as the transition from a sliding to static gradient.
The timer gene in the short germ-band ancestor that converts residence time in the growth zone to a protein level simply becomes the new static morphogen (Fig. 7; see Fig. S21 and Movie 4 in the supplementary material), which could happen gradually as more nuclei become available in the blastula. What the timer gene concept accomplishes is to preserve unchanged the entire downstream gene hierarchy, which is necessary for a viable embryo. The fate of the Hox genes is seldom addressed in this radical developmental transition, although it has been proposed that the ancestral function of gap genes was to pattern Hox genes (reviewed by Peel, 2008). Interestingly, in view of vertebrate analogies, it has been suggested that the master morphogen controlling segmentation in the long germ-band insect Nasoniais Caudalin conjunction with Otd(Olesnicky et al., 2006; Lynch et al., 2006), and Caudal might be the timer in short germ-band insects.
The temporal colinearity of expression that we observed for the sliding gradient is readily lost after the transition to static gradient patterning (see Movie 1 in the supplementary material). There is pressure (in both the simulation and the embryo) to make the Hox pattern rapidly, so that when a static morphogen is supplied the posterior genes turn on early and repress the initiation of the anterior genes in posterior territories, thus generating simultaneous temporal induction.
Mutual entropy as a fitness and the role of gene duplications
We used the mutual entropy between realizator genes and AP position to define a fitness for embryonic patterning. The same expression has been used to quantify information transmission in the presence of molecular noise for small genetic networks (Ziv et al., 2007; Tkacik et al., 2008; Tkacik et al., 2009). The measure used in those studies implies that combinatorial expression conveys
more information about position, whereas our fitness penalizes two realizators that overlap and it is only when a third realizator is created and confined to the overlap region that the fitness will improve.
Our mutual entropy fitness offers a mathematical framework in which complex evolutionary events at the network level can be observed and quantified. Lewis proposed that Hox genes evolved by duplication, in which one copy keeps the ‘original’ function while the other one is able to assume a new segmental identity (Lewis, 1992). However, we find a different scenario that is more symmetric between the two duplicated genes. They are expressed contiguously and perturb the expression domains of their immediate neighbors (Fig. 4). Some phylogenetic data on homeobox genes seem to support the idea that duplicated genes remain adjacent [for example, see figure 2 in Ryan et al. (Ryan et al., 2007), where Hox1/2, Hox6-8and Hox9-14respectively cluster together].
Incremental evolution and embryonic patterning Although a connection between posterior prevalence, temporal colinearity and anterior spreading has long been part of the Hox phenomenology, this is not equivalent to creating a differential equation model that expresses it. Nor was it obvious that the natural mathematical measure of diversity of gene expression along an axis could serve as the fitness, for which the properties of temporal colinearity and posterior prevalence could arise by incremental evolution. Duplication is the obvious route to multiple Hox genes, but we furnished a detailed path for how this can occur incrementally.
[image:9.612.324.547.61.207.2]Hox regulation during growth might be achieved by different combinations of molecular pathways in different species in analogy with the somite clock, i.e. the Wnt, Notch and FGF pathways may have different oscillatory properties in different species (Goldbeter and Pourquié, 2008; Giudicelli and Lewis, 2004), yet the phenomenon itself is invariant, and its ease of evolution by continuous improvements in fitness suggests an explanation for this.
Fig. 7. Model for AP patterning in vertebrates and short germ-band insects and the transition to a long germ-germ-band insect. (Left) AP patterning in vertebrates and short germ-band insects. (Right) The transition to a long germ-band insect. The timer (green) accumulates while cells are exposed to the sliding posterior morphogen (blue) and then decays. Its maximum value in a cell defines the cell fate. The timer, when applied statically as a morphogen gradient (right), creates the same pattern, now simultaneously rather than sequentially.
D
E
V
E
LO
P
M
E
N
Acknowledgements
We thank John Guckenheimer and Bill Bialek for discussions. Support was provided by the NSF under grant number DMR0804721 to E.D.S.
Competing interests statement
The authors declare no competing financial interests.
Supplementary material
Supplementary material for this article is available at
http://dev.biologists.org/lookup/suppl/doi:10.1242/dev.048033/-/DC1
References
Aulehla, A. and Pourquié, O.(2010). Signaling gradients during paraxial
mesoderm development. Cold Spring Harbor Perspect. Biol.2, a000869.
Burke, A. C., Nelson, C. E., Morgan, B. A. and Tabin, C.(1995). Hox genes and
the evolution of vertebrate axial morphology. Development121, 333-346.
Copf, T., Schröder, R. and Averof, M.(2004). Ancestral role of caudal genes in
axis elongation and segmentation. Proc. Natl. Acad. Sci. USA 101, 17711-17715.
Crick, F. H. and Lawrence, P. A.(1975). Compartments and polyclones in insect
development. Science189, 340-347.
Davidson, E. H., Rast, J. P., Oliveri, P., Ransick, A., Calestani, C., Yuh, C.-H.,
Minokawa, T., Amore, G., Hinman, V., Arenas-Mena, C. et al.(2002). A
genomic regulatory network for development. Science 295, 1669-1678.
Duboule, D.(1995). Vertebrate hox genes and proliferation: an alternative
pathway to homeosis? Curr. Opin. Genet. Dev.5, 525-528.
Duboule, D. and Morata, G.(1994). Colinearity and functional hierarchy among
genes of the homeotic complexes. Trends Genet.10, 358-364.
Dubrulle, J., McGrew, M. J. and Pourquie, O.(2001). Fgf signaling controls
somite boundary position and regulates segmentation clock control of spatiotemporal hox gene activation. Cell106, 219-232.
Duprey, P., Chowdhury, K., Dressler, G. R., Balling, R., Simon, D., Guenet, J.
L. and Gruss, P.(1988). A mouse gene homologous to the Drosophila gene
caudal is expressed in epithelial cells from the embryonic intestine. Genes Dev.2, 1647-1654.
Durston, A. J., Jansen, H. J. and Wacker, S. A.(2010). Time-space translation
regulates trunk axial patterning in the early vertebrate embryo. Genomics95, 250-255.
Ferrier, D. E. K. and Minguillón, C.(2003). Evolution of the hox/parahox gene
clusters. Int. J. Dev. Biol. 47, 605-611.
Francois, P. and Hakim, V.(2004). Design of genetic networks with specified
functions by evolution in silico. Proc. Natl. Acad. Sci. USA101, 580-585.
Francois, P. and Siggia, E. D.(2008). A case study of evolutionary computation of
biochemical adaptation. Phys. Biol. 5, 26009.
Francois, P., Hakim, V. and Siggia, E. D.(2007). Deriving structure from
evolution: metazoan segmentation. Mol. Syst. Biol. 3, 9.
Gaunt, S. J. and Strachan, L.(1994). Forward spreading in the establishment of a
vertebrate hox expression boundary: the expression domain separates into anterior and posterior zones, and the spread occurs across implanted glass barriers. Dev. Dyn.199, 229-240.
Gaunt, S. J., Drage, D. and Trubshaw, R. C.(2008). Increased cdx protein dose
effects upon axial patterning in transgenic lines of mice. Development135, 2511-2520.
Gebelein, B., Culi, J., Ryoo, H. D., Zhang, W. and Mann, R. S.(2002).
Specificity of distalless repression and limb primordia development by abdominal hox proteins. Dev. Cell3, 487-498.
Gehring, W. J. and Ikeo, K.(1999). Pax 6, mastering eye morphogenesis and eye
evolution. Trends Genet.15, 371-377.
Gibson, G. and Gehring, W.(1988). Head and thoracic transformations caused
by ectopic expression of antennapedia during Drosophila development.
Development102, 657.
Giudicelli, F. and Lewis, J.(2004). The vertebrate segmentation clock. Curr. Opin.
Genet. Dev. 14, 407-414.
Goldbeter, A. and Pourquié, O.(2008). Modeling the segmentation clock as a
network of coupled oscillations in the notch, wnt and fgf signaling pathways. J. Theor. Biol.252, 574-585.
González-Reyes, A. and Morata, G.(1990). The developmental effect of
overexpressing a ubx product in Drosophila embryos is dependent on its interactions with other homeotic products. Cell61, 515-522.
Green, J.(2002). Morphogen gradients, positional information, and Xenopus:
Interplay of theory and experiment. Dev. Dyn. 225, 392-408.
Hobert, O.(2008). Regulatory logic of neuronal diversity: terminal selector genes
and selector motifs. Proc. Natl. Acad. Sci. USA 105, 20067-20071.
Horan, G. S., Wu, K., Wolgemuth, D. J. and Behringer, R. R.(1994). Homeotic
transformation of cervical vertebrae in hoxa-4 mutant mice. Proc. Natl. Acad. Sci. USA 91, 12644-12648.
Iimura, T. and Pourquie, O.(2006). Collinear activation of hoxb genes during
gastrulation is linked to mesoderm cell ingression. Nature442, 568-571.
Iimura, T. and Pourquie, O.(2007). Hox genes in time and space during
vertebrate body formation. Dev. Growth Differ.49, 265-275.
Iimura, T., Denans, N. and Pourquié, O.(2009). Establishment of hox vertebral
identities in the embryonic spine precursors.Curr. Top. Dev. Biol. 88, 201-234.
Isaacs, H. V., Pownall, M. E. and Slack, J. M.(1998). Regulation of hox gene
expression and posterior development by the Xenopus caudal homologue xcad3. EMBO J.17, 3413-3427.
Kessel, M., Balling, R. and Gruss, P.(1990). Variations of cervical vertebrae after
expression of a hox-1.1 transgene in mice. Cell61, 301-308.
Kmita, M. and Duboule, D.(2003). Organizing axes in time and space; 25 years
of colinear tinkering. Science301, 331-333.
Kozmik, Z.(2005). Pax genes in eye development and evolution. Curr. Opin.
Genet. Dev.15, 430-438.
Lewis, E. B.(1963). Genes and developmental pathways. Am. Zool.3, 33-56.
Lewis, E. B.(1978). A gene complex controlling segmentation in Drosophila.
Nature276, 565-570.
Lewis, E. B.(1992). The 1991 Albert Lasker medical awards. Clusters of master
control genes regulate the development of higher organisms. JAMA267, 1524-1531.
Liu, P. Z. and Kaufman, T. C.(2005). Short and long germ segmentation:
unanswered questions in the evolution of a developmental mode. Evol. Dev.7, 629-646.
Lufkin, T., Mark, M., Hart, C. P., Dollé, P., LeMeur, M. and Chambon, P.(1992).
Homeotic transformation of the occipital bones of the skull by ectopic expression of a homeobox gene. Nature359, 835-841.
Lynch, J. A., Brent, A. E., Leaf, D. S., Pultz, M. A. and Desplan, C.(2006).
Localized maternal orthodenticle patterns anterior and posterior in the long germ wasp Nasonia. Nature439, 728-732.
Mann, R. S. and Morata, G.(2000). The developmental and molecular biology of
genes that subdivide the body of Drosophila. Annu. Rev. Cell Dev. Biol. 16, 243-271.
McGinnis, W. and Krumlauf, R.(1992). Homeobox genes and axial patterning.
Cell68, 283-302.
McIntyre, D. C., Rakshit, S., Yallowitz, A. R., Loken, L., Jeannotte, L.,
Capecchi, M. R. and Wellik, D. M.(2007). Hox patterning of the vertebrate rib
cage. Development134, 2981-2989.
Morata, G.(1993). Homeotic genes of Drosophila. Curr. Opin. Genet. Dev.3,
606-614.
Nelson, C. E., Morgan, B. A., Burke, A. C., Laufer, E., DiMambro, E., Murtaugh, L. C., Gonzales, E., Tessarollo, L., Parada, L. F. and Tabin, C.
(1996). Analysis of hox gene expression in the chick limb bud. Development
122, 1449-1466.
Nilsson, D. E. and Pelger, S.(1994). A pessimistic estimate of the time required
for an eye to evolve. Proc. Biol. Sci.256, 53-58.
Olesnicky, E. C., Brent, A. E., Tonnes, L., Walker, M., Pultz, M. A., Leaf, D.
and Desplan, C.(2006). A caudal mRNA gradient controls posterior
development in the wasp Nasonia. Development133, 3973-3982.
Oliveri, P., Tu, Q. and Davidson, E. H.(2008). Global regulatory logic for
specification of an embryonic cell lineage. Proc. Natl. Acad. Sci. USA 105, 5955-5962.
Pearson, J. C., Lemons, D. and McGinnis, W.(2005). Modulating hox gene
functions during animal body patterning.Nat. Rev. Genet.6, 893-904.
Peel, A. D.(2008). The evolution of developmental gene networks: lessons from
comparative studies on holometabolous insects. Philos. Trans. R. Soc. Lond. B Biol. Sci.363, 1539-1547.
Peel, A. D., Chipman, A. D. and Akam, M.(2005). Arthropod segmentation:
beyond the Drosophila paradigm.Nat. Rev. Genet.6, 905-916.
Pownall, M. E., Tucker, A. S., Slack, J. M. and Isaacs, H. V.(1996). efgf, xcad3
and hox genes form a molecular pathway that establishes the anteroposterior axis in Xenopus. Development122, 3881-3892.
Rieke, F., Warland, D., de Ruyter van Steveninck, R. and Bialek, W.(1999).
Spikes: Exploring the Neural Code. Cambridge, MA: The MIT Press.
Rosenberg, M. I., Lynch, J. A. and Desplan, C.(2009). Heads and tails:
evolution of antero-posterior patterning in insects. Biochim. Biophys. Acta1789, 333-342.
Ryan, J. F., Mazza, M. E., Pang, K., Matus, D. Q., Baxevanis, A. D.,
Martindale, M. Q., Finnerty, J. R. and Fay, J.(2007). Pre-bilaterian origins of
the hox cluster and the hox code: evidence from the sea anemone, Nematostella vectensis. PLoS ONE2, e153.
Seo, H.-C., Edvardsen, R. B., Maeland, A. D., Bjordal, M., Jensen, M. F., Hansen, A., Flaat, M., Weissenbach, J., Lehrach, H., Wincker, P. et al.
(2004). Hox cluster disintegration with persistent anteroposterior order of expression in Oikopleura dioica. Nature431, 67-71.
Shannon, C. E. and Weaver, W.(1998). The Mathematical Theory of
Communication. Urbana, IL: University of Illinois Press.
Shippy, T. D., Ronshaugen, M., Cande, J., He, J., Beeman, R. W., Levine, M.,
Brown, S. J. and Denell, R. E.(2008). Analysis of the tribolium homeotic
complex: insights into mechanisms constraining insect hox clusters. Dev. Genes
Evol.218, 127-139.
D
Tkacik, G., Callan, C. G. and Bialek, W.(2008). Information flow and optimization in transcriptional regulation. Proc. Natl. Acad. Sci. USA 105, 12265-12270.
Tkacik, G., Walczak, A. M. and Bialek, W.(2009). Optimizing information flow in
small genetic networks. Phys. Rev. E Stat. Nonlin. Soft Matter Phys.80, 031920.
Tschopp, P., Tarchini, B., Spitz, F., Zakany, J. and Duboule, D.(2009).
Uncoupling time and space in the collinear regulation of hox genes. PLoS Genet.
5, e1000398.
Tzouanacou, E., Wegener, A., Wymeersch, F. J., Wilson, V. and Nicolas, J.-F.
(2009). Redefining the progression of lineage segregations during mammalian embryogenesis by clonal analysis. Dev. Cell17, 365-376.
van den Akker, E., Forlani, S., Chawengsaksophak, K., de Graaff, W., Beck,
F., Meyer, B. I. and Deschamps, J.(2002). Cdx1 and cdx2 have overlapping
functions in anteroposterior patterning and posterior axis elongation.
Development129, 2181-2193.
Wacker, S. A., McNulty, C. L. and Durston, A. J.(2004). The initiation of hox
gene expression in Xenopus laevis is controlled by brachyury and bmp-4. Dev. Biol.266, 123-137.
Weintraub, H., Davis, R., Tapscott, S., Thayer, M., Krause, M., Benezra, R.,
Blackwell, T. K., Turner, D., Rupp, R. and Hollenberg, S.(1991). The myod
gene family: nodal point during specification of the muscle cell lineage. Science
251, 761-766.
Wellik, D. M.(2007). Hox patterning of the vertebrate axial skeleton. Dev. Dyn.
236, 2454-2463.
Wellik, D. M. and Capecchi, M. R.(2003). Hox10 and hox11 genes are
required to globally pattern the mammalian skeleton. Science301, 363-367.
Young, T., Rowland, J. E., van de Ven, C., Bialecka, M., Novoa, A., Carapuco,
M., van Nes, J., de Graaff, W., Duluc, I., Freund, J.-N. et al.(2009). Cdx and
hox genes differentially regulate posterior axial growth in mammalian embryos.
Dev. Cell17, 516-526.
Ziv, E., Nemenman, I. and Wiggins, C. H.(2007). Optimal signal processing in
small stochastic biochemical networks. PLoS ONE2, e1077.
Zuber, M. E., Gestri, G., Viczian, A. S., Barsacchi, G. and Harris, W. A.(2003).
Specification of the vertebrate eye by a network of eye field transcription factors. Development130, 5155-5167.