Enhanced Approach for Resemblance of User
Profiles in Social Networks using Similarity
Measures
Nidhi Goyal1 , Jaswinder Singh21 Master of Technology in CSE, 2Assistant Professor, Department of CSE
Guru Jambheshwar University of Science and Technology, Hisar, India
Abstract: The momentum of Online Social Networking, allows the users to build up the connections with other users of the internet. In order to search the people having similar interests, for a variety of reasons either to personalize the services to the users or for selling purpose of their profiles to advertisers. The concern is to find the best resemblance among the user profiles in online social networks by using similarity measures. The heterogeneous similarity measures can be combined effectively to make enhanced approach. The existing approach lack the embedding of the similarity measures in the attribute algorithm itself. In this paper, firstly the Hybrid Attribute Algorithm is proposed for generating the incidence matrix and then the initial concept of rank order clustering Algorithm is used for assignment of weighted factor to find the best resemblance among the user profiles. After that, it will be decided that which target profiles are best resembling with the source profile and these results will be compared with the old approach which shows the superiority of the proposed approach.
Keywords: Similarity; Resemblance; Social networks; User Profiles; Enhanced approach; Profile matching
I. INTRODUCTION
Online Social Networking is playing a tremendous role in the life of people all over the world. It has become a part of the day to day activities especially young generation. People have better collection of information through social media. Business are flourishing through Social media. The first Social network website, SixDegrees.com was launched and recognized in 1997. It allowed users to create profiles. The list of friends can be seen by the Users. Those characteristics which Classmates.com lacked are enhanced and provided by this SixDegrees.com. As the internet was new and uninteresting tool for the people at that time, this made the website to last only upto 2001. After this the website that launched in 1999 was LiveJournal. This site was for blogging and writing a diary. The website named Ryze launched in 2001 by Scott. The site was having 500,000 members across more than 195 countries. Then came Friendster, Despite its popularity at that time, it failed due to inability of handling so many users [4]. In today’s world the most active users in abundance can be found in social networks like Facebook, Twitter, Linked-In, Instagram[3]. The type of information that the user posts on the sites like Linked-In and Xing is similar in nature and mainly used for commercial relations whereas Facebook is mainly used for making informal and friendly relations. User can have many accounts with the same name and other details or two or more accounts with different names or other information could be related to each other as being accessed and handled by the same user or organization. Users share their information like Date of birth, favorites like music, movies, dances, videos etc. Job applicants also post their data on the different social networking sites which helps the companies to select the profiles resembling with the type of the profile they desire. Duplicate user profiles can be detected using the various similarity measures. Some of the similarity measures are being discussed here.
A. Jaro–Distance
This metric is based upon the number and orders of the matching characters. The Formula for Jaro-Distance[5] is described in equation (1).
240
©IJRASET (UGC Approved Journal): All Rights are Reserved m=No. of matching characters
t= No. of transposed characters
|a1|= Length of the First String
|a2|=Length of the Second String
B. Jaro–Winkler
It is the best metric for short names strings. The similarity between the two strings can be calculated using this metric. It is an extension of Jaro Distance. Jaro-Winkler calculates a normalized score and matching is done based on the matching characters and transpositions. In short, it is a two- step process of matching characters as well as transpositions. It was basically designed for record- linking. The Formula for Jaro Winkler[5] is shown in equation (2)
dw= dj if dj<bt
dw= dj+(lp(1-dj)) otherwise……… .(2)
where bt= threshold and lp is the length of prefix.
C. Cosine Similarity
It works well for the numeric attributes. The Cosine similarity can be computed by dot product of the two vectors and then dividing them by square root of the individual vectors. Equation (3) shows the Cosine Similarity.
D. Approximate String Matching
It means matching of the two strings based on fuzzy logic.
E. Sequence Distance
The distance or dissimilarity between the two sequences can be calculated by using sequence distance. Seq_dist computes pairwise string distances between elements of a and b, where the argument with less elements is recycled. The sequence distance matrix can be computed by seq_dist function in which the rows are taken according to “ a” and columns are taken according to “b” [6].
In this paper, the problem being addressed is providing best resemblance of the target profiles with the source profile and focused on considering the importance of the attributes of the profiles and how heterogeneous similarity measures can be used in the effective way for matching the profiles of the users of the social network. The major contribution in this paper is usage of heterogeneous similarity measures effectively to design hybrid attribute algorithm considering the important profile’s attributes. Using this proposal, the rank can be given to some of the profile attributes using the initial concept of the Rank Order Clustering Algorithm. Various tests and experiments are conducted which shows the dominancy of our proposal in comparison with existing approach. The remainder of the paper is organized as follows. Section II contains the related works, Section III presents the proposed approach for building the incidence matrix by using heterogeneous similarity measures, Section IV discuss the various steps of experimentation and Section V focuses on the evaluation and results of the conducted experiments. Finally concluding remarks are described in Section VI.
II. RELATEDWORK
E.Raad, R.Chbeir and A.Dipanda[1] worked upon the FOAF attributes. There can be many profiles that refer to the same person. In order to find those profiles various similarity measures have been used. The four Components used in the work are: Profile Generator, Profile Retriever, Weight Assignment, Profile Matcher.
V.A.Dabeeru [2] measured the similarity on the basis of professional, social, geographical, educational, shared interests, pages liked in a social network. The identification of the connection between two user profiles and their relative interactive level has been compared. Profile similarity is being discussed step by step and finally computed similarity score on the basis of the String Similarity metrics. New Similarity Score calculation has been done based on threshold value.
Kontaxis et al. [7] contributed for designing of the architecture (Information Distiller, Profile Hunter and Profile Verifier) and implemented a tool to detect cloned profiles in a Linked-In network. The limitation of this system is that it basically used the LinkedIn social network. In this implementation exact string matches are taken in view by the Profile Verifer. Here, Fuzzy String matching could be used.
Akcora et al. [8] proposed a network similarity measure to find the direct connection of the users in the social network through graph structure and also in order to find semantic similarities between users, a similarity measure based on user profile information has been defined.
Khayyambashi and Rizi [9] focused on an approach for detecting social network profile cloning based on attribute similarity and friend network similarity is proposed. This approach with regard to similarity measures among real profile and fake profiles can detect clone profiles in OSNs. By using this approach clone profiles can be detected more accurately.
Jin et al. in [10] demonstrated an active detection framework for detection of cloned profiles. Profile similarity and multiple-faked identities profile similarity. Three step process is being proposed in which first step is searching and separating the identities as a set of profiles. Second step is detection of suspicious profiles using profile similarity measures. Third is detection of looking alike or cloned profiles using the list of the friends. This whole of the detection model detects existing faked identities but cannot defend against ICAs in future.
Bhumiratana [11] demonstrated a model for Automating Persistent Identity Clone in Online Social Networks for exploiting availability weak trust in social networks.
Kiruthiga.S et al. [12] explained a system using Cosine similarity and Jaccard index to measure the similarity between the real and the cloned profile system. Experimental analysis of the Facebook data is also done using the Naïve Bayes Classifier and K-means Clustering algorithm.
N.Goyal et al. [13] explained the work and the researches about the resemblance of the user profiles in social networks.
From the various studies done so far, it has been concluded that there are lot of works done for matching the user profiles likewise Fake id identification, profile cloning, network based similarity measures and profile similarity measures has been discussed in the research papers. Some of the papers focused over comparative analysis of the similarity measures. From this review, the conclusion that can be drawn is that if the heterogeneous profile and attribute similarity measures like Jaro-Winkler, Cosine, Sequence Distance etc. are combined effectively according to the particular attribute category and these get embedded in designing of the algorithm, then it would be helpful in finding best resemblance among the user profiles in the social network.
III. PROPOSEDAPPROACH
The Hybrid Attribute Weight Assignment Algorithm is being proposed in this paper. This algorithm uses heterogeneous similarity measures being discussed above. The different similarity measures are suitably applicable to the particular type of the attribute. The various attributes of the profiles are categorized for particular similarity measure and computed accordingly. Fig. 1 shows the sequence of process of proposed approach.
A. Input
F:Set of the User profiles of the Facebook
242
©IJRASET (UGC Approved Journal): All Rights are Reserved
B. Output
Weight Assignment matrix as a result.
1) Give the set of the Scrapped Degenerated Facebook Dataset as input and compare it with the source profile. 2) Let us take ‘a’ as user profile Attribute to which the weights has to be assigned
3) Assume the threshold for the Jaro-Winkler Similarity as 0.85.
4) Substitute each attribute by a position such that the attribute ‘NAME’ is at Ist position ,attribute ‘GENDER’ at the second position and third for age and so on. Begin
for each Fi in F do for each Fj in F do a in A
if(Fi.a&&Fj..a==1)
then jarosim=call(JaroWinklerSimilarity(Fi.a.v,Fj.a.v))
Check if (jarosim>=0.85) W[a]=1 otherwise W[a]=0 else if (Fi.a&&Fj..a==2)
Hamming= call(Hamming Distance(Fi.a.v,Fj.a.v)) Check if (hamming==1)
then W[a]=0 otherwise W[a]=1
elseif(Fi.a&&Fj..a==3||Fi.a&&Fj..a==5|| Fi.a&&Fj..a==7)
call(approximate string matching((Fi.a.v,Fj.a.v)) else if(Fi.a&&Fj..a==4 || Fi.a&&Fj..a==6 ) call(sequence distance (Fi.a.v,Fj.a.v)) else
print(“Wrong Parameters”) end
[image:5.612.183.430.445.630.2]end end
IV. EXPERIMENTATION
In this section, the framework, tools, approach and steps of experimentation is being elaborated. The conduction of the experiments is fruitful and proved the relevance of our proposal.
A. Experimentation Steps
These are the various steps followed using the tools such as Graph API, JSON to CSV convertor and the R.
1) Profile Scrapping: Data of the profiles is scrapped using Graph API Explorer, conversion of the data into compatible format by designing of Convertor and using the R Tool. Extraction of the Attributes from User Profiles for the Study.
2) Apply Proposed Algorithm on Profile Attributes: Calculation of Similarity between the Source Profile and target Profiles of the users using Heterogeneous Similarity measures. Selection of the particular Similarity measure for a specific attribute. Designing of Hybrid Attribute Weight Assignment algorithm and generation of the incidence matrix.
3) Weighted Factor: Assignment of the Weighted Factor by using Rank-Order Clustering Algorithm. Divide the total weight by sum of the weights in decimal to calculate a normalised Weighted factor i.e. W(F).
4) Similarity Score: Calculation of the Similarity Score and adjusted Similarity Score by applying proposed and Binary Weight Assignment Algorithm on profile attributes and Comparison of the Result using Graphs and tables.
[image:6.612.250.360.328.679.2]B. Framework
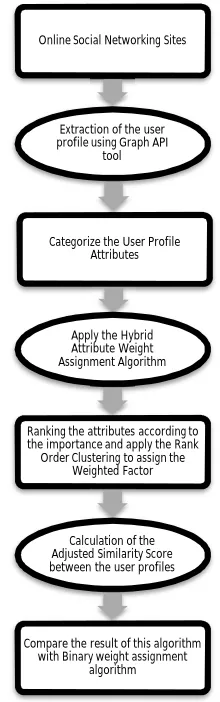
Fig. 2 shows the proposed framework of the research work being carried out.
Fig. 2.Framework of the Research work Online Social Networking Sites
Extraction of the user profile using Graph API
tool
Categorize the User Profile Attributes
Apply the Hybrid Attribute Weight Assignment Algorithm
Ranking the attributes according to the importance and apply the Rank Order Clustering to assign the
Weighted Factor
Calculation of the Adjusted Similarity Score between the user profiles
Compare the result of this algorithm with Binary weight assignment
244
©IJRASET (UGC Approved Journal): All Rights are Reserved
V. EVALUATIONANDRESULTS
The implementation is a step-wise process which depicts how the data sets has been retrieved, on what tool the work has been executed, how the attributes are chosen ,what algorithm is being applied and what result and conclusion are being drawn from this implementation. All the details and the corresponding results have been discussed in this Section. Fig.3 shows the implementation and evaluation modules of the research work.
Take a source Profile ‘N’ and target profiles as J, K, S, B, N1, N2. The normal and adjusted similarity score using HAWA and BAWA can be calculated is shown in Table I and Table II. The normal similarity score is being calculated by using cosine similarity and adjusted is calculated by using the formula given.
[image:7.612.198.414.264.425.2]Here Fx specifies the source profile and Fy specifies the target user profile.
TABLE I. RESULTSOFSIMILARITYMEASURES Normal Similarity Scores
Profile Lists Normal Similarity Score using HAWA Normal Similarity Score using BAWA
N1 0.86 0.86
B 0.86 0.71
N2 0.71 0.57
K 0.57 0.57
J 0.57 0.42
S 0.28 0.14
The Cosine similarity Score shows that the target profiles N1, B and N2 have more similarity with the source profile ‘N’ for HAWA and N1 and B have more similarity for BAWA.
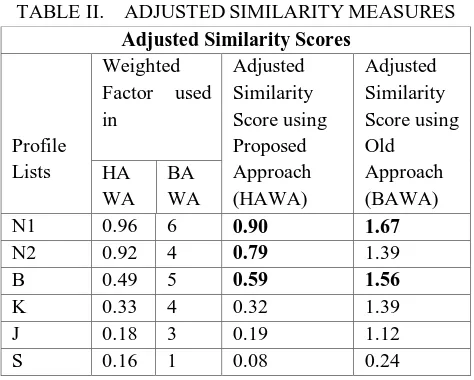
TABLE II. ADJUSTEDSIMILARITYMEASURES Adjusted Similarity Scores
Profile Lists
Weighted Factor used in Adjusted Similarity Score using Proposed Approach (HAWA) Adjusted Similarity Score using Old Approach (BAWA) HA WA BA WA
N1 0.96 6 0.90 1.67
N2 0.92 4 0.79 1.39
B 0.49 5 0.59 1.56
K 0.33 4 0.32 1.39
J 0.18 3 0.19 1.12
S 0.16 1 0.08 0.24
[image:7.612.188.425.465.655.2]algorithm shows that the target profiles which are more closer to the Source profile N are N1 and N2 i.e. Adjusted Similarity Score of 0.90 and 0.79 which indicates that the most resembling Profile is N1 and the second most resembling profile is N2 whereas the Simple binary weight assignment algorithm ended up showing that source profile N is more closer to target profiles N1 and B i.e. Adjusted Similarity Score of 1.67 and 1.56. The real result should show the best resemblance with the target profiles N1 and N2 and the figures are clearly depicting that though the score value calculated through matrix generated from Binary Weight Assignment is high even though Hybrid Attribute Weight Assignment worked and proved best and it is matching to the real world result than old approach which only took in account the matching attributes counting. So, this research focused on quality rather than quantity.
Fig. 3.Implementation module
VI. CONCLUDINGREMARKS
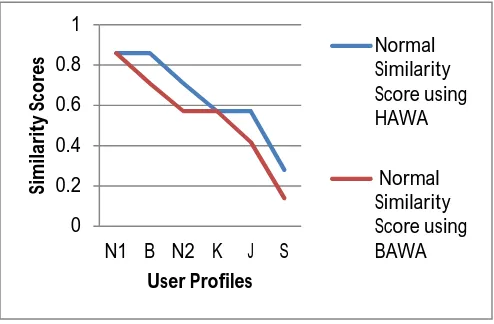
Hybrid Attribute Weight Assignment algorithm the incidence matrix is generated. Weighted factors for the computation is calculated based on the Rank-Order Clustering Algorithm for incidence matrix generated by the Hybrid Attribute Weight assignment algorithm and Weighted factor for the Binary Weight assignment algorithm based on no. of ones in the matrix described in [2]. On calculation of the adjusted Similarity Score from both the methods, it has been seen that the usage of Hybrid Weight Assignment method concluded that the source profile is having best resemblance with profile N1 and N2 whereas usage of the Binary Weight Assignment method concluded that the source profile is having best resemblance with profile N1 and B. In actual, if we analyze the user profiles taken in the Dataset the former result is better than the result produced in the later method. Hence, it concludes that it is important to consider the ranking of the attributes of the user profile for finding the resemblance. The Proposed Approach Hybrid Attribute Weight Assignment combined with already existing Rank-Order Clustering Algorithm worked best for finding the resemblance among the user profiles as compared to the Old approach of Binary Weight Assignment [2]. Both the graphs are shown in Fig. 4 and Fig. 5.The Graph of Adjusted Similarity Score clearly depicts that using Hybrid Attribute Weight Assignment Algorithm, the source profile is finding best resemblance with target profiles N1andN2 which is actual real world result whereas other algorithm finds more resemblance with target profiles N1and B .
Fig. 4.Graph showing Normal Similarity Score 0
0.2 0.4 0.6 0.8 1
N1 B N2 K J S
Si
m
ila
ri
ty
S
co
re
s
User Profiles
Normal Similarity Score using HAWA
[image:8.612.183.430.504.666.2]246
[image:9.612.178.430.99.257.2]©IJRASET (UGC Approved Journal): All Rights are Reserved
Fig. 5.Graph showing Adjusted Similarity Score
REFERENCES
[1] E. Raad, R. Chbeir, and A. Dipanda, “User profile matching in social networks,” in Network-Based Information Systems (NBiS), Japan, 2010, pp. 297–304.
[2] V. Akhila Dabeeru, “User profile relationships using string similarity metrics in social networks,” ArXiv e-prints, vol. 1408, Aug. 2014.
[3] “Social Media Marketing Industry Report.” [Online].Available: http://www.socialmediaexaminer.com/report/.
[4] A. R. Patel, “Comparative study and analysis of social networking sites,” M.S.Thesis, San Diego State University , 2011.
[5] “Jaro–Winkler distance,” Wikipedia, the free encyclopedia. Available:
https://en.wikipedia.org/w/index.php?title=Jaro%E2%80%93Winkler_distance&oldid=721777442 [24-May-2016].
[6] “R: The R Project for Statistical Computing.” [Online]. Available: https://www.r-project.org/.
[7] Kontaxis, Georgios, Iasonas Polakis, Sotiris Ioannidis, and Evangelos P. Markatos. “Detecting Social Network Profile Cloning.” In Pervasive Computing and
Communications Workshops (PERCOM Workshops), 2011 IEEE International Conference on, 295–300. IEEE, 2011.
[8] C. G. Akcora, B. Carminati, and E. Ferrari, “Network and profile based measures for user similarities on social networks,” in 2011 IEEE International Conference
on Information Reuse and Integration (IRI), 2011, pp. 292–298.
[9] Khayyambashi, Mohammad Reza, and Fatemeh Salehi Rizi. “An Approach for Detecting Profile Cloning in Online Social Networks.” In E-Commerce in
Developing Countries: With Focus on E-Security (ECDC), 2013 7th Intenational Conference on, 1–12. IEEE, 2013.
[10] L. Jin, H. Takabi and J. Joshi, ” Towards Active Detection of Identity Clone Attacks on Online Social Networks”, In Proceedings of the first ACM Conference
on Data and application security and privacy, pp. 27-38, 2011.
[11] Bhume Bhumiratana.“A Model for Automating Persistent Identity Clone in Online Social Network,” 681–86. IEEE, 2011. doi:10.1109/TrustCom.2011.87.
[12] K. S, K. S. P, and K. A, “Detecting cloning attack in Social Networks using classification and clustering techniques,” in 2014 International Conference on Recent
Trends in Information Technology (ICRTIT), 2014, pp. 1–6.
[13] Nidhi Goyal and Jaswinder Singh, “A Review on Resemblance of User Profiles in Social Networks using Similarity Measures,” International Journal of Computer, vol. 22, no. 1, pp. 1-8, June 2016.
0 0.5 1 1.5 2
N1 N2 B K J S