Technology (IJRASET)
Nodules Detection Based on Morphological
Operation
Thati Gowthami1, S. MD. Jakheer2
1
Department of ECE, Sri Venkateswara Institute of Science and Technology, Kadapa, India
2
Assistant Professor Department of ECE, Sri Venkateswara Institute of Science and Technology, Kadapa
Abstract: The paper presents the lung nodules detection based on morphological operation. Lung Cancer is one of the most dangerous diseases in medical diagnosis. Lung Computer-Aided Diagnosis (CAD) is a potential method to detect the lung disease, cancer and analysis the cancer progression. The paper follows two stages. Firstly, nodule segmentation based on gray scale thresholding. It is separate the lung diseases from lungs images. Secondly, apply morphological operation. It removes unwanted noise from segmented image. The experimental results shows the better segmentation and analysis of nodules in the CT images.
Keywords Computed Tomography; Lung Image Database Consortium; Morphological Operation; Nodules Segmentation
I. INTRODUCTION
Pulmonary diseases and disorders are one of the major causes of deaths and hospitalization around the world. The American Lung Association estimates that about deaths occur per year in the United States from lung diseases [1]. For noninvasive detection and diagnosis of lung diseases, quantification of the disease severity, and therapy/surgery planning, radiological imaging techniques, particularly computed tomography (CT), are the current standard in the routine clinics. In parallel to the technological advances in imaging, automated computer analysis and decision support systems are often sought by clinicians and radiologists to further assist their diagnostic tasks. Specific to radiological quantification of lung diseases, efficient and robust image analysis tools are required for extracting information pertaining to lung pathology and morphology in a reliable and efficient way. The lung volume of interest containing abnormalities is often the subject of further analysis and; therefore, precise lung segmentation is a precursor to the deployment of such tools for pulmonary image analysis.
Most methods reported in the literature evaluated a subset of pathologies when segmenting lungs. Therefore, a generic solution that can work in routine clinical environment for a wide range of pathologies without expert assistance is not available. Threshold-based methods [2], [3] are often used for their efficiency. However, such methods have limited applicability as they fail to consider the intensity variations due to pathologies or even under normal conditions. Region-based methods, such as region growing [4]–[6], watershed transform [7], [8], graph search and fuzzy connectedness (FC) are found useful in catering for the intensity changes. However, with the presence of dense pathology in the lung field, the intensity alone is not enough for successful delineation.
II. PROPOSED METHOD
The block diagram of proposed method as shown in fig.1. Each block explains in subsection.
Technology (IJRASET)
A. Segmentation using threshold [image:3.612.229.391.609.701.2]Thresholding is the easier method of image segmentation. From a lung image, thresholding can be used to create binary images. The simplest thresholding methods replace each pixel in an image with a 0 pixel i.e black color, if the image intensity is less than some fixed constant T or a white pixel if the image intensity is greater than that constant. In the example image on the right, this results in the dark tree becoming completely black, and the white snow becoming complete white. The algorithm of proposed segmentation as shown below
[row column]=size(im); Gmax=max(max(im)); Gmin=min(min(im)); T0=(Gmax+Gmin)/2; M0=mean(im(find(im<T0))); M1=mean(im(find(im>=T0))); T1=(M0+M1)/2; for i=1:5000 if T1~=T0 T0=T1; M0=mean(im(find(im<T0))); M1=mean(im(find(im>=T0))); T1=(M0+M1)/2; else break end end thresh=T0; for index=1:row*column if im(index)>thresh im(index)=0; end end % figure,imshow(im) % title('After Segmentation')
B. Morphological operation
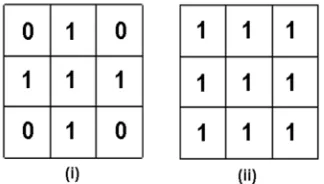
Morphology is a method of image processing operations that process lung images based on shapes. Morphological operations apply a 2*2 structuring element to an input image, creating an output image of the same size. In a morphological operation, the value of each lung pixel in the output image is based on a comparison of the corresponding pixel in the input lung image with its neighbors. By choosing the size and shape of the neighborhood, you can construct a morphological operation that is sensitive to specific shapes in the input lung image.
The paper use the morphological operations are dilation and erosion. Dilation adds pixels to the boundaries of lung objects in an image, while erosion removes pixels on lung object boundaries. The number of pixels added or removed from the lung objects in an image depends on the size and shape of the structuring element in fig 2 used to process the image
.
Technology (IJRASET)
In the morphological dilation and erosion operations, the state of any given pixel in the output image is determined by applying a rule to the corresponding pixel and its neighbors in the input image. The algorithm of morphological operation as shown below im1=im;
im0=im;
for index=1:row*column if im0(index)~=0 im0(index)=1; end
end
im0=logical(im0); im0=imerode(im0); im0=bwlabel(im0); for i=1:row*column if im0(i)~=20 im(i)=0;
end end
% figure,imshow(im) % title('After Extract') im2=im;
C. BW labeling
Image bwlabeling (alternatively connected-component analysis, blob extraction, region labeling, blob discovery, or region
extraction) is an algorithmic application of graph theory, where subsets of connected components are uniquely labeled based on a given heuristic. Connected-component labeling is not to be confused with segmentation.
This is a fast and very easier method to implement and understand. In bwlabelling, once the all pixel of a connected component is found, all the connected pixels of that connected component are bw labelled before going onto the next pixel in the image.
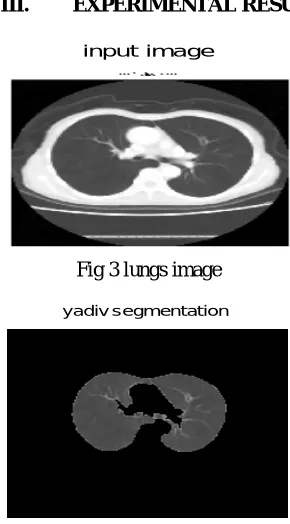
[image:4.612.232.377.450.712.2]III. EXPERIMENTAL RESULTS
Fig 3 lungs image input image
Technology (IJRASET)
IV. CONCLUSION
In this paper, segmentation problems in lung medical imaging modalities especially for CT images are discussed in this paper. The results shows that though segmentation is the accuracy, and most efficent phase yet the outcome is really advantageous in medicine for the perfect diagnosis of any disease. Both the outcomes either from mat lab tool as well as using an algorithm provide the required ROI (region of interest).
REFERENCES
[1] Estimated prevalence and incidence of lung disease Am. Lung Assoc., Washington, DC, Tech. Rep., Apr. 2013.
[2] M. S. Brown, M. F. Mcnitt-Gray, N. J. Mankovich, J. G. Goldin, J. Hiller, L. S. Wilson, and D. Aberie, “Method for segmenting chest CT image data using an anatomical model: Preliminary results,” IEEE Trans. Med. Imag., vol. 16, no. 6, pp. 828–839, Dec. 1997.
[3] G. J. Kemerink, R. J. Lamers, B. J. Pellis, H. H. Kruize, and J. Van Engelshoven, “On segmentation of lung parenchyma in quantitative computed tomography of the lung,” Med. Phys., vol. 25, p. 2432, 1998.
[4] S.G.Armato, III and W. F. Sensakovic, “Automated lung segmentation for thoracic CT: Impact on computer-aided diagnosis,” Acad. Radiol., vol. 11, no. 9, pp. 1011–1021, 2004.
[5] I. Sluimer, M. Prokop, and B. Van Ginneken, “Toward automated segmentation of the pathological lung in CT,” IEEE Trans. Med. Imag., vol. 24, no. 8, pp. 1025–1038, Aug. 2005.
[6] U. Bagci, B. Foster, K. Miller-Jaster, B. Luna, B. Dey,W. R. Bishai, C. B. Jonsson, S. Jain, and D. J. Mollura, “A computational pipeline for quantification of pulmonary infections in small animal models using serial PET-CT imaging,” Eur. J. Nucl.Med.Molecular Imag. Res., vol. 3, no. 55, pp. 1–20, 2013.
[7] J.-M. Kuhnigk, H. Hahn, M. Hindennach, V. Dicken, S. Krass, and H.-O. Peitgen, “Lung lobe segmentation by anatomy-guided 3-D watershed transform,” in Proc. Int. Soc. Opt. Photon. Med. Imag., 2003, pp. 1482–1490.