M E T H O D
Open Access
Determining the quality and complexity of
next-generation sequencing data without a
reference genome
Seyed Yahya Anvar
1,2*, Lusine Khachatryan
1, Martijn Vermaat
1, Michiel van Galen
2, Irina Pulyakhina
1,
Yavuz Ariyurek
2, Ken Kraaijeveld
2,3, Johan T den Dunnen
1,2,4, Peter de Knijff
1, Peter AC
’
t Hoen
1and Jeroen FJ Laros
1,2*Abstract
We describe an open-source kPAL package that facilitates an alignment-free assessment of the quality and comparability of sequencing datasets by analyzingk-mer frequencies. We show that kPAL can detect technical artefacts such as high duplication rates, library chimeras, contamination and differences in library preparation protocols. kPAL also successfully captures the complexity and diversity of microbiomes and provides a powerful means to study changes in microbial communities. Together, these features make kPAL an attractive and broadly applicable tool to determine the quality and comparability of sequence libraries even in the absence of a reference sequence. kPAL is freely available at https://github.com/LUMC/kPAL.
Background
During the past decade, DNA sequencing technologies have undergone notable improvements with great impacts on molecular diagnostics and biomedical and biological research. Today, next-generation sequencing (NGS) tech-nologies can provide insights into sequence and structural variations by achieving unprecedented genome and tran-scriptome coverage. Despite molecular and computational advances, the fast growing developments in library prepar-ation, sequencing chemistry and experimental settings are of concern as they can diversify the complexity and quality of sequencing data [1-3]. To address data quality, most strategies rely on basic statistics of the raw data, such as the quality scores associated with base calling, the total number of reads and average GC content. Technical arte-facts are usually only spotted after mapping of reads to the reference genome. However, such approaches are prone to alignment biases and the loss of potentially valu-able information due to the predisposed and incomplete reference genome sequences [4-6]. These biases are
considerably more problematic in studies of microbiomes as the species diversity can be immense [7], whereas the evaluation of data complexity and quality is limited to the analysis of species for which a reference genome sequence is available.
Analyzing thek-mer (DNA words of lengthk) frequency spectrum of the sequencing data provides a unique per-spective on the complexity of the sequenced genomes, with more complex ones showing a greater diversity in unique sequences and repeated structures. Over- and under-representedk-mers have been associated with the presence of functional or structural elements (such as repetitive, mobile or regulatory elements), negative se-lection, or the hypermutability of CpGs [8-12]. Notably, the prevalence of functional elements and those caused by neutrally evolving DNA (including duplications, in-sertions, deletions and point mutations) is reflected in the modality (number of peaks) of the k-mer frequency spectrum [13,14]. The modality of the human genome is also subjected to its function as all coding regions, including the 5′untranslated regions (UTRs), exhibit a unimodal k-mer spectrum, while the introns, 3′UTRs and other intergenic regions have a multimodal distri-bution [13,14].
* Correspondence:[email protected];[email protected]
1Department of Human Genetics, Leiden University Medical Center, Leiden,
The Netherlands
2Leiden Genome Technology Center, Leiden University Medical Center,
Leiden, The Netherlands
Full list of author information is available at the end of the article
© 2014 Anvar et al.; licensee BioMed Central. This is an Open Access article distributed under the terms of the Creative Commons Attribution License (http://creativecommons.org/licenses/by/4.0), which permits unrestricted use, distribution, and reproduction in any medium, provided the original work is properly credited. The Creative Commons Public Domain Dedication waiver (http://creativecommons.org/publicdomain/zero/1.0/) applies to the data made available in this article, unless otherwise stated.
Anvaret al. Genome Biology (2014) 15:555
In recent years,k-mers have been used in a wide range of applications from the identification of regulatory elements to correction of sequencing errors, genome as-sembly, phylogeny analysis and the search for homolo-gous regions [15-21]. It has also been shown that the characterization and comparative analysis of the k-mer spectrum can provide an unbiased view of genome size and structure, but it can also expose sequencing errors [22]. However, to our knowledge, most tools fail to accommodate for differences in library size and do not reliably expose problematic samples nor provide infor-mation on potential sources of variation in series of se-quencing data. Here, we present a method,k-mer Profile Analysis Library (kPAL), for assessing the quality and complexity of sequencing data without requiring any prior information about the reference sequence or the genetic makeup of the sample. The proposed method uses thedistance betweenk-mer frequencies to measure the level of dissimilarity within or between k-mer pro-files. Since most distance measures are susceptible to differences in library size, we have implemented a series of functions that ensure a more reliable assessment of the level of dissimilarity between k-mer profiles. Based on the same principle, kPAL can identify problematic samples, as their level of similarity reduces in the absence of a significant difference between the genome of the se-quenced samples. In this work, we apply kPAL to four types of NGS data: 665 RNA sequencing (RNA-Seq) samples [23,24], 49 whole genome sequencing (WGS) samples, 43 whole exome sequencing (WES) samples, and a series of microbiomes. We report the sources of technical and biological variation present in each set of NGS data, highlight a series of artefacts that were missed by standard NGS quality control (QC) tools, and demon-strate how the complexity of microbiomes is reflected in theirk-mer profiles.
Results and discussion Principles of kPAL
We developed an open-source package kPAL, which provides a series of tools (such as distance calculation, smoothing and balancing) to investigate the spectrum of
k-mers observed in a given NGS dataset (Figure 1A and Additional file 1: Notes). The resulting k-mer profile holds valuable information on the complexity of the se-quencing libraries and the sequenced genome(s). This is delineated in a graphical representation of the k-mer profiles, which plots the number of k-mers observed at each frequency. The complexity of genomic information is often reflected in the modality of this distribution, mainly due to repetitive and structural elements, and the context-specific composition of k-mers [10,13,14,25]. First, k-mers are processed using efficient binary codes that facilitate a rapid reverse complement conversion
and access to specifick-mers (Figure 1B). Next, kPAL uses the distance between k-mer frequencies as a measure of dissimilarity between twok-mer profiles. In addition, cal-culating the correspondence between the frequencies ofk -mers and their reverse complements aids in assessing the coverage balance between two strands of the sequenced li-brary (Figure 1C). Generally,k-mer profiles can be shrunk to a smallerksize using theshrinkfunction to enable ac-cess to smallerk-mer profiles without the need to repro-cess the sequencing data (Figure 1D). However, it is important to note that large deviations from the originalk
size may obscure the truek-mer frequencies due to lim-ited access to both ends of the sequencing reads (i.e., the last 12 nucleotides can be processed only once in a 12-mer profile whereas the same information is processed seven times in a 6-mer profile). To facilitate pairwise com-parison ofk-mer profiles and account for differences in li-brary sizes, we have implemented complementaryscaling
and smoothing functions. Scaling k-mer frequencies to match the area under the curve of two profiles is a global normalization of thek-mer profiles. The smoothing func-tion borrows the utility of shrinking and applies it locally tok-mers that have a frequency lower than a user-defined threshold, which results in local collapsing of those k-mers to a smaller size (i.e.,k–1) until the threshold condition is met (Figure 1E). For more information and a detailed explanation of kPAL features, see Additional file 1: Notes.
Settingksize
To identify which k provides the best specificity for a mixed sample of bacteria, the k-mer profiles from three modelled metagenomes consisting of 30 bacterial ge-nomes from the Firmicutes and Proteobacteria phyla (in 100:0, 50:50 and 0:100 ratios from each phylum) were compared to ten randomly shuffled sequences (without changing the overall nucleotide composition). The optimal value for k is the one that best separates metagenomes from randomly permuted sets. The overall distance betweenk-mer profiles of the metagenomes and the corresponding randomly permuted sets starts to level off oncekexceeds 10 (Additional file 1: Figure S1). A low amount of variation in distance between thek-mer profiles of metagenomes and their permuted sets indicates that the distance measure is generally robust and only changes according tok. Interestingly, the optimal separ-ation coincides with the kfor which the complete uni-modal spectrum of frequencies (from those that are too rare to those that are highly recurrent) is observed (Additional file 1: Figure S2A,B,C).
(absent k-mers) are observed while genomic spectra for
k≥13 start to lose their multimodality as they become too unique. Thus,k= 12 was used to give a relatively balanced number of nullomers, and unique and frequent k-mers. This allows for the identification of potential artefacts (mainly reflected by rarek-mers) as well as biological and contextual variations. Interestingly, the level of complexity varies between different types of genomic information (WGS, WES and RNA-Seq; see Additional file 1: Figure S3B). In contrast to genomic sequences, the coding part of the human genome exhibits a unimodal profile, as shown before [13,14]. The minor differences be-tween the k-mer profiles of the exome and the tran-scriptome reference sequences are due to the number of shared coding regions between different transcript variants of the same gene. The transcriptome reference
sequences generally exhibit higher counts for observed
k-mers and lower numbers of nullomers introduced by exon–exon junctions. Moreover, the k-mer spectrum derived from sequencing data is in concordance with that of the reference (Additional file 1: Figure S3C). The minor deviations from the unimodality of the ex-ome and transcriptex-ome data are mainly due to the cap-ture performance (off-target reads introduce low-count
k-mers that represent intronic and intergenic regions) and differences in the abundance of expressed mRNA.
[image:3.595.59.540.94.357.2]In addition to the complexity of the genomic informa-tion, the sequencing depth contributes to the modality and the resolution of the k-mer spectrum derived from individual datasets. In RNA-Seq, we observed that the number of 12-nullomers correlates with the total num-ber of reads per dataset (R=−0.80; see Additional file 1:
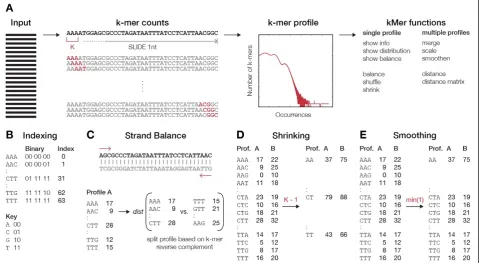
Figure 1Schematic overview of main kPAL principles. (A)An overview of the procedure used by kPAL to assess the frequency of allk-mers within sequencing data.k-mers are identified and counted by a sliding window of sizek. Thek-mer spectrum can then be produced using the
k-mer frequencies. The main functions of kPAL can be divided by their application to single or multiple profiles. For singlek-mer profiles, general information about the number of nullomers, total number of counts, distribution ofk-mer counts and balance between sequencing information from the plus and minus strands can be obtained with dedicated functions. If needed, profiles can be manipulated by thebalance,shuffleand
shrinkfunctions. The balance function uses a sum ofk-mers and their reverse complements to enforce balance between sequence information from the minus or plus strand. The shuffle function is designed to produce randomk-mer profiles without changing the overall distribution of counts.(B)kPAL efficiently processesk-mers, as it encodes the sequences with a binary code using specific keys that can also facilitate a quick conversion to the reverse complement. Each nucleotide is represented by a binary code that is subsequently used to construct eachk-mer.
(C)The strand balance of a givenk-mer profile is the overall distance measure between the frequency of the uniquek-mer and its reverse complement. Thus,k-mer profiles are split into two sub-profiles that are reverse complements of each other and these are used to calculate the strand balance.(D)By design, kPAL can shrinkk-mer profiles of sizekto any smaller size. Counts fromk-mers that share the first (n–1) nucleotides are merged to collapsek-mer profiles to a sizek–1.(E)The smoothing function borrows the utility of shrinking and applies it locally to onlyk-mers that have lower counts than one defined by the user. Thus, for those affected,k-mer counts are merged and dropped to the sizek–1. The smoothing function accepts thresholds for the minimum, maximum or average counts ofk-mers that share the first (n–1) nucleotides but it also accepts user-defined functions. This process reiterates until the threshold condition is met. Prof., profile.
Figure S4A,B). The variation in the total read counts per sample is partly due to study design, as sequencing was performed in seven different laboratories [24]. Thus, the total number of 12-nullomers also varies between samples from different laboratories (Additional file 1: Figure S4C). It is crucial to account for bias introduced by poor and variable coverage, as it may obscure the identification of factors that determine the complexity of the k-mer spectrum. One obvious solution would be to opt for lower
k sizes (i.e.,k= 9) at the expense of specificity. However, we propose the dynamicsmoothingfunction, which is re-silient towards coverage bias and does not sacrifice the specificity of thek-mer spectrum by choosing a smallerk
(Additional file 1: Notes). This function only shrinks the
k-mer profile locally when the counts do not pass prede-fined conditions (i.e., they fall below an acceptable thresh-old for k-mer frequencies). In the next section, we show how kPAL can be used to assess the quality of different types of sequencing data without relying on the availability of a well-characterized reference genome.
Evaluating data quality without a reference
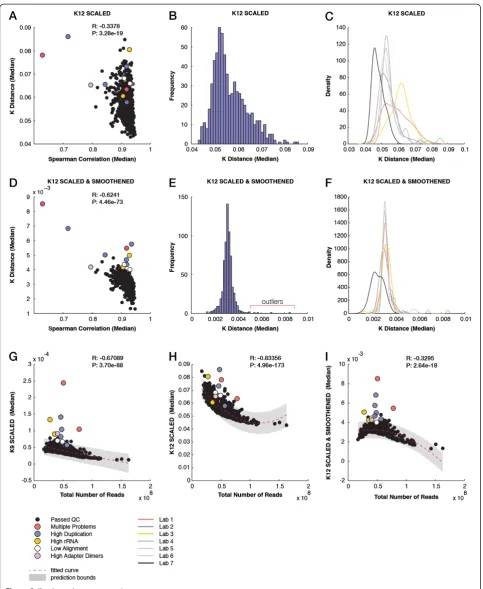
Recently, we showed that performing a pairwise com-parison of 9-mer (K9) profiles, without alignment to the reference sequence, can expose quality issues in RNA-Seq data [24]. The median of all pairwise distances for each sample correlated (R=−0.63) with the correlation measures obtained after alignment and quantification of exon expression levels, which are post-alignment mea-sures often used for QC. Notably, some of the problem-atic samples (due to a high duplication rate and/or high rRNA content) could only be identified by an analysis of their k-mer profiles. However, kPAL scores could not separate all problematic samples. Thus, we performed these analyses for larger values ofkto increase the speci-ficity and investigate whether smoothing can remove biases introduced by variable sequencing depth between samples. For 12-mer (K12) profiles, the distance measures calculated after scaling only showed a much weaker correlation (R=−0.34) with the correlation measures obtained from the exon quantification of samples (Figure 2A). They also displayed a broad distribution with no apparent clustering of known outliers (Figure 2B). We also observed a variation between samples based on the laboratory in which the sequencing was performed, mainly reflecting the library size differences (Figure 2C and Additional file 1: Figure S5A). After smoothing the
k-mer profiles, the k-mer pairwise distances were in good concordance (R=−0.62) with the correlation mea-sures of the exon quantifications obtained after align-ment (Figure 2D). Smoothed K12 profiles exhibited a narrow distribution, having known problematic samples as only outliers (Figure 2E). Importantly, the variation between laboratories was significantly reduced as the
dynamic smoothing function can accommodate differ-ences in library size (Figure 2F and Additional file 1: Figure S5B). These median pairwise distances were far less sensitive to differences in the total read counts per sample than distances obtained from scaled 9-mer and 12-mer profiles (R=−0.33, −0.67 and −0.83, respectively; Figure 2G,H,I). Moreover, the number of known problem-atic samples that fall outside the 95% prediction bounds is improved to 11 (out of 12) in smoothed K12 distances compared to that of K9 and K12 (eight and five, respect-ively). The sample NA18861.4 has by far the highest dis-tance to other samples in both K9 and smoothed K12 analyses (Figure 2G,I). We have previously reported that this sample has a significant genomic DNA contamin-ation since only 4% of reads mapped to exons [24]. This contamination can affect the complexity of the sequenced library as many reads represent the non-coding and re-petitive regions of the genome. Whereas samples that passed the QC measures exhibited k-mer spectra that reflected the expected modality of the transcriptome (Additional file 1: Figure S6A), the distribution of k -mer frequencies in NA18861.4 clearly mimicked that of the full human reference genome (Additional file 1: Figure S6B).
Figure 2(See legend on next page.)
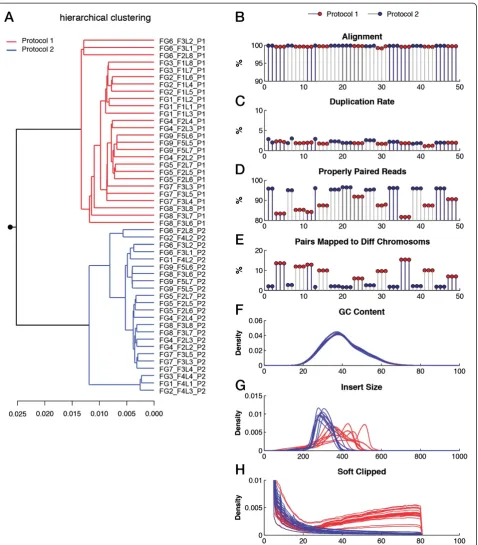
using the first protocol (Figure 3H). We ruled out the influence of aligner as the results obtained from three different aligners (Stampy, BWA and Bowtie2) were in concordance (Additional file 1: Figure S9A,B). Library chimeras and erroneous bases can potentially introduce artificialk-mers and therefore enrich for rare features in the k-mer spectrum. This is supported by the k-mer profiles of the samples from the two library preparation protocols (Additional file 1: Figure S10). These artefacts can be detrimental to downstream analysis as the se-quencing library partially represents artificial fragments. In WES datasets, we identified four clusters after applying principal component analysis (PCA) on the distances obtained from a pairwise comparison of smoothed 12-mers (Figure 4A). Principal component 1 (PC1) separated samples based on the rate of on-target reads (reads that map to the exons for which probes were designed). The low level of reads on target is the result of poor capture performance and not of low sequen-cing depth (Additional file 1: Figure S11A,B). Interestingly, PC2 separates the successful WES datasets (69.9% on-target reads, on average) based on the type of capture kit (Agilent or Nimblegen) that was used during the library preparation (Figure 4A). The third principal component separates out a single failed dataset, WE10_F1L3_NIM. This dataset has multiple problems since the rate of on-target reads is only 3.7% and the duplication rate is as high as 80%. The extreme level of duplication significantly af-fects the balance of coverage on the plus and minus strands of the reference genome. Therefore, the k-mer profile remains imbalanced since mostk-mers and their reverse complements have different frequencies. While the hierarchical clustering concords with that of PCA, we observed another sub-clustering among failed sam-ples in which samsam-ples with only 11.3% of reads on target were separated from those that exhibit an on-target rate of 49.8% (Figure 4B). The influence of poor capture performance on k-mer profiles is evident from the k -mer frequency distributions, as those with poor cap-ture performance begin to mimic that of the full genome (Additional file 1: Figure S12A,B), due to an increase in the number of off-target reads. The multimodality of these spectra is the result of off-target reads that map to non-coding and repetitive regions [13]. Notably, samples that
passed QC could be separated by the capture kit used during library preparation as a result of differences be-tween the targeted regions of capture kits (Additional file 1: Figure S12C).
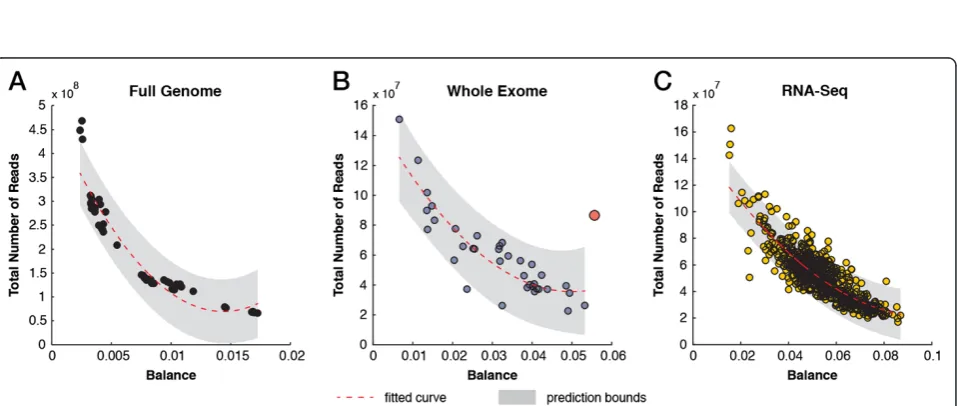
The analysis of balance between the frequency ofk-mers and their reverse complement can expose library biases and provide a measure for estimating an optimal se-quencing depth to ensure comparable and sufficient coverage on both strands (Additional file 1: Notes). In human WGS datasets, the balance curve begins to level off as datasets exceed 400 million reads, which represents an approximately 12-times coverage of an entire human genome (Figure 5A). Although the balance curve did not saturate in our WES set, we picked up WE10_F1L3_NIM as an outlier since the expected balance distance is roughly 0.015 for datasets with a comparable number of reads (Figure 5B). This sample suffers from multiple prob-lems. However, its extreme level of duplications (80%) contributes to the imbalanced coverage on the plus and minus strands (Additional file 1: Figure S13). In the RNA-Seq set, the change in balance begins to level off at the 140 million reads mark (Figure 5C). Of course, this ap-proach will not hold for strand-specific RNA-Seq runs. These data can now be used to assess whether an inde-pendent sequencing run has the expected balance distance and, thus, whether sufficient sequencing depth has been achieved.
Comparative analysis of kPAL performance
We benchmarked the performance of kPAL in the iden-tification of problematic samples by comparing the QC analysis of kPAL on a subset of WGS, WES and RNA-Seq samples with results from the Preqcfunction of the recently developedk-mer based String Graph Assembler (SGA) [22]. SGA can estimate genome size, insert size distribution, repeat content and heterozygosity of a se-quenced genome as well as the error rate and its poten-tial consequence in de novo assembly. Unlike kPAL, SGA does not perform a pairwise comparison between
k-mer profiles obtained from multiple datasets. Thus, we compared SGA’s performance to that of kPAL based on the identification of known problematic samples, using SGA’s estimated genome size, fragment size distribution and the overall error rate. A further evaluation of SGA
(See figure on previous page.)
Figure 2Evaluating data quality for mRNA sequencing samples across different laboratories. (A)Scatter plot showing for each sample the median pairwise Spearman correlation for exon quantification and the mediank-mer distance measures (Kdistance) after scaling. Problematic samples are highlighted in different colors.(B)Histogram of medianKdistance (scaled) for each individual sample.(C)Distribution of medianK
distance (scaled) for each sequencing laboratory (indicated by different colors).(D)Scatter plot of median pairwise Spearman correlation between exon quantification andKdistance (smoothed and scaled).(E)Histogram of medianKdistance (smoothed and scaled) for each individual sample.
(F)Distribution of medianKdistance (smoothed and scaled) for each sequencing laboratory (indicated by different colors).(G)Scatter plot of the total number of reads per sample versus theKdistance of 9-mers (scaled). The poly2 fitted line and the 95% confidence intervals are indicated.
Figure 3Data quality and the influence of library preparation protocol in whole genome sequencing data. (A)Hierarchical clustering of pairwisek-mer distance measures across WGS samples. Samples prepared using different protocols are indicated in different colors.(B)Percentage of aligned reads per sample. Black and grey bars separate samples from different individuals. Red and blue circles indicate the choice of library preparation protocol.(C)Percentage of duplicated reads.(D)Percentage of properly paired reads.(E)Percentage of paired reads that map to different chromosomes.(F)Distribution of average GC content per read. Samples prepared using different protocols are colored accordingly.
(G)Distribution of estimated insert size.(H)Distribution of the number of base pairs that are soft clipped from reads during the alignment. Diff, different; WGS, whole genome sequencing.
Figure 5Detecting the balance in coverage depth of plus and minus strands in sequencing data. (A)Scatter plot of distance between the frequencies ofk-mers and their reverse complement (balance) versus the total number of reads in WGS data. The poly2 fitted line and the 95% confidence intervals are indicated.(B)Scatter plot of balance versus the total number of reads in WES data. The red circle indicates an outlier with an extreme duplication rate and imbalance of coverage between the plus and minus strands.(C)Scatter plot of balance versus the total number of reads in RNA-Seq data. RNA-Seq, RNA sequencing; WES, whole exome sequencing; WGS, whole genome sequencing.
on the selected datasets is presented in Additional file 1: Figures S14–S17.
In WGS data from the first sample (FG1), SGA con-firmed the bimodal insert size distribution of libraries that were prepared based on the first protocol (Additional file 1: Figure S15). Moreover, sequencing data from the two li-brary preparation protocols could be separated based on the position of the first occurring sequencing errors (Additional file 1: Figure S14A). This is in concordance with kPAL results and the presence of a higher level of library chimeras that led to the introduction of artificial and rarek-mers.
The selected WES data consists of two samples with failed capture (WE01_F1L1_NIM and WE02_F1L1_NIM), one sample with multiple problems (WE10_F1L3_NIM), and four samples with acceptable quality that were prepared using Agilent or Nimblegen capture kits (WE13_F2L2_AGI, WE14_F2L1_AGI, WE36_F4L1_ NIM and WE37_F4L1_NIM). SGA identified the prob-lematic sample WE10_F1L1_NIM, which suffers from an extremely high duplication rate and a very low number of on-target reads (Additional file 1: Figure S14B). The esti-mated genome size or duplication rate did not further as-sist in identifying problematic samples and the position of the first sequencing error seems to be obscured by the low coverage of off-target reads that may resemble erroneous sequences. Together, identification of problematic samples by SGA is less reliable for WES data than whole genome shotgun sequences.
For RNA-Seq data, we selected two samples that passed all quality measures (HG00096.1 and HG00108.7) and four failed samples with different underlying problems (HG00329.5: high duplication; NA12546.1: high rRNA; NA18858.1: poor alignment and NA18861.4: high gen-omic DNA contamination). SGA’s genome size estima-tion is designed for WGS data and, therefore, applying SGA on RNA-Seq data should provide an estimate of the expressed part of the genome. Genomic DNA con-tamination artificially increases the expressed part of the genome and allowed SGA to identify NA18861.4 as a problematic sample (Additional file 1: Figure S14C). SGA could not reliably identify HG00329.5 as a sample with an exceptionally high duplication rate (Additional file 1: Figure S14C). Unlike kPAL, the SGA analysis could not identify the other problematic RNA-Seq samples.
Detecting data complexity
The complexity of sequencing libraries is reflected in the
k-mer spectrum as k-mer frequencies often represent functional or structural elements of the associated gen-ome. For metagenomes, the abundance of different bac-teria diversifies the frequency of k-mers, which can be used to differentiate microbiome communities. To investi-gate the application of kPAL in the comparative analysis
of microbiomes, we first simulated a series of metagen-omes with different copy number for three closely related bacterial genomes: Bifidobacterium animalis subspecies
lactis (NC_017834.1), Bifidobacterium animalis subspe-ciesanimalis(NC_017867.1) andBifidobacterium adoles-centis (NC_008618.1). The selected genomes have a comparable genome size of approximately 2 Mbp. The level of homology betweenBifidobacterium animalis sub-species lactis and Bifidobacterium animalis subspecies
animalis is estimated to be between 85% and 95% [27]. The genomes of these bacteria are represented in copies of 6:0:0, 3:3:0 and 2:2:2. The distances from a pairwise comparison of 10-mer profiles show an interesting pattern (Figure 6A). Within the three-dimensional space of indi-vidual species, datasets with six copies of a single genome lie within a main triangular space bounded by the absolute minimum distance to their corresponding species. The second triangular space holds datasets that have three copies of two genomes while the dataset with two copies of all genomes sits in the middle of the three-dimensional space (Figure 6A). The relatedness of these datasets relies on the number of rarek-mers that could differentiate the abundance of different species within each set.
Next, we explored the capability of kPAL in resolving the composition of a more complex series of simulated metagenomes. Without considering the phylogeny, 30 bacterial genomes were selected from both the Firmi-cutes and Proteobacteria phyla and used to construct 31 datasets where the first set comprises 30 genomes from the Firmicutes phylum. The sequence content of each set was subsequently shifted to the Proteobacteria phylum by single genome substitutions (Additional file 1: Table S2). Thus, the 31st dataset consists of 30 genomes from only the Proteobacteria phylum. After performing the pairwise distance comparison on 10-mer profiles, datasets were plotted based on their distance to each phylum (Figure 6B). Notably, the order of the datasets concords with the num-ber of genomes from each phylum. Although the modelled metagenomes do not reflect the true relative abundance of these bacteria, they allow us to assess whether kPAL can resolve the level of similarity between a series of modelled metagenomes. Distances betweenk-mer profiles generated on the 16S rDNA also confirm the relative similarity of datasets with a slightly smoother transition. This is mainly due to the limited amount of genomic information that is available in 16S rDNA and different rate of evolution compared to the entire genome.
We used the previously published data by Caporasoet al. [28] to evaluate further the performance of kPAL in resolving microbiomes. The gut and right-palm micro-biomes of a male individual and a female individual were sequenced over a period of 6 months. For this analysis, we only included samples that were collected on the same day from both individuals (122 gut microbiomes
and 128 right-palm microbiomes). Furthermore, we also excluded 14 samples that were classified as being mis-labeled using a random forest classifier as described by Caporasoet al. [28]. Pairwise distances were calculated for samples from each body part using kPAL (using 10-mer profiles) and UniFrac [29], which relies on the characterization of operational taxonomic units and inferred phylogeny. UniFrac parameters were set to those specified in the original paper [28]. The agree-ment between the expected clusters (based on the ori-gin of samples) and that obtained from distance matrices was estimated using the weighted kappa index (Kw). PCA analysis of k-mer distance matrices from gut (Figure 6C) and right-palm (Figure 6D) microbiomes revealed that samples from each individual could be sepa-rated using the kPAL approach (Kw= 0.95 and 0.82, re-spectively). In addition, PC2 and PC3 indicate that temporal changes in the microbiomes of each individual influence the relative distances between datasets. We also noticed that datasets from the first 12 days of right-palm microbiomes from the male individual cluster with female samples. This can be caused by possible contam-ination or sample swapping. Gut microbiomes could also be resolved using UniFrac (Figure 6E), with Kw= 0.94. Concordant to the kPAL results, PC2 and PC3 jointly order samples based on the sampling day. However, UniFrac failed to differentiate right-palm microbiomes based on their origin (Kw= 0.47) with no apparent pattern corresponding to the day on which samples were collected (Figure 6F).
Conclusions
The continued decrease in sequencing costs and techno-logical development have overtaken our ability to assess the quality of data and the complexity of sequencing li-braries robustly. For instance, many QC steps that are essential for accurate downstream analysis of NGS data are often neglected in the absence of a reliable reference genome. In addition, NGS data are always subjected to some degree of technical and run-to-run variation, which can hamper the interpretation of the genetic makeup of the sequenced sample. As shown here, vari-ations introduced during library preparation can have a significant influence on the complexity and quality of the sequencing data.
So far,k-mer profiles have been used in a wide range of applications, such as the identification of regulatory elements, error correction of sequencing reads, identi-fication of point mutations, whole genome assembly, searches for homologous regions and phylogenetic ana-lysis [15-21,30,31]. A number ofk-meranalysis tools are capable of efficiently generatingk-mer profiles (such as Jellyfish [32] and khmer [33]), and the recent work of Simpson [22] proposes a novel method to estimate the repeat content, genome size, heterozygosity of the se-quenced genome, insert size distribution and estimated level of erroneous reads in sequencing data using a k -mer approach. Although SGA provides valuable infor-mation on the genetic makeup and quality of sequen-cing data, it cannot reliably identify outliers from a series of NGS data or provide information on potential sources of variation. Thus, in the absence of a well-characterized reference sequence, there is an urgent need for tools that can characterize potential biases such as sample swapping, library chimeras, high dupli-cation rates and potential contamination. In this work, we introduce a new strategy for determining the quality and complexity of a variety of different NGS datasets without any prior information about the reference se-quence. The kPAL package consists of a variety of tools to generate k-mer frequencies and enables pairwise comparisons. kPAL measures the level of similarity be-tween multiple NGS datasets, based on the genomic in-formation that is shared between them. We show that kPAL outperforms pre-alignment QC tools (such as FastQC) in reliably exposing samples that suffer from poor capture performance, contamination, enrichment of library chimeras or other types of artefact. Even though the last step in assessing data quality by FastQC involves the analysis of overrepresented 5-mers, FastQC fails to identify problematic samples due to the low k -mer size and the way k-mer profiles are processed. In contrast, tools that rely on aligned reads (such as RNA-SeQC [34] and the Picard toolkit) can expose the major-ity of these technical artefacts, though some of them still require a thorough and vigorous assessment to be identified. The Preqc feature of SGA performs well on WGS data and can precisely estimate insert size distri-bution and expose erroneous reads. However, the per-formance of SGA on other types of NGS data, such as
[image:11.595.58.543.89.103.2](See figure on previous page.)
Figure 6Resolving the level of relatedness between microbiomes. (A)Three-dimensional scatter plot of thek-mer distance measures for a series of metagenomes with different copy number of three closely related species.(B)Scatter plot of the relative distance between Firmicutes and Proteobacteria phyla. Each data point represents a metagenome with a differing number of species from each phylum. Data points are colored according to the number of species from each phylum.(C)PCA plot of pairwisek-mer distance measures for gut microbiomes. Data points are colored based on the origin of the sample (male in blue and female in red) and time.(D)PCA plot of pairwisek-mer distance measures for right-palm microbiomes.(E)PCA plot of pairwise UniFrac distance measures for gut microbiomes.(F)PCA plot of pairwise UniFrac distance measures for right-palm microbiomes. PCA, principal component analysis.
WES and RNA-Seq, is less reliable since it was originally developed for pre-processing, error correction and de novoassembly of whole genome sequences. The lack of a pairwise comparison and accommodation for differ-ences in library size limits the application of SGA in quality assessment and measuring the level of dissimi-larity betweenk-mer profiles of sequenced samples. The unique feature of kPAL is its ability to account for biases introduced by differences in sequencing depth between samples to expose outliers and problematic samples and that, like SGA, it does not rely on prior information. Po-tential applications of this strategy are to determine the quality of sequencing data, estimate the sequencing depth required forde novoassembly projects and identi-fying sequencing reads that represent the uncharacter-ized regions of the genome of a given species.
Most microbiome studies have focused on phylogenet-ically informative markers such as 16S rDNA to reveal the relative composition and diversity of the metagen-ome in question (reviewed in [7,35]). Despite the effi-ciency of such approaches, amplicon-based studies lack the ability to provide a genome-wide characterization of microbiomes. Moreover, sequencing errors and the pres-ence of library chimeras can hamper the analysis of microbiomes using conventional tools, as only a handful of reads may be produced from any given fragment. This results in unreliable operational taxonomic units, which are often used in microbiome studies. The advantage of our approach is that it can potentially discriminate be-tween different species of a common phylum by relying on sequence content beyond the resolution of 16S rDNA sequences. We show that the similarity of microbiomes based on their composition and diversity can be revealed using kPAL, which is purely founded upon the sequen-cing data alone. In contrast, although UniFrac could reli-ably resolve rather stable gut microbiomes, it struggled with resolving highly diverse and dynamic microbiomes, such as those obtained from skin (i.e., the palm). We show that kPAL is sensitive to temporal changes in microbiomes and can potentially be used for a wide range of applications, such as forensic DNA fingerprint-ing. It is important to note that further developments are required for reliable assessment of temporal changes in a microbial community using the kPAL approach. Al-though kPAL does not provide a biological reason for the sources of variation within and between datasets, it opens the way to a more accurate and unbiased determination of the quality and complexity of genomic sequences.
Materials and methods kPAL implementation
kPAL is a Python-based toolkit and programming library that provides various tools, many of which are used in this study. kPAL is an open-source package and can be
downloaded [36-38]. kPAL can also be installed (includ-ing all prerequisites) through the command line us(includ-ing: pip install kPAL. Detailed documentation and tutorials are available [39]. For detailed a description of the kPAL methodology, refer to Additional file 1: Notes. The per-formance of kPAL, in terms of speed and memory usage, for generating and pairwise comparison ofk-mer profiles is provided in Additional file 1: Figure S18.
Creatingk-mer profiles
Thek-mer profiles were generated using theindex func-tion built into kPAL. For all analyseskwas set to 12 ex-cept when otherwise stated. To accommodate for the analysis of both sequencing reads and genome reference sequences, we have chosen to use the FASTA format as an input to kPAL. However, we provide a command-line tool to convert FASTQ files to the appropriate format [40]. For paired-end data, the profiles for both reads were merged into a singlek-mer profile using the kPAL
merge function. For more information on performance, runtime and memory usage, see Additional file 1: Notes.
Measuring pairwise distances
The matrix function was used in combination with the
scaleand/orsmoothoptions to measure the distance be-tween twok-mer profiles. The pairwise distance between profiles was calculated using the multiset distance meas-ure [41]. This measmeas-ure was parameterized by a function that reflects the distance between two elements in a multi-set, in this case the difference between frequencies of spe-cifick-mers. The following function was used to calculate the distances after applying thescaleandsmoothoptions.
f xð ;yÞ ¼ jx−yj xþ1
ð Þðyþ1Þ
For further information about the procedure, refer to Additional file 1: Notes.
Calculating thek-mer balance
For all samples in this study, the balance between the frequencies of k-mers and their reverse complement were found using the showbalance function in kPAL (see Additional file 1: Notes). For all paired-end datasets,
k-mer profiles were first merged and then assessed for their balance.
Statistical analysis
the distance matrices provided by thek-mer profile or UniFrac [29] analyses. Subsequently, the accuracy of the clustering arrangement was assessed based on the silhouette [42] and weighted kappa [43] measures.
Library preparation and sequencing
For WGS datasets, two separate library preparation pro-tocols were used. The gDNA libraries for full genome libraries were prepared using the reagents from a True-Seq DNA Sample Prep Kit according to the manufac-turer’s instructions (TrueSeq DNA Sample Preparation Guide, revision C; Illumina Inc., San Diego, CA) with minor modifications. After the ligation, the first proto-col uses a gel-free method for samples instead of a gel step that was used for the second protocol. Further-more, the number of PCR cycles in the PCR enrichment step differs between the two protocols (five and ten cy-cles, respectively). A High Sensitivity DNA chip (Agilent Technologies 2100; Santa Clara, CA) was used for quanti-fication and samples were subsequently sequenced on an Illumina HiSeq 2000 sequencer at the same laboratory.
Libraries for the WES samples were prepared using the Agilent SureSelect Kit (Agilent Technologies, Santa Clara, CA), Nimblegen Capture Kit V2 or Nimblegen Capture Kit V3 (Roche NimbleGen Inc., Madison, WI), according to the manufacturer’s instructions. A High Sensitivity DNA chip (Agilent Technologies 2100) was used for the quantification and the samples were subsequently sequenced on an Illumina HiSeq 2000 sequencer at the same laboratory.
The library preparation and sequencing of all RNA-Seq samples are described elsewhere [23,24].
Pre-processing
FastQC was run for all samples prior to analysis to assess the quality of the data. However, none of the sequencing data was removed from the analysis as they all passed the FastQC quality measures. Reads were trimmed for low quality bases (Q< 20) using sickle [44] and cleaned up for adapters.
Alignment
Alignment to the human reference genome was per-formed for WGS and WES using Stampy [45], BWA [46] and Bowtie 2 [47] with default parameters. For the WES samples, the number of on-target reads was calcu-lated using the BEDTools [48] intersect, BAM files and a BED track consisting of all targets according to the man-ufacturer’s guidelines. Reads with no overlapping base were considered as off target. Basic alignment statistics (such as alignment rate, the fraction of properly paired reads, etc.) were extracted using SAMtools [49] flagstat. For WGS samples, the insert sizes were estimated using the Picard toolkit [50]. The number of base pairs that
were soft clipped during the alignment was extracted from the SAM files using a custom script.
SGA comparison
QC and exploration of data properties were performed using thePreqcmodule of the SGA software. All analyses were performed according to SGA guidelines [22].
Data availability
For the WGS and WES data, the FASTQ and BAM files have been deposited at the European Genome-phenome Archive [51], which is hosted by the European Bio-informatics Institute, under the accession number [EGA:S00001000600]. In addition, all k-mer profiles are available under the same accession.
For the RNA-Seq data, thek-mer profiles can be found online [52]. The FASTQ files and BAM alignments as well as different types of quantification are available in Array Express under accessions E-GEUV-1 (mRNA) and E-GEUV-2 (small RNA) for QC-passed samples and E-GEUV-3 for all sequenced samples [53-55].
Microbiomes were obtained from the‘Moving Pictures of the Human Microbiome’project [MG-RAST:4457768.3-4459735.3] [28].
Additional file
Additional file 1:Supplemental notes, figures and tables.
Abbreviations
kPAL:k-mer Profile Analysis Library; Mbp: Megabase pairs; NGS: Next-generation sequencing; PCA: Principal component analysis; PCR: Polymerase chain reaction; QC: Quality control; RNA-Seq: RNA sequencing; SGA: String Graph Assembler; UTR: Untranslated region; WES: Whole exome sequencing; WGS: Whole genome sequencing.
Competing interests
The authors declare that they have no competing interests.
Authors’contributions
SYA, LK, MV, MvG, IP and PACtH performed the analyses. SYA and JFJL designed the study and JFJL developed the tool. KK and YA
performed the wet-lab experiments and the sequencing. SYA, PACtH, JTdD, PdK and JFJL coordinated the study. SYA drafted the manuscript that was subsequently revised by all co-authors. All authors read and approved the final manuscript.
Acknowledgements
We thank Dr Jelle Goeman and Dr Erik W. van Zwet for their help, advice and input. This work was partially supported by the European Community’s Seventh Framework Program (FP7/2007-2013) GEUVADIS (grant 261123), the Center for Medical Systems Biology and the Center for Genome Diagnostics in the Netherlands.
Author details
1Department of Human Genetics, Leiden University Medical Center, Leiden,
The Netherlands.2Leiden Genome Technology Center, Leiden University Medical Center, Leiden, The Netherlands.3Department of Ecological Science,
VU University Amsterdam, Amsterdam, The Netherlands.4Department of Clinical Genetics, Leiden University Medical Center, Leiden, The Netherlands.
Received: 6 October 2014 Accepted: 27 November 2014
References
1. Goldstein DB, Allen A, Keebler J, Margulies EH, Petrou S, Petrovski S, Sunyaev S:Sequencing studies in human genetics: design and interpretation.Nat Rev Genet2013,14:460–470.
2. Nekrutenko A, Taylor J:Next-generation sequencing data interpretation: enhancing reproducibility and accessibility.Nat Rev Genet2012,
13:667–672.
3. Costello M, Pugh TJ, Fennell TJ, Stewart C, Lichtenstein L, Meldrim JC, Fostel JL, Friedrich DC, Perrin D, Dionne D, Kim S, Gabriel SB, Lander ES, Fisher S, Getz G:
Discovery and characterization of artifactual mutations in deep coverage targeted capture sequencing data due to oxidative DNA damage during sample preparation.Nucleic Acids Res2013,41:e67.
4. Alkan C, Coe BP, Eichler EE:Genome structural variation discovery and genotyping.Nat Rev Genet2011,12:363–376.
5. Kidd JM, Sampas N, Antonacci F, Graves T, Fulton R, Hayden HS, Alkan C, Malig M, Ventura M, Giannuzzi G, Kallicki J, Anderson P, Tsalenko A, Yamada NA, Tsang P, Kaul R, Wilson RK, Bruhn L, Eichler EE:Characterization of missing human genome sequences and copy-number polymorphic insertions.
Nat Methods2010,7:365–371.
6. Li H, Homer N:A survey of sequence alignment algorithms for next-generation sequencing.Brief Bioinform2010,11:473–483. 7. Kuczynski J, Lauber CL, Walters WA, Parfrey LW, Clemente JC, Gevers D,
Knight R:Experimental and analytical tools for studying the human microbiome.Nat Rev Genet2012,13:47–58.
8. Subramanian S, Kumar S:Neutral substitutions occur at a faster rate in exons than in noncoding DNA in primate genomes.Genome Res2003,
13:838–844.
9. Sved J, Bird A:The expected equilibrium of the CpG dinucleotide in vertebrate genomes under a mutation model.Proc Natl Acad Sci U S A
1990,87:4692–4696.
10. Csuros M, Noe L, Kucherov G:Reconsidering the significance of genomic word frequencies.Trends Genet2007,23:543–546.
11. Acquisti C, Poste G, Curtiss D, Kumar S:Nullomers: really a matter of natural selection?PLoS One2007,2:e1022.
12. Josse J, Kaiser AD, Kornberg A:Enzymatic synthesis of deoxyribonucleic acid. VIII. Frequencies of nearest neighbor base sequences in deoxyribonucleic acid.J Biol Chem1961,236:864–875.
13. Chor B, Horn D, Goldman N, Levy Y, Massingham T:Genomic DNA k-mer spectra: models and modalities.Genome Biol2009,10:R108.
14. Hariharan R, Simon R, Pillai MR, Taylor TD:Comparative analysis of DNA word abundances in four yeast genomes using a novel statistical background model.PLoS One2013,8:e58038.
15. Jiang B, Liu JS, Bulyk ML:Bayesian hierarchical model of protein-binding microarrayk-mer data reduces noise and identifies transcription factor subclasses and preferredk-mers.Bioinformatics2013,29:1390–1398. 16. Liu Y, Schroder J, Schmidt B:Musket: a multistagek-mer spectrum-based
error corrector for Illumina sequence data.Bioinformatics2013,29:308–315. 17. Chae H, Park J, Lee SW, Nephew KP, Kim S:Comparative analysis using
K-mer and K-flank patterns provides evidence for CpG island sequence evolution in mammalian genomes.Nucleic Acids Res2013,41:4783–4791. 18. Kelley DR, Schatz MC, Salzberg SL:Quake: quality-aware detection and
correction of sequencing errors.Genome Biol2010,11:R116.
19. Chikhi R, Medvedev P:Informed and automatedk-mer size selection for genome assembly.Bioinformatics2013,30:31–37.
20. Brazma A, Jonassen I, Vilo J, Ukkonen E:Predicting gene regulatory elementsin silicoon a genomic scale.Genome Res1998,8:1202–1215. 21. Sims GE, Jun SR, Wu GA, Kim SH:Alignment-free genome comparison with feature frequency profiles (FFP) and optimal resolutions.Proc Natl Acad Sci U S A2009,106:2677–2682.
22. Simpson JT:Exploring genome characteristics and sequence quality without a reference.Bioinformatics2014,30:1228–1235.
23. Lappalainen T, Sammeth M, Friedlander MR, t Hoen PAC, Monlong J, Rivas MA, Gonzalez-Porta M, Kurbatova N, Griebel T, Ferreira PG, Barann M, Wieland T, Greger L, van Iterson M, Almlöf J, Ribeca P, Pulyakhina I, Esser D, Giger T, Tikhonov A:Transcriptome and genome sequencing uncovers functional variation in humans.Nature2013,501:506–511.
24. t Hoen PA, Friedlander MR, Almlof J, Sammeth M, Pulyakhina I, Anvar SY, Laros JF, Buermans HP, Karlberg O, Brannvall M, Consortiumden GEUVADIS,
Dunnen JT, van Ommen GJ, Gut IG, Guijó R, Estivill X, Syvänen AC, Dermitzakis ET, Lappalainen T:Reproducibility of high-throughput mRNA and small RNA sequencing across laboratories.Nat Biotechnol2013,31:1015–1022. 25. Stacey KJ, Young GR, Clark F, Sester DP, Roberts TL, Naik S, Sweet MJ, Hume DA:
The molecular basis for the lack of immunostimulatory activity of vertebrate DNA.J Immunol2003,170:3614–3620.
26. FastQC: a quality control tool for high-throughput sequence data
[http://www.bioinformatics.babraham.ac.uk/projects/fastqc/]
27. Kaufmann P, Pfefferkorn A, Teuber M, Meile L:Identification and quantification ofBifidobacteriumspecies isolated from food with genus-specific 16S rRNA-targeted probes by colony hybridization and PCR.Appl Environ Microbiol1997,63:1268–1273.
28. Caporaso JG, Lauber CL, Costello EK, Berg-Lyons D, Gonzalez A, Stombaugh J, Knights D, Gajer P, Ravel J, Fierer N, Gordon JI, Knight R:Moving pictures of the human microbiome.Genome Biol2011,12:R50.
29. Lozupone C, Hamady M, Knight R:UniFrac–an online tool for comparing microbial community diversity in a phylogenetic context.BMC Bioinformatics2006,7:371.
30. Nordstrom KJ, Albani MC, James GV, Gutjahr C, Hartwig B, Turck F, Paszkowski U, Coupland G, Schneeberger K:Mutation identification by direct comparison of whole-genome sequencing data from mutant and wild-type individuals usingk-mers.Nat Biotechnol2013,
31:325–330.
31. Gardner SN, Hall BG:When whole genome alignments just won’t work: kSNP v2 software for alignment-free SNP discovery and phylogenetics of hundreds of microbial genomes.PLoS One2013,8:e81760.
32. Marcais G, Kingsford C:A fast, lock-free approach for efficient parallel counting of occurrences ofk-mers.Bioinformatics2011,27:764–70. 33. Brown CT, Crusoe MR, Edvenson G, Fish J, Howe A, McDonald E, Nahum J,
Nanlohy K, Ortiz-Zuazaga H, Pell J, Simpson J, Scott C, Srinivasan RR, Zhang Q, Brown CT:The khmer software package: enabling efficient sequence analysis.Figshare2014,14:26.
34. DeLuca DS, Levin JZ, Sivachenko A, Fennell T, Nazaire MD, Williams C, Reich M, Winckler W, Getz G:RNA-SeQC: RNA-seq metrics for quality control and process optimization.Bioinformatics2012,28:1530–1532. 35. Segata N, Boernigen D, Tickle TL, Morgan XC, Garrett WS, Huttenhower C:
Computational meta’omics for microbial community studies.Mol Syst Biol
2013,9:666.
36. k-mer Profile Analysis Library at GitHub repository[https://github. com/LUMC/kPAL]
37. k-mer Profile Analysis Library at LUMC repository[http://www.lgtc.nl/ kPAL]
38. k-mer Profile Analysis Library at official Python repository for open-source packages[https://pypi.python.org/pypi/kPAL]
39. Online documentation fork-mer Profile Analysis Library[http://kPAL. readthedocs.org]
40. FASTA/FASTQ processing and manipulation toolkit at official Python repository for open-source packages[http://pypi.python.org/pypi/fastools] 41. Kosters WA, Laros JFJ:Metrics for mining multisets.InResearch and
Development in Intelligent Systems XXIV.Edited by Bramer M, Coenen F, Petridis M. London: Springer; 2008:293–303.
42. Rousseeuw PJ:Silhouettes - a graphical aid to the interpretation and validation of cluster-analysis.J Comput Appl Math1987,20:53–65. 43. Cohen J:Weighted kappa: nominal scale agreement with provision for
scaled disagreement or partial credit.Psychol Bull1968,70:213–220. 44. Sickle: a windowed adaptive trimming tool for FASTQ files using quality
[https://github.com/najoshi/sickle]
45. Lunter G, Goodson M:Stampy: a statistical algorithm for sensitive and fast mapping of Illumina sequence reads.Genome Res2011,21:936–939. 46. Li H, Durbin R:Fast and accurate short read alignment with Burrows-Wheeler
transform.Bioinformatics2009,25:1754–1760.
47. Langmead B, Salzberg SL:Fast gapped-read alignment with Bowtie 2.
Nat Methods2012,9:357–359.
48. Quinlan AR, Hall IM:BEDTools: a flexible suite of utilities for comparing genomic features.Bioinformatics2010,26:841–842.
49. Li H, Handsaker B, Wysoker A, Fennell T, Ruan J, Homer N, Marth G, Abecasis G, Durbin R, Genome Project Data Processing Subgroup:The sequence alignment/ map format and SAMtools.Bioinformatics2009,25:2078–2079.
50. Picard: a set of tools for working with next-generation sequencing data in the BAM format[http://picard.sourceforge.net]
52. k-mer profiles for RNA-Seq data[http://www.ebi.ac.uk/arrayexpress/ experiments/E-GEUV-3/files/profiles/?ref=E-GEUV-3]
53. ArrayExpress Accession E-GEUV-1 (mRNA)[http://www.ebi.ac.uk/ arrayexpress/experiments/E-GEUV-1/]
54. ArrayExpress Accession E-GEUV-2 (small RNA)[http://www.ebi.ac.uk/ arrayexpress/experiments/E-GEUV-2/]
55. ArrayExpress Accession E-GEUV-3[http://www.ebi.ac.uk/arrayexpress/ experiments/E-GEUV-3/]
Submit your next manuscript to BioMed Central and take full advantage of:
• Convenient online submission
• Thorough peer review
• No space constraints or color figure charges
• Immediate publication on acceptance
• Inclusion in PubMed, CAS, Scopus and Google Scholar
• Research which is freely available for redistribution
Submit your manuscript at www.biomedcentral.com/submit