2726
©IJRASET (UGC Approved Journal): All Rights are ReservedAn Efficient Approach for Reliability Analysis and
Reliability Based Design Optimization of Helical
Spring
M. Balamurugan1, N.Muthuram2
Assistant Professor1, PG scholar2, Department of Mechanical Engineering Government College of Technology Coimbatore-641013, India
Abstract: As the mathematical tools with the help of modern computers has widely been applied to most of the engineering design and problems, the performance of the modern engineering systems are achieving the best of it. The implementation of deterministic design optimization tools to the machine element design and manufacturing systems are certainly improved the overall productivity in all fields But there had been the presence of inherent uncertainties by nature in every design and analysis due to the error that occurs by man, machine, material, methods, measurements and service conditions, the failure of the particular product is unavoidable after a certain period of functioning. In this work, the optimization considering the inherent uncertainty in the mechanical element’s geometry (helical spring) design, yields more reliability of components during its service. In reliability based design optimization of spring, the mathematically modeled failure probability was intruded in the optimization algorithm (Genetic Algorithm) and the failure probability was calculated with the help of Monte Carlo simulation, the model used in this simulation was derived from the Response surface Regression method. And the reliable optimum values were compared with the deterministically optimized values.
Keywords: Deterministic design Optimization, Uncertainties, Reliability, Genetic Algorithm, Probability, Monte Carlo simulation.
I. INTRODUCTION
The components that are designed to perform a certain function to fulfill the human needs are carefully analyzed with the help of modern computational tools to achieve the maximum performance of those designed components. Also the products are expected with very high functional aspects, more reliability, more durability, higher qualities and especially at lower prices. So, in the globally competitive marketplace, many industries have endeavored to improve the quality of the design procedures and manufacturing processes for their products. So an efficient computational tool for estimating the reliability of system of a given design is required in order to optimize the design, while maintaining a prescribed life. RBDO is one of the design optimization tools to quantitatively define the trade-off between the performance and reliability. Where an objective function is optimized for performance by satisfying the constraints of reliability, where the reliable constraint is formulated by considering the uncertainties occur in design parameters. RBDO incorporates probabilistic analysis into the optimization process to ensure that the optimum design is likely to stay in the feasible region of the design space despite the variability occur in the design variables.
Springs are important members often used in machines to exert force, to absorb energy and to provide flexibility. In mechanical systems, wherever flexibility or relatively a large load under given circumstance is required, some form of spring is used. Helical spring is one of the common types of spring used in mechanical systems . A designer must choose the right spring having greater strength and flexibility for use in the system. The designer can use synthetic tools to some extent, as they use only numerical optimization methods. Further, real time problems demand better spring designs. Hence dynamic optimal design is more desirable. This paper presents an optimal design in a dynamic way for a cylindrical helical spring using
II. METHODOLOGY
2727
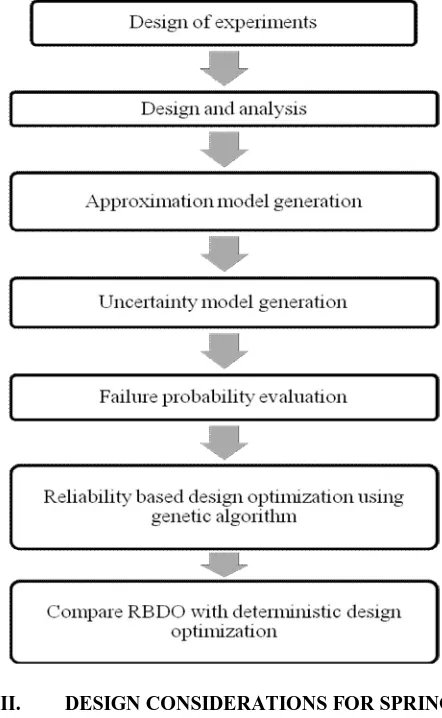
©IJRASET (UGC Approved Journal): All Rights are Reservedsingle constraint on the overall system probability of failure. The flow chart of classical approach/double loop method is as shown below.
A. Rbdo methodology
III. DESIGN CONSIDERATIONS FOR SPRING
A. Application
In the wide range of application of helical compression springs, for the design and analysis purpose, the shock absorber springs in two-wheelers are selected.
B.Material
[image:3.612.194.415.121.480.2]Since the Hard drawn wires of ASTM A227 standard are widely used for two-wheeler’s suspension system, the same standard of wire with the following specifications is taken for the analysis.
2728
©IJRASET (UGC Approved Journal): All Rights are ReservedTable 1.Material properties
PROPERTIES VALUES
Nominal Chemistry
C: 0.45-0.85% , Mn: 0.60-01.30 %
Minimum Tensile Strength (MPa)
CLASS I : 1014 - 1951 CLASS II : 1179 - 2234
E - Modulus of
Elasticity(MPa x103) 207
Design Stress %
Minimum Tensile 40
Modulus in Torsion ,G (MPa x 103)
79.3 Maximum Operating
Temperature °C 121
Rockwell Hardness 310 C - 52 0C
Density (g/cc) 7.85
C. Deflection of the spring due to load
The deflection-force relation can be obtained using Castigliano's theorem. The total strain energy in the spring wire has two components torsion and shear. By applying Castigliano’s theorem, the deflection of the spring is,
D. Shear stress in the spring
The maximum shear stress τmax in a helical spring occurs on the inner face of the spring coils and is equal to
where W is the Wahl correction factor and C is the spring index ( D/d ) is given by,
The allowable shear stress induced in spring =
0.40%(minimum tensile strength) as per ASTM A227 standard. Allowable stress , Sa= 0.40 * (1470 MPa) Sa = 588 MPa
E. Load assumptions
The approximate load acting on a single helical spring used in the shock absorber of a two-wheeler = 1677 N
IV. DESIGN OF EXPERIMENTS
Experiments help us in understanding the behavior of a (mechanical) system.
Data collected by systematic variation of influencing factors helps us to quantitatively describe the underlying phenomenon or phenomena.
2729
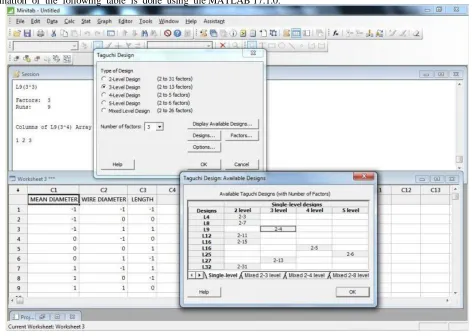
©IJRASET (UGC Approved Journal): All Rights are ReservedA. L9- Orthogonal Array:(3 factor – 3 level)
[image:5.612.71.543.96.432.2]The formation of the following table is done using the MATLAB 17.1.0.
Fig.2 L9- orthogonal array
The considered spring’s geometry variables and its ranges are, 1) Mean diameter (Dm): 28 mm to 35 mm
2) Wire diameter (Dw): 6 mm to 7.5 mm 3) Length of spring (L): 180 mm to 250 mm.
Table 2 L9- Orthogonal Array MEAN
DIAMETER (Dm) in mm
WIRE DIAMETER (Dw) in
mm
LENGTH (L) in mm
28 6 180
28 6.7 208
28 7.5 250
35 6 208
35 6.7 250
35 7.5 180
45 6 250
45 6.7 180
45 7.5 208
[image:5.612.106.474.526.704.2]2730
©IJRASET (UGC Approved Journal): All Rights are ReservedV. MODELLING AND SIMULATION
A. Modeling Details
[image:6.612.210.361.164.345.2]Various models were built for the parameters derived from the Design of Experiments table (orthogonal array) and exported to the ANSYS 13.0. Package. No. of active coils =15
Fig. 3 Solid modeling of spring in Solidworks
B. Analysis Details
Element type chosen: solid 185 (brick 8 node 185) Material property
Young’s modulus, E = 1.965 * 105 N/mm2 Poisson’s ratio, r = 0.3
Density = 7850 kg/mm3
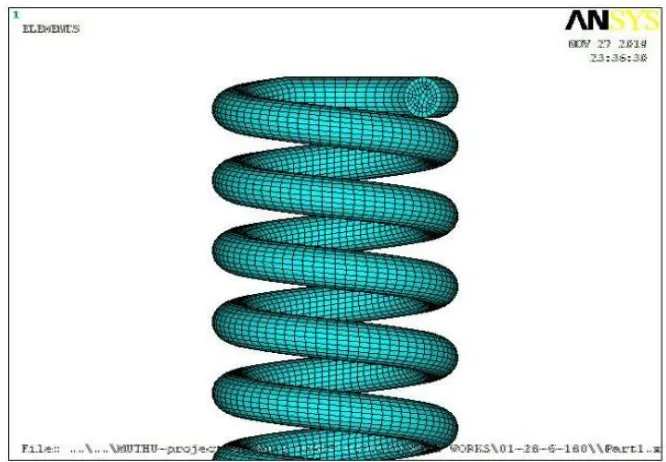
The portion of the meshed solid model, from the ANSYS 13.0.during the analysis is given below.
[image:6.612.155.488.488.719.2]2731
©IJRASET (UGC Approved Journal): All Rights are ReservedC. Boundary conditions
The meshed solid model is allowed for analysis by arresting its degree of freedom at one of the ends. Since there is lot of nodes generated by making a fine mesh, the constraint is applied over the cloud of the nodes selected. By the same way on the other end, the load is applied over many nodes equally.
Load given at one end of the spring = 1670 N.
D. Plotting the Results
The nodal solutions were taken out for, 1) Deflection along y axis,
2) Shear stress on XY plane.
E. Results of Analysis
Few of the analysis results are displayed for the deflection of the spring in Y-direction and the Induced shear stress in XY plane are shown below.
MODEL DEFLECTION OF THE SPRING:
Spring Geometry: Dm = 28 mm; Dw = 6 mm; L = 180 mm
Fig.5.Dflection of Spring
MODEL INDUCED SHEAR STRESS OF THE SPRING: Spring Geometry: Dm = 28 mm; Dw = 6 mm; L = 180 mm
2732
©IJRASET (UGC Approved Journal): All Rights are ReservedF. Result Summary of Analysis
All the deflection values and the shear stress values are listed out for the comparison. Table 3 Summary of results from analysis.
VI. REGRESSION MODEL GENERATION
A. Regression Equation for Deflection
To reproduce the deflection behavior of the spring, regression equation is generated Using Response Surface method, with the coded units formation in MINITAB 17.0.
Dm – Mean diameter of the spring Dw – wire diameter of the spring L- length of the spring.
The regression equation for the deflection is,
y = - 200.9 + 16.60 Dm + 27.08 Dw – 0.8588 L + 0.1715 Dm + 6.049 Dw – 0.000503 L - 4.259 D m*Dw+ 0.03134 Dm*L
B. Regression Equation for Induced Shear Stress:
To reproduce the shear stress behavior of the spring, regression equation is generated Using Response Surface method, with the coded units formation.
Dm – Mean diameter of the spring Dw – wire diameter of the spring L- length of the spring.
The regression equation for the induced shear stress is,
Ss = -9846 + 220.7*Dm + 2752*Dw - 11.61*L + 1.609*D 2 - 186.1*Dw + 0.08465*L - 20.46*Dm*Dw - 0.7917*Dm*L
VII. UNCERTAINTY MODEL GENERATION
A. Monte carlo simulation
2733
©IJRASET (UGC Approved Journal): All Rights are ReservedIn this work, the design variables (Mean diameter, Wire diameter, and length) were distributed based on their
mean value and standard deviation. Around 100000 trails points were generated according to the type of random data distribution function. Here we use Normal distribution for each design variable to generate 100000 trail points using
Minitab Software.
Calculator >Random data > Normal
Distribution > Mean & standard deviation values > ok After generating all the random design variables, the
transfer function is entered. Minitab dialog box is shown in Figure 7.1 for design variables distribution and transfer function for response
Fig.7. Transfer function and Design Variables
B. Response Distribution:
After distributing each variable according to their mean value and standard deviation, generation of Responses for the distributed points using regression model/equation is done. The response of the system had shown the type of distribution, standard deviation, Maximum and minimum values of Response. This system response is nothing but the Uncertainty Model.
Statistics > Basic Statistics > Graphical summary
2734
©IJRASET (UGC Approved Journal): All Rights are ReservedFig.8 Uncertainty Model for Shear Stress Induced
C. Failure Probability Estimation
From this un cer ta in t y model we ca n eva l uat e th e fa i l u r e probability of the spring with respect to induced shear stress.
Failure probability Pf = = = 59995 / 100000 = 0.59995
Pf = 60%
D. Reliability Index
Already mentioned in the previous chapter the evaluation of this failure probability Pf gives Reliability Index (β). Another method of finding the reliability index is Inverse of
Failure probability. Reliability Index R = 1 - Pf = 1 – 0.6
R = 0.4 = 40 %
E. Reliable constraints formulation
The reliability constraint can be formulated as the probability of shear stress exceeding the allowable stress limit should not exceed the probability of failure,
P(Ss (Dm,Dw,L) > Sa) < Pf P(Ss> 588) < Pf (0.40) And this probability can be estimated with the help of the
result values of the monte-carlo simulation, such as mean & standard deviation.
2735
©IJRASET (UGC Approved Journal): All Rights are ReservedWhere, μ - mean = 616.18 MPa σ - standard deviation = 148.85
VIII. RELIABILITY BASED DESIGN OPTIMIZATION
Minimize y(-200.9+16.60*Dm+27.08*Dw-0.8588*L+0.1715*Dm*Dm+6.049*Dw*Dw-0.000503*L*L- 4.259*Dm*Dw+0.03134*Dm*L)
Subject to: 28 <Dm< 45
6 <Dw< 7.5 180 < L < 250
P(Ss(Dm,dw,L)> 588 MPa) < 0.40…………..reliable constraint Where Ss(Dm.Dw,L) = -9846+220.7*Dm+2752*Dw- 11.61*L+1.609*Dm*Dm- 186.1*Dw*Dw+0.08465*L*L-
20.46*Dm*Dw-0.7917*Dm*L A. General Genetic Algorithm
In applying the GAs to optimization problems, certain steps for simulating evolution must be performed. These are described as follows.
Step (1): Initialize a population of chromosomes.
Step (2): Evaluate each chromosome in the population. Step (3): Create new chromosomes by mating current chromosomes; apply mutation and recombination as the parent chromosomes mate.
Step(4): Delete members of the population to make room for the new Chromosomes. Step (5): Evaluate the new chromosomes and insert them into the population.
Step (6): If the termination criterion is satisfied, stop and return the best chromosomes; or, go to Step (3).
B. Genetic Algorithm Flow
Initially many individual solutions are (usually) randomly generated to form an initial population. The population size depends on the nature of the problem, but typically contains several hundreds or thousands of possible solutions. Traditionally, the population is generated randomly, allowing the entire range of possible solutions (the search space). Occasionally, the solutions may be "seeded" in areas where optimal solutions are likely to be found.
2736
©IJRASET (UGC Approved Journal): All Rights are ReservedD. Execution of the Algorithm
This genetic algorithm was executed with the help of the software MATLAB r2010. After running more number of iterations, the deflection value gets minimized with satisfying the reliable constraints. The workspace window after running the program is presented here.
Fig.9. Workspace of Matlab Software
IX.RESULTS AND DISCUSSION
A. Reliable Region
After performing the montecarlo simulation in MINITAB 17.0., a region of space has been found to be reliable region , where any point (corresponding parameters) taken, the design would be more robust to the variation in the input parameters. That reliable region is presented in the following figure, where the shear stresses are measured for the change in mean diameter and wire diameter by keeping the length as constant.
2737
©IJRASET (UGC Approved Journal): All Rights are ReservedB. Reliable Optimum Values
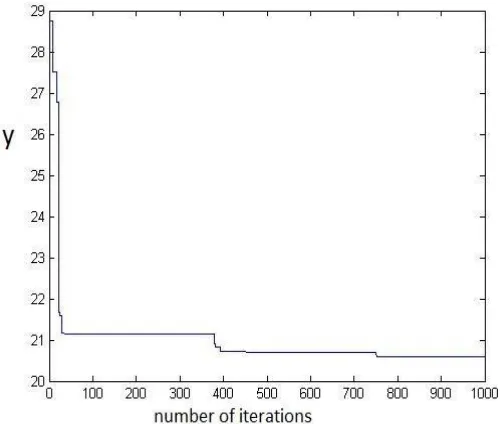
By running a program based on the genetic algorithm, to minimize the deflection function subjected to few limit constraints and a reliable constraint (based on shear stress function) for more number of iterations, the optimum values converge to new reliable optimum design parameters.
[image:13.612.184.434.183.395.2]The following pictures indicate the convergence of the design parameters Mean diameter, Wire diameter, Length of the spring and the response – deflection, to a reliable optimum values.
Fig .11 Deflection on spring in mm (response variable)
Table.4 Comparison of non- optimized and optimized parameters
X.CONCLUSION
Various mathematical tools and analytical tools were implemented to find out the best spring geometry parameters, which was also reliable when there have been uncertainties. To find out the relationship between geometrical parameters to its mechanical behavior, the minimized number of experiments (through Design of Experiments), were conducted and analyzed. With those results of analysis, the regression model was generated and the model was used to simulate through the Monte Carlo method.
By making 1,00,000 trials in MCS, the failure probability was approximated with reference to the stress limit. Then that modeled reliability was fed to an optimization algorithm as a constraint to minimize the deflection. The optimization was executed in MATLAB 10.0. with the Genetic algorithm approach.
[image:13.612.148.470.431.565.2]2738
©IJRASET (UGC Approved Journal): All Rights are Reservedperformance despite of the uncertainties and the variations between non-optimized and reliability based design optimized parameters were of ,
1) 16% decrease in Mean diameter of the spring 2) 11.9% increase in Wire diameter of the spring 3) 20.16% increase in length of the spring
REFERENCES
[1] H. Agarwal, J. E. Renaud, and J. D. Mack. A decomposition approach for reliability-based multidisciplinary design optimization. In Proc. of the 44th AIAA/ASME/ASCE/AHS/ASC structures, structural dynamics, and materials conf. & exhibit, Norfolk, Virginia, USA, pp. 2003–1778, April 2003. [2] Sangwon Hong1, Saeil Lee1, Sangook Jun2, Dong-Ho Lee 2,*, Hyungmin Kang3,Young-Seok Kang3 and Soo-Seok Yang3, Reliability Based Design
optimization of axial compressor using uncertainty model for stall margin, Journal of Mechanical Science and Technology 25 (3) (2011) 731~740. [3] S. Jun, Y. H. Jeon, J. Rho and D. H. Lee, Application of Collaborative Optimization Using Genetic Algorithm and Response Surface Method toan Aircraft
Wing Design, Journal of Mechanical Science and Technology 20(1) (2006) 133-146. [4]
[4] Y. Lian and M. S. Liou, Multiobjective Optimization Using Coupled Response Surface Model and Evolutionary Algoorithm, AIAA Journal, 43 (6) (2005) 1316-1325.
[5] J. Tu and K.K. Choi, A New Study on Reliability-Based Design Optimization, ASME J. Mech. Des., 1999, 121(4), p557–564.
[6] Pinjarla.Poormohan and Lakshmana Kishore T, “Design and Analysis of a Shock Absorber”, International Journal of Research in Engineering and Technology, ISSN: 2319-1163, Volume: 1, Issue: 4, pp.578-592, December 2012.
[7] Kommalapati. Rameshbabu, Tippa Bhimasankar Rao, “Design Evaluation of a two wheeler suspension system for variable load conditions” International Journal of Computational Engineering Research, Vol 03, Issue 4, pp. 279 -283 , 2013.
[8] Gajendra Singh Rathore and Upendra Kumar Joshi, “Fatigue Stress analysis of helical Compression Spring: A Review”, International Journal of Emerging Trends in Engineering and Development, ISSN: 2249-6149, Volume: 2, Issue: 3, pp. 512-520, May 2013
[9] Mehdi Bakhshesh and Majid Bakhshesh., “Optimization of Steel Helical Spring by Composite Spring”, International journal of multidisciplinary science and engineering, vol.3, No.6, june 2012.