O P I N I O N
Open Access
The real cost of sequencing: scaling
computation to keep pace with data
generation
Paul Muir
1,2,3, Shantao Li
4, Shaoke Lou
4,5, Daifeng Wang
4,5, Daniel J Spakowicz
4,5, Leonidas Salichos
4,5,
Jing Zhang
4,5, George M. Weinstock
6, Farren Isaacs
1,2, Joel Rozowsky
4,5and Mark Gerstein
4,5,7*Abstract
As the cost of sequencing continues to decrease and the amount of sequence data generated grows, new paradigms for data storage and analysis are
increasingly important. The relative scaling behavior of these evolving technologies will impact genomics research moving forward.
History from the 50s to next generation sequencing
In the 1950s, the contemporaneous development of bio-polymer sequencing and the digital computer started a digital revolution in the biosciences. Then in the late 1970s, the advent of the personal computer (PC) and Sanger sequencing led to an appreciable amount of se-quence data being generated, stored in databases, and
conceptualized within a computational framework [1–4].
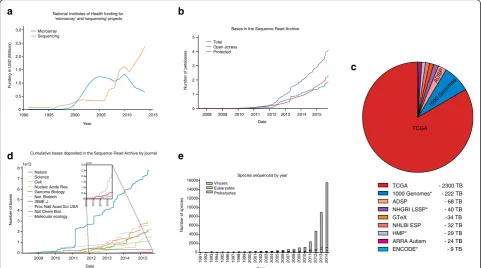
Communal sequence databases were developed in the 1980s [5, 6], but most investigators worked with data of a scale that allowed transfer to and processing on a local client. In the 1990s, the rise of the Internet facilitated increased data sharing, and analysis techniques began to shift to programs hosted on websites [7]. In the mid-2000s, the most recent big change occurred with the advent of cloud computing and next generation se-quencing (NGS), which led to a dramatic increase in the scale of datasets (Fig 1) [4, 8]. This necessitated changes in the storage infrastructure; databases such as the European Nucleotide Archive [9] and the Sequence Read Archive (SRA) [10] were created to store and
* Correspondence:[email protected]
4
Program in Computational Biology and Bioinformatics, Yale University, New Haven, CT 06520, USA
5Department of Molecular Biophysics and Biochemistry, Yale University, New
Haven, CT 06520, USA
Full list of author information is available at the end of the article
organize high-throughput sequencing data. The SRA has grown significantly since its creation in 2007, and it
now contains almost four petabases (4 × 10¹⁵ bases),
approximately half of which are open access [11]. These datasets present a challenge because they are too large for the old sharing and analysis paradigms, but recent innovations in computational technologies and ap-proaches, especially the rise of cloud computing, pro-vide promising avenues for handling the vast amounts of sequence data being generated.
Organizing principles for biocomputing history
There are a number of key concepts to keep in mind when considering the coevolution of sequencing and computing. First is the idea that scientific research and computing have progressed through a series of discrete paradigms driven by the technology and conceptual frameworks available at the time, a notion popularized by Jim Gray from Microsoft [12]. Gray organized his views into four paradigms of scientific research. The first two paradigms are empirical observation and attempts
to identify general theories. Gray’s third paradigm
de-scribes the original type of scientific computing, epito-mized by large supercomputer-based calculations and modeling, for example, computing a rocket trajectory from a set of equations. This approach tends to favor differ-ential equations and linear-algebraic types of computations. The fourth paradigm is much more data intensive.
Here the “capture, curation, and analysis” of large
amounts of information fuels scientific research [12].
Researchers often try to find patterns in“big data” and
a premium is placed on resource interoperability and statistical pattern finding. In order to realize fully the potential of this approach to science, significant invest-ment must be made both in the computational infrastruc-ture that supports data processing and sharing and in
providing training resources that will allow researchers to better understand, handle, and compare large datasets.
The second key concept is the interplay between fixed and variable costs, especially with regard to their impact on scaling behavior. Much of the decrease in sequencing costs has been a result of a shift between these two cost structures. NGS introduced more efficient and compli-cated equipment, increasing the fixed cost; but a reduc-tion of the variable costs of sequencing resulting from lower per-sample costs has accompanied this increase in fixed cost. This has encouraged the sequencing of an
ever-greater number of samples in order to reduce the average cost and achieve economies of scale.
The opposite shift in cost structures is beginning to occur in the context of scientific computing. In the past, computing operated under a cost structure similar to that for sequencing. This often involved a large fixed cost associated with purchasing a machine followed by low variable costs for actual running of the machine (usually power, cooling, and systems administration time). Cloud computing and its associated concepts, such as the software, platform, and infrastructure as a
National Institutes of Health funding for ‘microarray’ and ‘sequencing’ projects Microarray
Sequencing
Year 1990
3.0 2.5 2.0 1.5 1.0 0.5 0
1995 2000 2005 2010 2015
F
unding in USD (Billions)
Bases in the Sequence Read Archive Total
Open access Protected
Date
Number of petabases
2008 5 4 3 2 1 0
2009 2010 2011 2012 2013 2014 2015
TCGA
ADSP
1000 Genomes
TCGA 1000 Genomes* ADSP NHGRI LSSP* GTeX NHLBI ESP HMP* ARRA Autism ENCODE*
- 2300 TB - 222 TB - 68 TB - 40 TB -34 TB - 32 TB - 29 TB - 24 TB - 9 TB
Cumulative bases deposited in the Sequence Read Archive by journal
Number of bases
8 7 6
3.0
2.5 2.0
1.5 1.0
0.5 0
5 4 3 2 1 0
2009
2012 2013 2014 2015
2010 2011 2012 Date
2013 2014 2015 Nature
Science Cell Nucleic Acids Res. Genome Biology Nat. Biotech. ISME J. Proc Natl Acad Sci USA Nat Chem Biol. Molecular ecology 1e13 1e12
16000 14000 12000
Number of species
Species sequenced by year
Year Viruses
Eukaryotes Prokaryotes 10000
8000 6000 4000 2000 0
1991 1992 1993 1994 1995 1996 1997 1998 1999 2000 2001 2002 2003 2004 2005 2006 2007 2008 2009 2010 2011 2012 2013 2014
a
d
b
e
c
[image:2.595.57.539.89.357.2]service, removes the need for a large initial fixed-cost in-vestment [13]. However, the variable costs associated with access to cloud computing can be significantly higher. This new regime, in which costs scale with the amount of computational processing time, places a pre-mium on driving down the average cost by developing efficient algorithms for data processing.
The different cost structure of this new computing paradigm will significantly impact how funding agencies and researchers approach data analysis. Traditionally, large expenses for computing equipment in academic settings have been exempt from additional indirect fees levied by universities on smaller consumption purchases. Furthermore, the running costs for the hardware, such as electricity and cooling costs, are supported by the university at little to no cost for the individual investiga-tor (usually from the overall pool of indirect costs). By contrast, universities do not consider cloud computing time to be an equipment purchase and levy the indirect
cost fees on top of the ‘service’ purchase. In addition,
cloud computing costs often incorporate the additional costs (electricity, rent, and so on) directly into the price. These funding schemes add to the expense of purchas-ing cloud-computpurchas-ing time as compared to large pur-chases of computing equipment.
The cost of sequencing is frequently measured as a dollar amount per base. Whether this price includes all steps in the sequencing process (sample preparation, downstream processing, and so on) or merely the se-quencing run is often ambiguous. This single price also obscures the cost breakdown of sequencing projects. A more comprehensive approach in which the full eco-nomic cost (FEC) of sequencing is evaluated would en-able both researchers and funding agencies to better understand and plan such projects. This approach breaks the cost of a sequencing project into its substitu-ent parts and idsubstitu-entifies the shared institutional resources used as well as the indirect costs associated with the project. Such accounting practices would more explicitly call attention to the shift in cost structures described above and would better enable the adaptation of funding mechanisms to meet the changing needs of sequencing-enabled research.
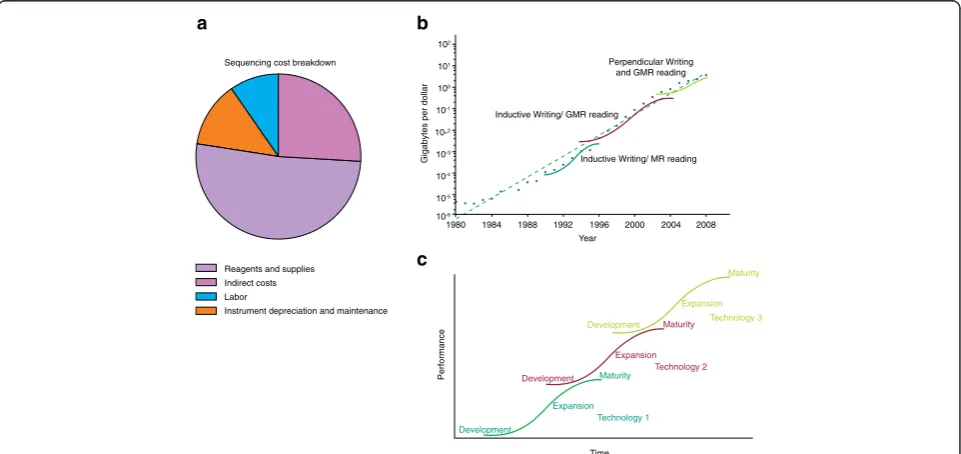
Such detailed cost breakdowns are often difficult to obtain and can vary between institutions. Nevertheless, these cost breakdowns can help to reveal how different components of the sequencing pipeline scale with the size of the project. Figure 2a illustrates the cost break-down of NGS projects into the costs of labor, reagents and supplies, instrument depreciation and maintenance,
Inductive Writing/ MR reading Inductive Writing/ GMR reading
Perpendicular Writing and GMR reading
Maturity
Development
Expansion
Maturity
Development
Expansion
Maturity
Development
Expansion
Technology 1 Technology 2
Technology 3
Time
Performance
b
c a
Sequencing cost breakdown
Gigabytes per dollar
Reagents and supplies Indirect costs Labor
Instrument depreciation and maintenance
1980 1984 1988 1992 1996 Year
2000 2004 2008 102
101
100
10-1
10-2
10-3
10-4
10-5
10-6
[image:3.595.58.539.414.641.2]and indirect fees. These analyses have a common draw-back in that they generally exclude bioinformatics costs or include only the cost of basic data processing (with-out alignment) and initial storage. As bioinformatics be-comes increasingly important in the generation of biological insight from sequencing data, the long-term storage and analysis of sequencing data will represent a larger fraction of project cost. Efforts to better incorpor-ate detailed and realistic accounting for downstream bio-informatics analysis is essential to the development of accurate models of the FEC of sequencing projects.
The third key concept to take into account with these developments is the idea of scaling behavior in sequen-cing technology and its impact on biological research. The most prominent analogous example of this is
Moore’s law, which describes the scaling of integrated
circuit development and its wide-ranging impact on the computer industry.
Backdrop of the computer industry and Moore’s law
Improvements in semiconductor technology have dra-matically stimulated the development of integrated cir-cuits during the past half-century. This spurred the development of the PC and the internet era. Various scaling laws that model and predict the rapid develop-mental progress in high-tech areas driven by the
pro-gress in integrated circuit technology have been
proposed. Moore’s law accurately predicted that the
number of transistors in each square inch would double every two years [14]. In fact, the integrated circuit
indus-try has used Moore’s law to plan its research and
devel-opment cycles. Besides Moore’s law, various other
predictive laws have been proposed for related high-tech
trends. Rock’s law (also called Moore’s second law)
pre-dicted that the fixed cost of constructing an integrated circuit chip fabrication plant doubles about every four
years [15]. Additionally, Kryder’s law describes the
roughly yearly doubling in the area storage density of hard drives over the past few decades [16].
The roughly exponential scaling over a period of mul-tiple decades described by these laws is not simply the scaling behavior of a single technology but rather the superposition of multiple S-curve trajectories. These curves represent the scaling of different technological in-novations that contribute to the overall trend (Fig. 2). The S-curve behavior of an individual technology is the result of three main phases: development, expansion and maturity [17]. For example, the near yearly doubling of hard drive storage density over the past two and a half decades results from the superposition of the S-curves for five different basic storage technologies. This behav-ior is also seen for sequencing-based technologies.
The success of these predictive laws encouraged the de-velopment of forecasts for other emergent technologies,
including sequencing. The cost of sequencing roughly
followed a Moore’s law trajectory in the decade before
2008, but the introduction of NGS technologies caused
costs to drop faster than would be expected by Moore’s
law. Specifically, in the past five years, the cost of a per-sonal genome has dropped to $4200 in 2015 from
$340,000 in 2008 [18]. This departure from Moore’s law
indicates that the transition between these technologies introduced a new cost-scaling regime.
Computational component of sequencing—what’s
happening in bioinformatics?
The decreasing cost of sequencing and the increasing number of sequence reads being generated are placing greater demand on the computational resources and knowledge necessary to handle sequence data. It is cru-cially important that as the amount of sequencing data continues to increase, these data are not simply stored but organized in a manner that is both scalable and eas-ily and intuitively accessible to the larger research com-munity. We see a number of key directions of change in bioinformatics computing paradigms that are adapting in response to the ever-increasing amounts of sequen-cing data. The first is the evolution of alignment algo-rithms in response to larger reference genomes and sequence read datasets. The second involves the need for compression to handle large file sizes, and especially the need for compression that takes advantage of do-main knowledge that is specific to sequencing data to achieve better outcomes than those provided by more generic compression algorithms. The third change in-volves the need for distributed and parallel cloud com-puting to handle the large amounts of data and integrative analyses. The fourth change is driven by the fact that, in the future, a large amount of sequencing data will be private data, related to identifiable individ-uals; consequently, there is a need to put protocols in place to secure such data, particularly within a cloud-computing environment.
Innovations underlying scaling in alignment algorithms
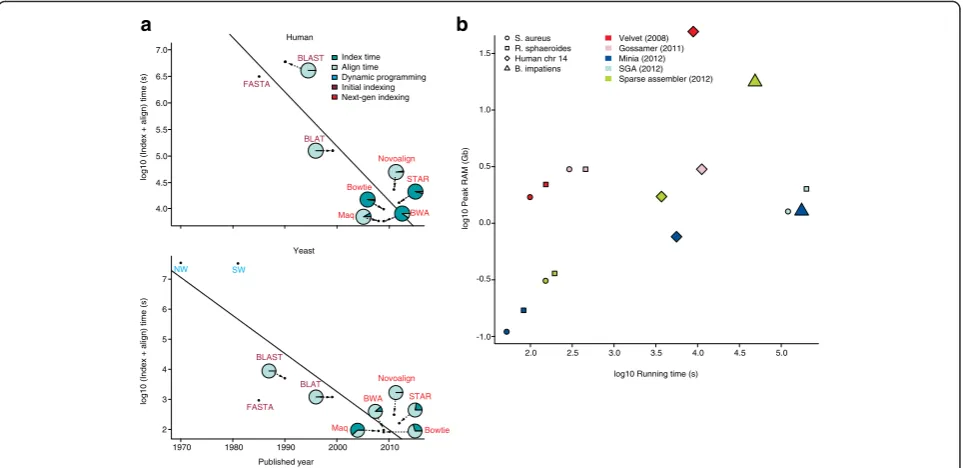
Alignment tools have co-evolved with sequencing tech-nology to meet the demands placed on sequence data processing. The decrease in their running time
approxi-mately follows Moore’s Law (Fig. 3a). This improved
employing either hash-tables (for example, Fasta [21], BLAST (Basic Local Alignment Search Tool) [22], BLAT (BLAST-like Alignment Tool) [23], MAQ [24], and Novoa-lign [25]) or suffix arrays with the Burrows-Wheeler trans-form (for example, STAR (Spliced Transcripts Alignment to a Reference) [26], BWA (Burrows-Wheeler Aligner) [27] and Bowtie [28]).
In addition to these optimized data structures, algo-rithms adopted different search methods to increase efficiency. Unlike Smith-Waterman and Needleman-Wunsch, which compare and align two sequences dir-ectly, many tools (such as FASTA, BLAST, BLAT, MAQ, and STAR) adopt a two-step seed-and-extend strategy. Although this strategy cannot be guaranteed to find the optimal alignment, it significantly increases speeds by not comparing sequences base by base. BWA and Bowtie further optimize by only searching for exact matches to a seed [25]. The inexact match and extension approach can be converted into an exact match method by enumerating all combinations of mismatches and gaps.
In addition to changing search strategies, algorithms adjusted to larger datasets by first organizing the query, the database, or both. This involves an upfront computa-tional investment but returns increased speed as datasets
grow larger. For example, some algorithms (BLAST, FASTA, and MAQ) first build indexes for query se-quences before scanning the database. On the database side, some algorithms (such as BLAST and MAQ) for-mat the database into compact binary files, whereas others (such as BLAT, Novoalign, STAR, BWA, and Bowtie) build an offline index. STAR, BWA, and Bowtie in particular can significantly reduce the marginal map-ping time (the time it takes to map a single read), but re-quire a relatively large period of time to build a fixed index. In general, we find a negative correlation between the marginal mapping time and the time to construct the fixed index, making BWA, Bowtie, and STAR better suited to handle progressively larger NGS datasets (Fig. 3a). Much like the expansion phase observed in the
S-curve trajectories that produce Moore’s law, many of
these algorithms have been refined to improve perform-ance. For example, BLAST has been heavily optimized for different datasets, producing HyperBLAST [29], CloudBLAST [30], DynamicBlast [31], and mBLAST [32], to name a few. In the case of mBLAST, researchers involved in the Human Microbiome Project commis-sioned the optimization of the algorithm so that the ana-lyses could be performed on a reasonable time scale. Nevertheless, many of these alignment algorithms are
Human
log10 (Index + align) time (s)
log10 (Index + align) time (s)
BLAST
FASTA
FASTA
Maq
Maq Bowtie
Bowtie BWA
BWA Novoalign
Novoalign STAR
STAR BLAT
BLAT
7.0
7 6 5 4 3 2
Index time Align time Dynamic programming Initial indexing Next-gen indexing
1970 1980 1990 2000 2010 Yeast
Published year
NW SW
BLAST
a b
2.0 2.5 3.0 3.5 4.0 4.5 5.0 1.5
1.0 0.5 0.0 -0.5 -1.0
log10 Running time (s)
log10 Peak RAM (Gb)
S. aureus R. sphaeroides Human chr 14 B. impatiens
Velvet (2008) Gossamer (2011) Minia (2012) SGA (2012) Sparse assembler (2012) 6.5
6.0 5.5 5.0 4.5 4.0
[image:5.595.58.540.88.322.2]not suitable for longer reads because of the scaling be-havior of their seed search strategies. As long-read tech-nologies continue to improve, there will be an ever greater need to develop new algorithms capable of deliv-ering speed improvements similar to those obtained for short-read alignment [25].
Recently, new approaches have been developed that substitute assembly for mapping. These are not directly comparable to the mappers above, but they provide sig-nificant speed gains in certain contexts and may represent the next technological innovation in alignment. These ap-proaches, including Salmon and Kallisto [29, 30], mostly focus on RNA-seq transcript identification and quantifica-tion, and they employ hashed k-mers and a De Bruijn graph for the task of RNA-Seq quantification. Moreover, instead of developing a base-pair resolution alignment,
these approaches identify a ‘pseudoalignment’ that
con-sists of the set of transcripts compatible with a given read. In addition to read alignment, the other main computa-tionally intensive algorithmic issue associated with the analysis of sequencing reads is the de novo assembly of a genome sequence. Many tools have been developed for assembly using short-read sequencing technology [31, 32]. The time and memory requirements are to some degree related to genome size but vary significantly between algorithms (Fig. 3b) [33]. The advent of long-read sequencing technologies such as Pacific Biosciences, Oxford Nanopore and Moleculo [34] promise high-quality sequence assemblies with potentially reduced computational costs. However, higher sequencing error rates for longer reads require novel assembly
algo-rithms [35–38]. The main benefit is that it is possible
to assemble contigs that are 10–100× larger than those
assembled by traditional short-read technologies, even with lower-fold coverage (see [39] for a comparison in mammalian genomes).
Compression
The explosion of sequencing data created a need for effi-cient methods of data storage and transmission. General algorithms such as Lempel-Ziv offer great compatibility, good speed and acceptable compression efficiency for sequencing data and are widely used [40], but custom-ized algorithms are needed to further reduce the storage footprint and transmission time. For example, many researchers use the Sequence Alignment/Map (SAM)/ Binary Alignment/Map (BAM) format to store reads. A widely accepted compression method, CRAM (compres-sion algorithm), is able to shrink BAM files by ~30 %
without any data loss (‘losslessly’) and by more if
com-pression is allowed to lose some information (‘lossy’),
typically in the quality scores [41]. CRAM only records the reference genome and applies Huffman coding to the result. The development of new and better compression
algorithms is an active research field and we believe that high compatibility and the balance between usability and compression is key to moving forward.
Cloud computing
Scalable storage, query, and analysis technologies are necessary to handle the increasing amounts of genomic data being generated and stored. Distributed file sys-tems greatly increase the storage input/output (I/O) bandwidth, making distributed computing and data management possible. An example is the NoSQL data-base, which provides excellent horizontal scalability, data structure flexibility, and support for high-load interactive queries [42]. Moreover, the parallel pro-gramming paradigm has evolved from fine-grained MPI/MP to robust, highly scalable frameworks such as MapReduce [43] and Apache Spark [44]. This situation calls for customized paradigms that are specialized for bioinformatics study. We have already seen some excit-ing work in this field [45].
These distributed computing and scalable storage technologies naturally culminate in the framework of cloud computing, where data are stored remotely and analysis scripts are then uploaded to the cloud and the analysis is performed remotely. This greatly reduces the data transfer requirements because only the script and analysis results are transferred to and from data that res-ide permanently in the cloud.
Privacy
Just as the internet gave rise to “open source”software,
the initial sequencing of the human genome
(particu-larly that from the “public consortium”) was associated
with“open data”. Researchers were encouraged to build
upon existing publicly available sequence knowledge and to contribute additional sequence data or annota-tions; but as more genomes of individuals are se-quenced, concerns for the privacy of these subjects necessitates securing the data and providing access only to appropriate users [46].
As changing computing paradigms such as cloud computing become involved in managing the flood of sequencing data, privacy protection in the cloud envir-onment becomes a major concern [47, 48]. Research in this field can broadly be split into two layers: first, sen-sitive data must be protected from leaking to a third party [49] and second, the cloud service provider should be made as oblivious as possible to the compu-tation [50]. One possible culmination of these ideas
could be the creation of a single, monolithic ‘
biomed-ical cloud’ that would contain all the protected data
storing all their programs and analyses there. Smaller implementations of this strategy can be seen in the de-velopment of Health Insurance Portability and Ac-countability Act (HIPAA)-compliant cloud resources, where datasets can be stored and shared on remote servers [48].
The cost of sequencing and the changing biological research landscape
The decrease in the cost of sequencing that has accom-panied the introduction of NGS machines and the corre-sponding increase in the size of sequence databases has changed both the biological research landscape and common research methods. The amount of sequence data generated by the research community has exploded over the past 10 years. Decreasing costs have enabled the formation of both large consortia with broad goals (such as measuring human genetic variation or profiling cancer genomes) and individual labs that target more specific questions. These developments have helped to democratize and spread sequencing technologies and re-search, increasing the diversity and specialization of ex-periments. Nearly 150 different experimental strategies have been described using Illumina sequencing alone. They apply this technology to nucleic acid secondary structure, interactions with proteins, spatial information within a nucleus, and more [51].
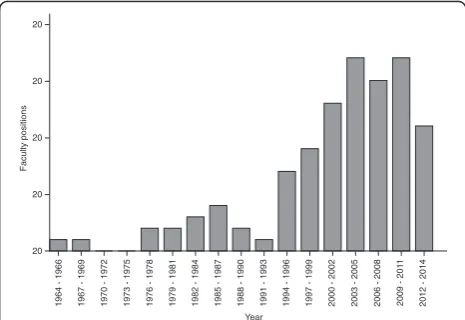
The changing cost structure of sequencing will signifi-cantly impact the social enterprise of genomics and bio-computing. Traditionally, research budgets have placed a high premium on data generation; but with sequencing prices falling rapidly and the size of sequence databases ever expanding, translating these data into biological in-sights is becoming increasingly important. Consequently, the analysis component of biological research is becom-ing a larger fraction of the real value of an experiment [8]. This of course shifts the focus of scientific work and the credit in collaborations. As a corollary, job prospects for scientists with training in computational biology re-main strong, despite squeezed budgets [52]. Universities, in particular, have increased the number of hires in bio-informatics (Fig. 4).
Moreover, the falling price of sequencing and the growth of sequence databases has reduced the cost of obtaining useful sequence information for analysis. Se-quence data that are downloadable from databases are ostensibly free, but costs arise in the need for computa-tional storage and analysis resources as well as in the training necessary to handle and interpret the data. Ini-tial automated processing pipelines for sequence data have lower fixed costs but higher variable costs com-pared to sequence generation. Variable costs associated with data transfer, storage, and initial pipeline processing using the cloud (such as to call variants) all scale with
the size of the sequence dataset being analyzed. In quence data generation, the high initial cost of a se-quencing machine is offset by sese-quencing ever-greater amounts in order to distribute the cost of the initial capital investment over a larger number of sequenced bases, but this approach merely increases the amount of computational time required for initial pipeline pro-cessing. In the context of cloud computing, this trans-lates into increasing costs because the user is charged for computational time used. This creates a mismatch: the combination of costs incurred in sequence data analysis are not subject to the same economy of scale seen in the generation of sequence data.
There are two possible cost structures for the down-stream analysis, depending on how bioinformaticians are compensated. Bioinformaticians might be paid on a per project basis (in the extreme, an hourly wage) in which case their reimbursement resembles the low initial fixed cost and higher variable cost structure of cloud comput-ing. On the other hand, if bioinformaticians are salaried, the cost structure of downstream analysis more closely resembles that of sequencing technologies, with the sal-aries representing an initial fixed cost. However, bioin-formaticians differ from sequencing machines in that they cannot be consistently replaced by more expensive versions that are capable of processing more sequencing information. Consequently, driving down the cost of se-quence analysis follows a similar path regardless of cost structure. In order to drive down costs, downstream analysis should be made as efficient as possible. This will enable bioinformaticians to analyze as much sequence data as possible under given time constraints. Generat-ing ever-greater amounts of sequence information will become futile if those data hit a bottleneck during pro-cessing and analysis.
20
20
Faculty positions
20
20
Year 20
1964 - 1966 1967 - 1969 1970 - 1972 1973 - 1975 1976 - 1978 1979 - 1981 1982 - 1984 1985 - 1987 1988 - 1990 1991 - 1993 1994 - 1996 1997 - 1999 2000 - 2002 2003 - 2005 2006 - 2008 2009 - 201
1
2012 - 2014
[image:7.595.305.538.88.248.2]These factors necessitate that many of the big projects, in addition to generating large amounts of sequencing data, pay attention to making data analysis and process-ing efficient. This can often lead to a framework for large-scale collaboration in which much of the analysis and processing of the data is done in a unified fashion. This enables the entire dataset to be used as an enduring coherent resource that does not need reprocessing. If the sequence data generated by individual labs is not processed uniformly and sequence databases are not made easily accessible and searchable, then analysis of aggregated datasets will be challenging. It might seem superficially cheaper to pool the results of many smaller experiments but the reprocessing costs for all of these datasets may be considerably larger than redoing the se-quencing experiment itself. In addition to posing tech-nical issues for data storage, the increasing volume of sequences being generated presents a challenge in inte-grating newly generated information with the existing knowledge base. Hence, although people thought that the advent of NGS would democratize sequencing and spur a movement away from the large centers and con-sortia, in fact the opposite has been the case. The need for uniformity and standardization in very large datasets has, in fact, encouraged very large consortia such as 1000 Genomes [53] and The Cancer Genome Atlas (TCGA) [54].
In the future, one might like to see a way of encour-aging uniformity and standardization without having an explicit consortium structure, letting many people ag-gregate small sequencing experiments and analyses together. Perhaps this could be done by open commu-nity standards just as the internet was built through pooling of many individual open-source actors using community-based standards [55]. It is imperative that such a standardization initiative accompanies the de-velopment and implementation of new technologies such as more efficient data processing and compres-sion algorithms as well as secure cloud computing. A scalable biocomputing infrastructure is vital to a bio-logical research ecosystem capable of integrating vast amounts of heterogeneous sequencing data.
Abbreviations
BAM:Binary Sequence Alignment/Map; BLAST: Basic Local Alignment Search Tool; BLAT: BLAST-like Alignment Tool; BWA: Burrows-Wheeler Aligner; CRAM: Compression algorithm; FEC: Full economic cost; NGS: Next-generation sequencing; PC: Personal computer; SRA: Sequence Read Archive; STAR: Spliced Transcripts Alignment to a Reference..
Competing interests
The authors declare that they have no competing interests.
Authors’contributions
PM, SL, SKL, DW, DS, LS, JZ, GMW, FI, JR, and MG wrote and edited the manuscript. All authors read and approved the final manuscript.
Funding
We would like to acknowledge the National Institutes of Health for funding (Grant U41 HG007000-03).
Author details
1Department of Molecular, Cellular and Developmental Biology, Yale
University, New Haven, CT 06520, USA.2Systems Biology Institute, Yale
University, West Haven, CT 06516, USA.3Integrated Graduate Program in
Physical and Engineering Biology, Yale University, New Haven, CT 06520,
USA.4Program in Computational Biology and Bioinformatics, Yale University,
New Haven, CT 06520, USA.5Department of Molecular Biophysics and
Biochemistry, Yale University, New Haven, CT 06520, USA.6The Jackson
Laboratory for Genomic Medicine, Farmington, CT 06032, USA.7Department
of Computer Science, Yale University, New Haven, CT 06520, USA.
References
1. Staden R. Automation of the computer handling of gel reading data produced by the shotgun method of DNA sequencing. Nucleic Acids Res. 1982;10:4731–51.
2. Sanger F, Nicklen S, Coulson AR. DNA sequencing with chain-terminating inhibitors. Proc Natl Acad Sci U S A. 1977;74:5463–7.
3. Larson R, Messing J. Apple II computer software for DNA and protein sequence data. DNA. 1983;2:31–5.
4. Stevens H. Life out of sequence : a data-driven history of bioinformatics. Chicago: The University of Chicago Press; 2013.
5. George DG, Barker WC, Hunt LT. The protein identification resource (PIR). Nucleic Acids Res. 1986;14:11–5.
6. Kanehisa MI. Los Alamos sequence analysis package for nucleic acids and proteins. Nucleic Acids Res. 1982;10:183–96.
7. Gouet P, Courcelle E, Stuart DI, Metoz F. ESPript: analysis of multiple sequence alignments in PostScript. Bioinformatics. 1999;15:305–8. 8. Sboner A, Mu XJ, Greenbaum D, Auerbach RK, Gerstein MB. The real cost of
sequencing: higher than you think! Genome Biol. 2011;12:125.
9. Leinonen R, Akhtar R, Birney E, Bower L, Cerdeno-Tarraga A, Cheng Y, et al. The European Nucleotide Archive. Nucleic Acids Res. 2011;39(Database issue):D28–31.
10. Leinonen R, Sugawara H, Shumway M. International Nucleotide Sequence Database Collaboration. The sequence read archive. Nucleic Acids Res. 2011; 39(Database issue):D19–21.
11. Sequence Read Archive.NCBI/NLM/NIH. 2015. http://www.ncbi.nlm.nih.gov/ Traces/sra/. Accessed 22 Feb 2016.
12. Hey AJG, Tansley S, Tolle KM. The fourth paradigm: data-intensive scientific discovery. 2009. Microsoft Research.
13. Armbrust M, Fox A, Griffith R, Joseph AD, Katz R, Konwinski A, et al. A view of cloud computing. Commun ACM. 2010;53:50–8.
14. Brock DC, Moore GE. Understanding Moore’s law: four decades of innovation. Philadelphia, PA: Chemical Heritage Foundation; 2006. 15. Ross PE. 5 Commandments. 2015. http://spectrum.ieee.org/semiconductors/
materials/5-commandments. Accessed 22 Feb 2016. 16. Walter C. Kryder’s law. Sci Am. 2005;293:32–3.
17. Sood A, James GM, Tellis GJ, Zhu J. Predicting the path of technological innovation: SAW vs. Moore, Bass, Gompertz, and Kryder. Market Sci. 2012;31: 964–79.
18. National Human Genome Research Institute. DNA Sequencing Costs: Data from the NHGRI Genome Sequencing Program (GSP). http://www.genome. gov/sequencingcosts. Accessed 22 Feb 2016.
19. Smith TF, Waterman MS. Identification of common molecular subsequences. J Mol Biol. 1981;147:195–7.
20. Needleman SB, Wunsch CD. A general method applicable to the search for similarities in the amino acid sequence of two proteins. J Mol Biol. 1970;48:443–53. 21. Lipman DJ, Pearson WR. Rapid and sensitive protein similarity searches.
Science. 1985;227:1435–41.
22. Altschul SF, Gish W, Miller W, Myers EW, Lipman DJ. Basic local alignment search tool. J Mol Biol. 1990;215:403–10.
23. Kent WJ. BLAT—the BLAST-like alignment tool. Genome Res. 2002;12:656–64. 24. Li H, Ruan J, Durbin R. Mapping short DNA sequencing reads and calling
variants using mapping quality scores. Genome Res. 2008;18:1851–8. 25. Li H, Homer N. A survey of sequence alignment algorithms for
26. Dobin A, Davis CA, Schlesinger F, Drenkow J, Zaleski C, Jha S, et al. STAR: ultrafast universal RNA-seq aligner. Bioinformatics. 2013;29:15–21. 27. Li H, Durbin R. Fast and accurate short read alignment with
Burrows-Wheeler transform. Bioinformatics. 2009;25:1754–60.
28. Langmead B, Trapnell C, Pop M, Salzberg SL. Ultrafast and memory-efficient alignment of short DNA sequences to the human genome. Genome Biol. 2009;10:R25.
29. Bray N, Pimentel H, Melsted P, Pachter L. Near-optimal RNA-Seq quantification. arXiv:150502710. 2015.
30. Patro R, Duggal G, Kingsford C. Salmon: accurate, versatile and ultrafast quantification from RNA-seq data using lightweight-alignment. bioRxiv. 2015. http://dx.doi.org/10.1101/021592.
31. Zhang W, Chen J, Yang Y, Tang Y, Shang J, Shen B. A practical comparison of de novo genome assembly software tools for next-generation sequencing technologies. PLoS One. 2011;6:e17915.
32. Bradnam KR, Fass JN, Alexandrov A, Baranay P, Bechner M, Birol I, et al. Assemblathon 2: evaluating de novo methods of genome assembly in three vertebrate species. Gigascience. 2013;2:10.
33. Kleftogiannis D, Kalnis P, Bajic VB. Comparing memory-efficient genome assemblers on stand-alone and cloud infrastructures. PLoS One. 2013;8: e75505.
34. Kuleshov V, Xie D, Chen R, Pushkarev D, Ma Z, Blauwkamp T, et al. Whole-genome haplotyping using long reads and statistical methods. Nat Biotechnol. 2014;32:261–6.
35. English AC, Richards S, Han Y, Wang M, Vee V, Qu J, et al. Mind the gap: upgrading genomes with Pacific Biosciences RS long-read sequencing technology. PLoS One. 2012;7:e47768.
36. Koren S, Schatz MC, Walenz BP, Martin J, Howard JT, Ganapathy G, et al. Hybrid error correction and de novo assembly of single-molecule sequencing reads. Nat Biotechnol. 2012;30:693–700.
37. Chin CS, Alexander DH, Marks P, Klammer AA, Drake J, Heiner C, et al. Nonhybrid, finished microbial genome assemblies from long-read SMRT sequencing data. Nat Methods. 2013;10:563–9.
38. Lee H, Gurtowski J, Yoo S, Marcus S, McCombie WR, Schatz M. Error correction and assembly complexity of single molecule sequencing reads. bioRxiv. 2014. doi: http://dx.doi.org/10.1101/006395.
39. Chaisson MJ, Wilson RK, Eichler EE. Genetic variation and the de novo assembly of human genomes. Nat Rev Genet. 2015;16:627–40. 40. Zhu Z, Zhang Y, Ji Z, He S, Yang X. High-throughput DNA sequence data
compression. Brief Bioinform. 2015;16:1–15.
41. Hsi-Yang Fritz M, Leinonen R, Cochrane G, Birney E. Efficient storage of high throughput DNA sequencing data using reference-based compression. Genome Res. 2011;21:734–40.
42. Cattell R. Scalable SQL, and NoSQL data stores. SIGMOD Rec. 2011;39:12–27. 43. Dean J, Ghemawat S. MapReduce: simplified data processing on large
clusters. Commun ACM. 2008;51:107–13.
44. Zaharia M, Chowdhury M, Franklin MJ, Shenker S, Stoica I. Spark: cluster computing with working sets. In: Proceedings of the 2nd USENIX Conference on Hot Topics in Cloud Computing. Boston, MA: HotCloud’10; 2010. p. 1–7.
45. Massie M, Nothaft F, Hartl C, Kozanitis C, Schumacher A, Joseph AD, et al. ADAM: genomics formats and processing patterns for cloud scale computing. Report No.: UCB/EECS-2013-207. Berkeley: EECS Department, University of California, Berkeley; 2013.
46. Greenbaum D, Sboner A, Mu XJ, Gerstein M. Genomics and privacy: implications of the new reality of closed data for the field. PLoS Comput Biol. 2011;7:e1002278.
47. Greenbaum D, Du J, Gerstein M. Genomic anonymity: have we already lost it? Am J Bioeth. 2008;8:71–4.
48. Stein LD, Knoppers BM, Campbell P, Getz G, Korbel JO. Data analysis: create a cloud commons. Nature. 2015;523:149–51.
49. Popa RA, Redfield CMS, Zeldovich N, Balakrishnan H. CryptDB: protecting confidentiality with encrypted query processing. In: Proceedings of the twenty-third ACM symposium on operating systems principles. ACM; 2011. p. 85–100. 50. Maas M, Love E, Stefanov E, Tiwari M, Shi E, Asanovic K, et al. PHANTOM:
practical oblivious computation in a secure processor. Proceedings of the 2013 ACM SIGSAC conference on computer & communications security. ACM; 2013. p. 311–24.
51. Illumina. A wide variety of library prep methods derived from the scientific literature. 2015. http://www.illumina.com/techniques/sequencing/ngs-library-prep/library-prep-methods.html. Accessed 22 Feb 2016.
52. Levine AG. An explosion of bioinformatics careers. Science. 2014;344:1303–4. 53. 1000 Genomes Project Consortium, Auton A, Brooks LD, Durbin RM,
Garrison EP, Kang HM, et al. A global reference for human genetic variation. Nature. 2015;526:68–74.
54. Cancer Genome Atlas Research Network, Weinstein JN, Collisson EA, Mills GB, Shaw KR, Ozenberger BA, et al. The Cancer Genome Atlas Pan-Cancer analysis project. Nat Genet. 2013;45:1113–20.