R E S E A R C H
Open Access
Organization and evolution of transposable
elements along the bread wheat chromosome 3B
Josquin Daron
1,2, Natasha Glover
1,2, Lise Pingault
1,2, Sébastien Theil
1,2, Véronique Jamilloux
3, Etienne Paux
1,2,
Valérie Barbe
4, Sophie Mangenot
4, Adriana Alberti
4, Patrick Wincker
4,5,6, Hadi Quesneville
3, Catherine Feuillet
1,2and Frédéric Choulet
1,2*Abstract
Background:The 17 Gb bread wheat genome has massively expanded through the proliferation of transposable elements (TEs) and two recent rounds of polyploidization. The assembly of a 774 Mb reference sequence of wheat chromosome 3B provided us with the opportunity to explore the impact of TEs on the complex wheat genome structure and evolution at a resolution and scale not reached so far.
Results: We develop an automated workflow, CLARI-TE, for TE modeling in complex genomes. We delineate precisely 56,488 intact and 196,391 fragmented TEs along the 3B pseudomolecule, accounting for 85% of the sequence, and reconstruct 30,199 nested insertions. TEs have been mostly silent for the last one million years, and the 3B chromosome has been shaped by a succession of bursts that occurred between 1 to 3 million years ago. Accelerated TE elimination in the high-recombination distal regions is a driving force towards chromosome partitioning. CACTAs overrepresented in the high-recombination distal regions are significantly associated with recently duplicated genes. In addition, we identify 140 CACTA-mediated gene capture events with 17 genes potentially created by exon shuffling and show that 19 captured genes are transcribed and under selection pressure, suggesting the important role of CACTAs in the recent wheat adaptation.
Conclusion: Accurate TE modeling uncovers the dynamics of TEs in a highly complex and polyploid genome. It provides novel insights into chromosome partitioning and highlights the role of CACTA transposons in the high level of gene duplication in wheat.
Background
First discovered in maize [1], transposable elements (TEs) are ubiquitous components of almost every eukaryotic genome investigated so far and their impact on genome structure and evolution is now well established (reviewed in [2]). Two classes of TEs have been defined: class I, or retrotransposons that use the element-encoded mRNA as a transposition intermediate; and class II, or DNA trans-posons that excise from their insertion site and transpose through a DNA intermediate. Among sequenced plant ge-nomes, TE abundance ranges from 20% in Arabidopsis thaliana [3] to 85% in maize (Zea mays) [4]. Genome
expansion is mainly mediated by the activity of class I ele-ments, while the content of DNA transposons is much more constant [5-7]. Furthermore, TEs are non-randomly distributed along the genome due to insertions [8,9] and de-letions [7,10] that trigger genome expansion/contraction. Hence, in rice (Oryza sativa) [11], sorghum (Sorghum bi-color) [12] and maize, long terminal repeat retrotransposons (LTR-RTs) accumulate preferentially in heterochromatin, such as centromeric regions, and are less abundant in the recombinogenic distal parts of chromosomes. A molecular mechanism responsible for the targeted integration of TEs in heterochromatin has begun to be understood [13]. A key component of the TE integration complex is a chro-modomain present at the carboxy-terminal part of the element-encoded integrase in some gypsy elements [14] that drives preferential insertion by targeting specific chromatin modifications [15]. Deletion of TEs can be identified by the identification of solo LTRs and truncated * Correspondence:[email protected]
1
INRA UMR1095 Genetics, Diversity and Ecophysiology of Cereals, 5 chemin de Beaulieu, 63039 Clermont-Ferrand, France
2
University Blaise Pascal UMR1095 Genetics, Diversity and Ecophysiology of Cereals, 5 chemin de Beaulieu, 63039 Clermont-Ferrand, France
Full list of author information is available at the end of the article
elements [6]. Presumably, solo LTRs are formed by unequal intra-chromosomal homologous recombination between two LTRs of an intact element [16]. In contrast, truncated elements are thought to be the outcome of illegitim-ate (nonhomologous) recombination. In rice, 190 Mb of LTR-RT DNA have been removed recently by these two processes, leaving a current genome of approximately 400 Mb that contains <100 Mb of detectable LTR-RTs [17]. In sorghum and rice, DNA transposons are localized essentially in the telomeric regions of the chromosome [11,12]. However, no evidence for a direct relationship be-tween genetic recombination rate and DNA transposon abundance has been provided so far in plant genomes [18], whereas it was observed in Caenorhabditis elegans
[19]. A key aspect of DNA transposons is their interaction with host genes [20]. For instance, they were shown to be involved in the creation of new genes through ‘exon shuffling’. In maize, 60% of the 20,000 Helitrons contain captured gene fragments [21,22]. Similarly, in rice, 2,809 Pack-Mutator-like elements (Pack-MULEs) containing host gene fragments were identified [23].
Identification of transposable elements in large and complex genomes is a daunting task, even in high quality assembled genomes. As an example, since 2001, in the rice genome, the number of miniature inverted-repeat TEs (MITEs) discovered has steadily increased over time from 6,641 to 179,415 [24-28]. A high-quality TE prediction and annotation is essential to prevent mis-annotation of functional genes and to understand the biology of ge-nomes [29]. Different strategies have been developed, in-cluding similarity search against databanks of known TE sequences, de novorepeat detection, k-mer-based count-ing, and structural motif detection (reviewed in [30]). Des-pite the development of many dedicated bioinformatic tools, precise TE modeling in complex (>1 Gb) genomes, such as in wheat or maize, is a tour de force. During the maize genome sequencing project (approximately 2 Gb), TEs were predicted with a variety of approaches: LTR-RTs and Helitrons were identified by structural criteria, while the rest of the TEs were annotated by similarity with a library built byde novodetection [4]. One of the main lim-itations to identifying TEs, and especially large TEs (>5 kb), was the fragmentation of the assembly with many gaps and a short median contig size (approximately 7 kb).
The wheat genome is large and highly complex (17 Gb, allohexaploid 2n = 6x = 42 with 3 closely related subge-nomes, AABBDD). Previous small-scale analyses revealed that the wheat genome is composed of about 80% TE-derived sequences, mainly nested into each other and with a few families representing 50% of the TE fraction [31]. Early, manually curated TE modeling was performed on selected bacterial artificial chromosome (BAC) sequences during map-based cloning projects or using plasmid or BAC end sequences [32-36]. At a larger scale, analyses of 18 Mb of
long BAC contig sequences spread along the 3B chromo-some [31] led to precise delineation of 3,222 TEs. Together with the publicTriticeaeREPeat sequence database (TREP) [37], this provided a representative high quality reference li-brary of wheat TEs. Beyond the identification of TEs, the reconstruction of the nested insertion pattern is a computa-tional challenge that requires fine tuning of dedicated algo-rithms and knowledge of TE structure and evolution.
Recently, a number of genome scale sequences were produced from different wheat genomes. Whole genome shotgun sequencing using short read sequencing tech-nologies has been performed on bread wheat and diploid species related to the homoeologous A and D genomes [38-40]. While these sequences have been useful to characterize the gene space, the assemblies were highly fragmented and therefore had only limited value for study-ing TEs. Moreover, they do not provide sufficient se-quence contiguity to assemble pseudomolecules, precluding the analysis of any TE feature distribution along a chromosome. To obtain a reference genome sequence of bread wheat, the International Wheat Genome Sequencing Consortium (IWGSC) [41] has established an approach based on flow sorting of individual chromosomes and the construction and sequencing of chromosome-specific physical maps. Recently, we produced a pseudomolecule for the largest wheat chromosome (3B), which represents 774 Mb, carrying 7,264 genes and 85% of TE-derived se-quences [42]. Gene annotation and comparative analyses indicated that chromosome 3B, and the wheat genome in general [43], carries a higher number of genes than related grass species. Moreover, the results showed that about 35% of the 3B genes share similarity with genes located on non-orthologous chromosomes in other grasses [42]. These‘nonsyntenic’genes likely originate from interchro-mosomal duplications triggered by diverse mechanisms such as double strand break repair or TE mobilization.
In this study, a strategy dedicated to TE-modeling in a complex genome was developed to decipher the complex organization of TEs along a wheat chromosome. Analyses of the distribution of the abundance, diversity and dynam-ics of TEs revealed a striking partitioning of the chromo-some, as observed for other features on chromosome 3B [42]. In addition, we observed a massive amplification of CACTA DNA transposons compared with other related grass species with a significant association between some CACTA families and recently duplicated genes, suggesting a role for CACTA transposons in gene duplications, gene capture, and genome plasticity in wheat.
Results
An improved procedure for predicting transposable element models and their nested pattern in a complex genome
remains a computational challenge, and obtaining a high quality annotation still requires manual curation. Typically, TE prediction is performed by similarity search with a set of known TE sequences. A major prerequisite to achieve a high quality annotation is the availability of a curated TE reference library. This is essential to identify most transpo-sons via similarity search-based approaches and to restrict thede novodetection of repeats to the unassigned portion of the genome sequence. In wheat, two curated libraries dedicated to Triticeae (wheat, barley and rye) TEs are available: TREP, which contains 1,717 TEs representing 323 families, and an additional set of 3,212 TEs manually annotated in a previous pilot study of chromosome 3B [31]. For most of them, the borders of the mobile element have been defined precisely and their completeness - that is,‘complete element’versus‘fragmented element’- is also available. However, there are incongruencies in the classifi-cation of the TEs; most of the TEs were assigned a family name based on their best BLAST hit, which can lead to an overestimation of the family numbers [44].
To ensure proper TE modeling of the 774 Mb of se-quence from chromosome 3B, we first built a classified TE library (ClariTeRep; see Materials and methods) using the 3,050 complete TE sequences from these two libraries. In total, 525 families, comprising 1 to 266 copies each, were clustered based on their sequence similarity. Among the families described in TREP, 40% (277/700) have a one-to-one relationship with the ClariTeRep classification while the others were mostly aggregated into a single family and, sometimes, split into different families. More than 80% of the TREP families comprise one to two TE copies only versus 57% for ClariTeRep, confirming that the similarity-based classification increases the number of fam-ilies compared with the clustering-based approach [44].
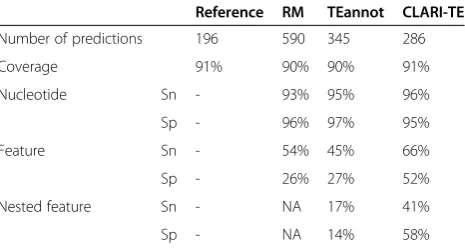
In the second step, we automated two things: (i) cor-rection of the over-fragmentation of TE predictions, that is, the fact that a TE is not detected as a single feature but rather split into several neighboring ones; and (ii) the reconstruction of nested TE insertions. To this aim, we developed a program called CLARI-TE, which allows merging neighboring predictions that belong to the same family (see Materials and methods). Then, nested clus-ters were automatically reconstructed by joining remote predictions belonging to a single element. We estimated the accuracy of the automated annotation by analyzing a manually annotated sequence of approximately 1 Mb (scaffold v443_0137) containing 196 TEs and 47 nested insertions that was manually annotated for this purpose. We compared the annotation produced by RepeatMasker (using ClariTeRep) with that from CLARI-TE and another annotation pipeline, TEannot (part of the REPET package [45]) (Table 1). At the nucleotide level, RepeatMasker cor-rectly assigned approximately 90% of nucleotides that be-long to TEs, showing that our TE library is comprehensive
enough to detect the vast majority of TEs in a wheat gen-omic sequence. However, the 196 TEs were predicted as 590 separated features with RepeatMasker, illustrating the over-fragmentation problem. The improvement was sig-nificant when using both TEannot and CLARI-TE, which detected 345 and 286 features, respectively (Table 1). CLARI-TE was more accurate than TEannot in predicting the correct borders of the TEs (sensitivity of 66% versus 45%, respectively) and in limiting the number of false posi-tives (specificity of 52% versus 27%, respectively). In addition, CLARI-TE was able to perform the reconstruc-tion of nested clusters much more accurately than TEan-not (Table 1). The accuracy of nested insertion mining was in fact highly dependent on the type of TEs: sensitivity and specificity were much higher forgypsyandcopia ele-ments (53% and 68%, respectively) than for CACTAs (13% and 40%, respectively). This suggests that CACTAs exhibit a higher level of sequence variability and that CACTA-typical short tandem repeats limit our ability to identify them through fully automated procedures.
Transposable element content and distribution along chromosome 3B
[image:3.595.306.539.123.247.2]We used CLARI-TE to predict TE models along the 833 Mb of chromosome 3B (a sequence corresponding to the 3B pseudomolecule (774 Mb) and unanchored scaffolds (59 Mb)) in order to study the organization and dynamics of TEs along a wheat chromosome. In total, 523,233 RepeatMasker-detected features were combined with CLARI-TE to obtain a final set of 56,488 complete TEs (that is, with two borders corresponding to the borders of a reference element) and 196,391 truncated or partially assembled elements. Given the estimates of the sensitivity and specificity of our approach to predict complete TEs, we can extrapolate to approximately 73,000 the number of intact TEs carried by the 3B chromosome. Thus, using
Table 1 Comparison of the accuracy of transposable element modeling on a 1 Mb scaffold of wheat chromosome 3B
Reference RM TEannot CLARI-TE
Number of predictions 196 590 345 286
Coverage 91% 90% 90% 91%
Nucleotide Sn - 93% 95% 96%
Sp - 96% 97% 95%
Feature Sn - 54% 45% 66%
Sp - 26% 27% 52%
Nested feature Sn - NA 17% 41%
Sp - NA 14% 58%
CLARI-TE we are able to reduce the fragmentation of the annotation by two-fold and detect the largest set of full-length TEs and nested clusters ever observed on a plant chromosome so far. The number of large TEs (>5 kb) was doubled (from 16,988 to 30,894) when using CLARI-TE. Moreover, 30,199 nested insertions were reconstructed, comprising up to 8 layers and 320 clusters larger than 100 kb (and up to 301 kb). Overall, TEs represent 85% of the 833 Mb of chromosome 3B scaffolds. In addition, the de novo identification revealed 3% of previously uncharac-terized TEs [42]. We applied the same approach to anno-tate the draft genome sequences of the A- and D-related diploid progenitors:Triticum urartu(approximately 3 Gb) [39] and Aegilops tauschii (approximately 2.6 Gb) [40]. TEs account for 77% and 74% of the A and D diploid genome assemblies, respectively (Table S1 in Add-itional file 1). We also found the proportion of complete TEs to be 12% and 11%, respectively, that is, two times lower than on chromosome 3B (22%).
The annotation revealed that class I and II TEs repre-sent 67% and 18% of the 3B sequence, respectively, with a vast majority of the chromosome corresponding to
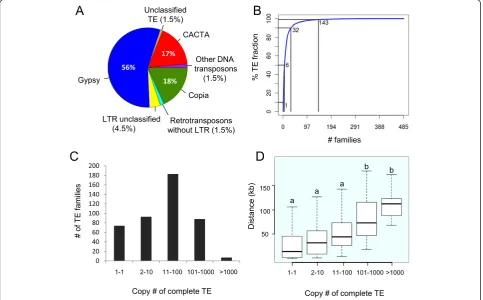
LTR-RTs (529 Mb, 66% of the chromosome; Table S1 in Additional file 1). Three superfamilies (gypsy, 47%; CACTA, 16%;copia, 16%) account for more than 79% of the total TE fraction (Figure 1A). This proportion of CACTAs is much higher than in the other sequenced grasses: 3.2% in maize [4], 4.7% in sorghum [12], 3.4% in rice [11], and 2.2% in Brachypodium distachyon [46]. We also found a higher proportion of CACTAs in the draft genome se-quences of T. urartuand Ae. tauschii (12.3% and 15.6%, respectively; Table S1 in Additional file 1), suggesting that most of the CACTA amplification occurred before the divergence of the A, B and D genomes. Other DNA transposons are less abundant in terms of proportion but some correspond to small size elements found in very high copy numbers. For example, 17,479 MITEs (clustered into 95 families) of, on average, 142 bp, mostly from the
Marinersuperfamily, were detected along the 3B chromo-some sequence.
[image:4.595.57.541.377.677.2]In total, 485 families were detected along the 3B chromo-some with only 6 families representing 50% of the TE fraction, and 143 representing 99% of the TE fraction (Figure 1B). The most abundant element was the LTR-RT
Figure 1Transposable element content and copy number of the wheat chromosome 3B sequence. (A)Pie graph of the relative composition of the main TE superfamilies.(B)Cumulative sum of the number of TEs families among the TE fraction. The N50 is 6, meaning that six TE families represent 50% of the TE fraction (in number of nucleotides).(C)Distribution of the number of copies per family (considering complete copies only).
RLG_famc1 (Fatima) family with 7,036 complete and 8,003 fragmented copies that account on their own for 12% of the TE fraction. Fifteen percent (74) of the families are represented by a single copy element on the entire chromosome 3B sequence while 2% (7) have ampli-fied into more than 1,000 copies. Therefore, most of the TE families are not single copy member families but have rather amplified at a medium copy number (between 11 and 100) within this chromosome (Figure 1C). This pat-tern is different from what has been described for related grasses where single copy member families represent be-tween 66% and 81% of the families in rice,Brachypodium, sorghum, and maize [44]. We evaluated the impact of the classification methods on these findings by comparing the average percentage of identity between members of the LTR-RT families for the different grass genomes (Figure S1 in Additional file 1). Our clustering approach resulted in an average of 77% identity over the full length of TEs while this percentage was higher (ranging between 86% and 89%) in the classification of El Baidouriet al. [44] for Brachypodium, rice, sorghum, and maize. Applying a cutoff at 77% identity showed that the proportion of single copy member families decreases drastically in the related grasses (16%, 52%, 25%, and 17% in rice, Brachypodium, sorghum and maize, respectively), leading to a distribution similar to that observed in wheat. When calculating the distance between each TE and its neighboring genes we observed that low-copy number families are significantly closer to genes than highly repeated families (one-way ANOVA, P-values <4.5e-11; Figure 1D). Indeed, families with less than 100 copies were found to be significantly closer to genes than families having more than 100 copies (Bonnferroni/Dunn test,P-values <4e-4).
Overall, the TE distribution along the chromosome is strongly correlated with that of thegypsy elements (R = 0.97) and is negatively correlated with the recombination rate (R = -0.82,P-values <10e-10) (Table S2 in Additional file 1). The CACTA superfamily exhibits the exact op-posite pattern, with a significant increase of 23% in the distal regions (18 to 19%) compared with the proximal region (15%; Figure 2). Similar to CACTAs, but at a lower level, class II transposons - Harbingers, hATs, Mariners, Mutators, and Helitrons - are twice as abundant in the distal regions compared with the proximal region and their distribution is strongly correlated with both the gene density (R = 0.63) and recombination rate (R = 0.71).
The distribution of TE diversity - that is, the number of different families per 10 Mb - along the chromosome was also investigated. It revealed a higher diversity in the distal regions (210 different TE families per 10 Mb on average, maximum of 244 families within 10 Mb) than in the central part of the chromosome (134 different families per 10 Mb; Figure S3 in Additional file 1). The diversity of DNA transposons increases by 2.6-fold in the distal region
compared with the centromere whereas the diversity in LTR-RTs is homogeneous along the chromosome (106 ± 7 families per 10 Mb; Figure S3 in Additional file 1). It is worth noting that the patterns of distribution of TE diver-sity and TE dendiver-sity are opposite. Thus, the increase in the amount of TEs in the centromeric regions is due to the accumulation of several copies from the same families.
Segmentation analysis (see Materials and methods) of TE density variations along the chromosome showed the presence of five distinct regions. The two chromosome ends, representing 18% of the chromosome (63 Mb and 73 Mb on the short and long arms, respectively), exhibit the lowest TE content (71%). The 122 Mb (16% of the chromosome region) encompassing the centromere [42] has the highest TE content (93%). Finally, the two core parts of the chromosome arms (66% of the chromosome; 200 Mb and 316 Mb for the short and long arms, re-spectively) exhibit an average TE content of 88%. The borders of the two distal TE-poor regions correspond al-most exactly to the regions (R1 and R3) defined by the recombination pattern in [42].
Uneven distribution and impact of transposable elements on the evolution of the chromosome structure
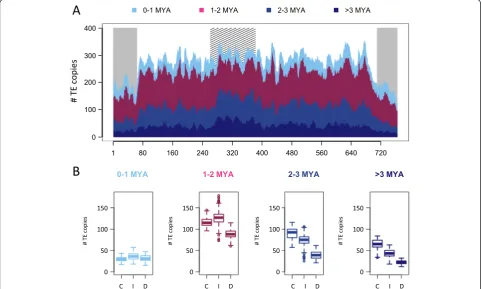
Figure 2Distribution of variations of transposable element density along wheat chromosome 3B.Distributions are represented for four superfamilies:gypsy(blue),copia(green), CACTA (red), and other DNA transposons (purple). The distributions were calculated in a sliding window of 10 Mb with a step of 1 Mb and the graphs represent the standard score, that is, variations around the mean in number of standard deviations. Recombinogenic distal and centromeric/pericentromeric regions [42] are labeled by grey and hatched areas, respectively.
[image:6.595.56.541.420.681.2]of 10 master copies. Beside a global burst of transposition at 1.2 MYA, transposition bursts of each variant occurred between 0.9 and 3.0 MYA. A bimodal distribution was ob-served for RLC_famc2 with an old peak around 7 MYA and a recent one at 1.45 MYA. The dendrogram of the RLC_famc2 family revealed the presence of at least five master copies that have successively amplified, highlight-ing the fact that highly repeated families amplified via successive waves of transposition involving one or a few master copies that escape silencing. In order to investigate the type of evolutionary forces that have shaped the chromosome 3B structure, we studied the potential differ-ences in chromosomal distributions of LTR-RTs depend-ing on their insertion date. Four different categories were defined based on the TE insertion at <1 MYA, 1 to 2 MYA, 2 to 3 MYA, and >3 MYA (Figure 4). The analysis revealed that the gradual increase in the proportion of LTR-RTs from the telomeres to the centromere is in fact explained by an overrepresentation of ancient elements (>3 MYA). Indeed, no significant variation in the density of young (<1 Mya) LTR-RTs was observed along the chromosome, whereas enrichments of 1.3-, 2.3- and 2.8-fold were found in the proximal compared with the distal
regions for TEs inserted 1 to 2 MYA, 2 to 3 MYA, and >3 MYA, respectively. These results suggest that new TE in-sertions occur at a similar rate along the chromosome and, consequently, that the gradient observed is due to a higher rate of elimination in the recombinogenic distal regions.
[image:7.595.57.540.376.665.2]One of the prevalent mechanisms for LTR-RT elimin-ation is the formelimin-ation of solo-LTRs through ectopic hom-ologous recombination between pairs of LTRs [16]. We detected 3,998 solo-LTRs with target site duplications on the chromosome 3B pseudomolecule, revealing a ratio of solo-LTRs to intact elements of 0.13:1, similar to what was observed previously in both wheat (0.14:1) [31] and maize (0.14:1) [44] but much lower than in rice (1.39:1) [44]. The second mechanism involved in TE turnover is illegit-imate recombination that generates truncated TEs. A ratio of truncated to intact elements of 3.5:1 was found on the pseudomolecule, which is higher than the 0.5:1 ratio esti-mated previously for chromosome 3B [31]. This is mostly because of a higher number of gaps found in the assembly of the pseudomolecule versus a few BAC contigs whose sequence was completely finished that led to prediction of intact elements as truncated. A higher ratio of truncated
versus intact elements (27:1) was estimated in maize due to an even higher number of gaps, especially in LTR-RTs, in a sequence that was mostly aimed at completing the gene space [47]. Nevertheless, given that the assembly quality is homogeneous along chromosome 3B, local vari-ations in the truncated to intact ratio were investigated. This revealed a pattern very similar to the ratio of solo/ intact elements (Figure S4 in Additional file 1) with a sig-nificant increase in telomeric regions compared with the proximal region (one-way ANOVA,P-value <0.001), again suggesting faster TE turnover in recombinogenic regions. Hence, the proportions of both solo-LTRs and truncated LTR-RTs are correlated with the recombination rate (R = 0.41 and R = 0.56, respectively;P-value <0.001).
Preferential insertion of large TEs could also play a role in the observed uneven distribution, since the chromodomain-containing integrase of LTR-RTs could specifically target heterochromatin [13]. Among the 68gypsyfamilies identi-fied on the 3B pseudomolecule, 7 encode a chromodomain-containing integrase and their distribution is biased with an increase in the proximal region (Figure S5 in Additional file 1). The abundance ofgypsyelements harboring a chro-modomain increases by 80% in the proximal region while
gypsyelements without chromodomains increase by 20%, suggesting that chromatin affinity during transposition may also have contributed to this pattern.
Impact of CACTA transposons on the evolution of the gene content through gene duplication
Chromosome 3B carries at least 2,065 genes/pseudogenes that are nonsyntenic with the related model grass genomes ofB. distachyon, rice, and sorghum [42]. These genes origi-nated from recent interchromosomal duplications (after the divergence withBrachypodium39 MYA [46]) and have preferentially accumulated in the distal regions of the chromosome. DNA transposon-mediated gene capture, which has already been suggested in wheat [31], was per-formed to estimate the relationship between the increases of both CACTAs and duplicated genes in the distal re-gions. In order to identify CACTA families significantly associated with the nonsyntenic genes, hierarchical clus-tering was applied to distributions of CACTA families (see Materials and methods; Figure 5A). We identified two groups containing 22 and 6 families (out of 30 families) with opposite patterns. The first group of 22 families was found to be overrepresented in the distal region (for ex-ample, the Caspar family), while the second one contain-ing six families was more abundant in the proximal regions (for example, theJorgefamily) (Figure 5B). Investi-gating potential site-specific insertion (within 50 bp around the elements) did not show any preferential insertion site for any of these groups. In addition, the two groups shared similar transposase domains. Distribution of subtelomeric-prone CACTAs was highly correlated with the distribution
of nonsyntenic genes (R = 0.8). Then, we compared their frequency in the close vicinity (±20 kb) of nonsyntenic versus syntenic genes (Figure 5C). This revealed that subtelomeric-prone CACTAs are twice as frequent in the vicinity of nonsyntenic versus syntenic genes. By contrast, no difference was observed for the centromeric-prone CACTAs. For example, the DTC_famc5 (Vincent) family exhibited a six-fold increase in the promoter (5 kb up-stream) region of nonsyntenic genes compared with syn-tenic genes.
We detected 140 CACTA-mediated capture events in-volving 145 genes and 11 CACTA families (see Materials and methods). The DTC_famc5 (Vincent) family accounted for 74% (104) of the cases. Captured genes were smaller (average coding sequence (CDS) size of 488 bp versus 1,090 bp) and with fewer exons (3.05 versus 4.11) than the average genes on chromosome 3B. Forty-six percent of them exhibited a structure likely to be functional while the others were classified as pseudogenes. Using expres-sion data (RNAseq performed on five organs at three de-velopmental stages each [48]), we showed that 26% (38) of the CACTA-captured genes were transcribed. The 145 gene copies captured represent 121 different families of genes. Interestingly, we found two cases where the same gene was captured twice by two different CACTAs. A putative 3′-5′ exonuclease encoding gene is repeated in three copies of the DTC_famc5 (Vincent) family (TRAES3BF090200030CFD_t1, TRAES3BF060400250CFD_t1, TRAES3BF060000130CFD_ t1) and in seven copies of the DTC_famc6 family (TAT) (TRAES3BF032300010CFD_t1, TRAES3BF032400050CFD_ t1, TRAES3BF067500010CFD_t1, TRAES3BF077700050CFD_ t1, TRAES3BF082000030CFD_t1, TRAES3BF168400140 CFD_t1, TRAES3BF182300010CFD_t1). The high level of conservation between the captured segments suggests that these two families have recently exchanged DNA.
We were able to detect 17 (12%) captured genes that po-tentially originate from exon shuffling involving 36 paren-tal genes (see Materials and methods). Among them, eight genes showed expression in at least one of the conditions analyzed. Then, we estimated the type of selection pressure applied to those genes that are likely functional by estimat-ing the dN/dS ratio (ω) through sequence alignment with their closest homolog in B. distachyon. It revealed that most of the captured genes are under purifying selection, with a dN/dS ratio ranging from 0.2 to 0.6 (Figure 6). In contrast to the (ω) distribution observed for syntenic and nonsyntenic genes, we observed significantly larger disper-sion for the captured genes (Fisher test, P-values <10-5), which indicates a more relaxed selection pressure on cap-tured genes. In total, 19 capcap-tured genes (13%) were found to be expressed with a dN/dS ratio lower than 0.4.
a range similar to the 1,194 genes captured by Helitron in maize [21] and 2,809 by Pack-MULE in rice [23].
Discussion
A fine-tuned strategy for constructing accurate models of transposable elements in a highly complex genome
Annotating TEs automatically and precisely in complex genomes is a challenge. However, high-quality TE anno-tations are necessary, not only for performing evolution-ary analyses and better understanding the impact of TEs on genome organization and expression, but also to pre-vent mis-prediction of genes with cellular functions [29]. Here, we developed a strategy to overcome some of the problems due to the over-fragmentation of the predic-tions usually observed during TE modeling in large ge-nomes. We used the knowledge accumulated during the past decades [31,34,36,49] to fine-tune our algorithm and automatically reconstruct nested clusters that can
still be identified. With CLARI-TE, we were able to pre-dict a set of 56,488 intact TEs on chromosome 3B. Half of the large intact TEs (>5 kb) were initially predicted as several truncated fragments through similarity search, revealing that for the time being curation is absolutely required to precisely delineate TEs in complex genomes. Moreover, among the 21,165 insertions of LTR-RTs that were used to study the dynamics of insertion/deletion along chromosome 3B, 30% were nested and, thus, would have been missed without automated joining by CLARI-TE. The use of our program prevented biasing the data towards re-cent TE insertions as usually observed in signature-based approaches [10,44]. Finally, with a curated TE library, this approach can be applied to any complex genomes (>50% TEs) with nested TEs.
The proportion of complete elements was lower than estimated previously in our pilot study on selected BACs from chromosome 3B [31]: they represent 22% and 6%
A
B
0 +10 +20
-20 -10
0 2 10
8
6
4
0 2 10
8
6
4
0 +10 +20
-20 -10
C
kb kb
% of
T
E
% of
T
E
% of
T
E
f
ract
ion
Mb
1 80 160 240 320 400 480 560 640 720
0 5 10 15 20 0 5 10 15
[image:9.595.60.540.86.417.2]Subtelomeric-prone CACTAs Centromeric-prone CACTAs
for LTR-RTs and CACTAs, respectively, compared with 59% and 47% in the previous manually curated annota-tion. Similar observations have already been reported in maize, where the ratio of truncated to intact elements was estimated to be 0.5:1 [50], while it was 27:1 in the annotation of the reference genome sequence [47]. In both cases, the proportion of gaps, which is a reflection of the quality of the assembly, is the main limiting fac-tor. Indeed, there are still 40,459 gaps in the chromo-some 3B pseudomolecule, of which 57% were included in a TE by CLARI-TE, while the others prevented recovery of the surrounding TE structure. About 85% of the TEs sur-rounding a gap were annotated as truncated. In addition, CACTAs are the largest wheat TEs (up to 30 kb), are highly variable, and contain tandem repeated motifs, features that make them the most challenging superfamily to iden-tify automatically.
Estimations of TE composition or organization of com-plex genomes are highly dependent on the reference TE li-brary used as a basis for similarity search. In this study, similarity search-based annotation led us to assign 85% of the 3B sequence to TEs. Then, ade novorepeat identifica-tion allowed us to classify an addiidentifica-tional 3% of the se-quence to newly discovered repeats. Such a low value revealed that the ClariTeRep library is an almost exhaust-ive representation of the TE dexhaust-iversity present on the 3B chromosome, suggesting that downstream analyses were not biased by a lack of knowledge regarding the TE com-position of the chromosome. Although the three homoeo-logous wheat subgenomes are similar in size and, thus, have similar proportions of TEs, this proportion appeared substantially higher on chromosome 3B than the 66% and 67% estimates obtained for the diploid genomes of
T. urartu (AA) [39] and Ae. tauschii (DD) [40]. Such a
difference highlights the strong impact of the method-ology used to annotate TEs, rather than biological signifi-cance. This is supported by the results obtained after applying our TE modeling approach to these two draft genome sequences and the finding that TEs represent 77% and 74% of them, respectively, that is, proportions that are closer to what we have found for chromosome 3B. The main difference is related to the lack of knowledge regard-ing CACTAs in the reference TE library. Here, we pre-dicted two to three times more CACTAs than previously suggested (5.44% forT. urartu, and 6.01% forAe. tauschii), confirming the impact of the reference TE library on the biological interpretations. Finally, differences in TE propor-tions found between the diploid genomes and chromo-some 3B are probably due to lack of sequence in the A and D draft genome sequences. With estimated sizes of 5.5 Gb and 5 Gb for T. urartu [39] and Ae. tauschii [40,51], respectively, TEs should represent 80 to 82% of the gen-ome, considering that low copy DNA represents 1 Gb of the genome [42].
Transposable element organization and dynamics
[image:10.595.57.290.88.272.2]The 774 Mb 3B pseudomolecule represents the largest chromosome sequence ever assembled into one pseudo-molecule. The uneven distribution of recombination rate, gene density, gene expression pattern, and TEs along the chromosome highlighted a striking partitioning with five distinct regions: a centromeric/pericentromeric region with the highest TE density and in which recombination is suppressed; two subtelomeric regions with the lowest TE density and where recombination mainly occurs; and two internal parts of chromosomal arms with intermediate features [42]. Behind the static view, the detailed study of TEs provided a dynamic view and novel insights into the evolutionary forces that have shaped this partitioning. First, we observed that LTR-RTs are the main contributors to the uneven distribution of TEs along the chromosome, a common feature of complex genomes like that of maize [47]. In contrast to other grass genomes where TEs have mainly transposed recently, we found a major amplifica-tion period 1.5 MYA that has been followed by a period of silencing and/or of increased loss from 1.0 MYA until now, confirming that the two hybridization events that led to hexaploid wheat did not trigger massive activation of transposition. Previous studies in wheat have shown a TE transposition burst immediately after allopolyploidization [36,52], but as suggest by Parisodet al. [53], this is prob-ably a phenomenon restricted to specific TE families, and to mostly young, active TE populations. The availability of 21,165 complete LTR-RTs allowed us to study the TE ac-tivity at a scale not reached so far, revealing that each fam-ily had its own period of activity. Thus, overall, the B genome has been shaped by a succession of transposition waves from different families, some of which have escaped Figure 6Selection pressure estimated by the dN/dS ratio for
silencing, rather than by massive reactivation of all TEs simultaneously. Similar waves of amplification have already been described, such as in soybean [44], and are obviously observed in genomes where LTR-RTs have not been quickly eliminated.
The distribution of the TE insertion time along the chromosome showed an uneven pattern that is mainly due to the differential location of old LTR-RTs (those >3 MYA). In contrast, recently inserted elements (<1 MYA) exhibited a much more even distribution, suggesting that transposition occurred at similar rates along the chromo-some and that the decrease of TE density towards the telomeres rather reflects a rapid elimination in the recom-binogenic distal regions. Similar conclusions were suggested for the sorghum [12] and maize [47] genomes, while for more compact genomes, such as that of Arabidopsis, the enrichment of LTR-RTs in the centromeric regions has been explained by selection against the insertion of dis-ruptive TEs in gene-rich regions [54]. Additional evidence for the more rapid elimination of TEs at the chromosome ends includes the overrepresentation of solo-LTRs and truncated LTR-RTs. This suggests that unequal homolo-gous recombination (generating solo-LTRs) and illegitim-ate recombination (generating truncillegitim-ated TEs) are more frequent in the distal recombinogenic regions, as observed in rice [18]. In contrast to LTR-RTs, the density of class II DNA transposons increased in the distal regions and is positively correlated with both gene density and re-combination rate. Such correlation was also observed in sorghum [12] and maize [4] but not in rice [18]. Non-autonomous DNA transposons are well known to be asso-ciated with genes [55,56] and their role in the regulation of gene expression has been suggested [8,57]. In wheat, with the exception of CACTAs, DNA transposons are shorter than class I elements and their insertion into gene-rich regions might be counter-selected at a lower fquency. In addition, the faster TE turnover in the distal re-gions suggested above could also explain the increase in DNA transposon density in these regions as a simple con-sequence of the compaction of the intergenic space that is mostly shaped by LTR-RTs. This differential deletion rate may also explain the increased TE diversity. Such a pat-tern was described in maize where the centromere was perceived as an environment settled only by‘individuals’ that were most adapted to proliferate, creating a diversity-poor ecosystem [47]. Finally, preferential TE insertion seems to be a potential driving force towards the partition-ing of chromosome 3B, with sevengypsyfamilies having a chromodomain-containing integrase [13] significantly con-centrated in the proximal region.
Impact of CACTA transposons on gene duplication in wheat
DNA transposons represent 18% of the 3B chromosome sequence, which is the highest proportion observed among
the sequenced grass genomes so far. CACTAs are the main contributors, representing 16% while they account for only 2.2% to 5.9% in sorghum, rice, Brachypodium, maize and barley [4,11,46,58]. This supports the hypothesis that CACTAs have been amplified specifically in the wheat lineage. Generally, genome size is mainly correlated with class I elements - for example, LINEs in human [59] and LTR-RTs in plants [60,61] - because of their copy-and-paste transposition mechanism allowing an increase in number in a short time period [62,63]. Thus, among plants, the wheat genome appears as a rare example of a massive amplification of cut-and-paste transposons.
Interestingly, 22 CACTA families were found to be pref-erentially associated with nonsyntenic genes, that is, genes that have been relocated via recent duplication events to a new chromosomal location. Previous studies in soy-bean [64], sorghum [12], and Ipomoea tricolor [65] have shown that CACTAs can capture genes and gene frag-ments. Here, we identified 145 CACTA-captured genes on chromosome 3B (2% of the gene content). Although most of them were gene fragments, as already observed at a smaller scale [66], 13% were both transcribed and under purifying selection, suggesting they are functional, and 12% likely originating from exon shuffling. Beyond gene capture mechanisms, CACTAs were proven to mediate gene duplication in wheat through double strand break re-pair created at the time of insertion [66]. Preferential asso-ciation of CACTAs with nonsyntenic genes might reflect a higher rate of gene duplication, due to the high frequency of CACTA insertion. This study highlights the importance of CACTAs for gene duplication and the creation of new genes that may be associated with the adaptation of wheat to various environments [42]. Similar examples involving class II transposons have been described with Mutators in rice [23,67] and Helitrons in maize [21,22]. Therefore, it seems that superfamilies involved in gene capture have a tendency to proliferate and to be evolutionarily successful.
Conclusion
Materials and methods
Establishment of a classified library ofTriticeae transposable element sequences
A library of TE sequences dedicated to similarity search-based annotation of TEs in the wheat genome was built as described in Chouletet al. [42]. Briefly, we retrieved 3,159 known full-length TE sequences, that is, elements having terminal repeats (terminal inverted repeats or LTRs) and/or features typical of complete LINEs/SINEs. We built 16 groups corresponding to each superfamily, and small non-autonomous MITEs were grouped separately from their autonomous counterparts to avoid computing multiple alignments with sequences of very different sizes. For each of the resulting 16 groups, an all-by-all BLAST [68] comparison (without filtering out low complexity se-quences) was performed. BLAST output was analyzed with MCL (option -I 1.2) [69] in order to build clusters of se-quences sharing similarity. The -I option, controlling the cluster granularity, was set to 1.2 for‘very coarse grained clustering’, meaning that large clusters were built at that stage. These clusters were used to define the family level. Families of three or more members were considered for computing a multiple alignment using MAFFT (default parameter) [70]. A manual curation step was then applied. We used Jalview [71] as a visualization tool for the manual curation of the multiple alignments and their correspond-ing neighbor joincorrespond-ing tree. Sequences introduccorrespond-ing mistakes in the multiple alignments (due to inversions, deletions, or insertions) were identified and discarded so that all alignments were corrected. In addition, since MCL grouped sequences within large clusters, we identified the clearly separated monophyletic groups (according to the neighbor joining tree) among each individual family and, there-fore, defined variants within the family; for instance, family RLG_famc8 is composed of three variants called RLG_famc8.1, RLG_famc8.2, and RLG_famc8.3. We named the library ClariTeRep and it is available upon request.
Estimating the accuracy of transposable element prediction
We used a scaffold of 904 kb from the wheat chromosome 3B that does not correspond to a previously known region of the genome as a test sequence to estimate the accuracy of the TE modeling. This reference scaffold carries 196 TEs covering 91% of the sequence, with 47 nested inser-tions. To automate the comparison of the automated ver-sus manually curated TE predictions and the calculation of sensitivity and specificity values, we developed com-pareAnnotTE.pl. Sensitivity and specificity were both estimated at three different levels: nucleotide, feature, and nested feature. At the nucleotide level, each nucleotide was considered to calculate sensitivity and specificity. At the feature level, only TE borders (all segments of TEs split into several pieces by nested insertions) were considered.
At the nested feature level, the program considers borders of nested TEs to estimate the accuracy of the reconstruc-tion of nested clusters. At the feature and nested feature levels, a predicted feature was considered as true positive if its borders correspond to the manually curated TE posi-tions in a range of 10 bp.
Similarity search and automated curation using CLARI-TE
We applied our procedure to the 2,808 scaffolds assembled for the 3B chromosome (HG670306 and CBUC010000001-CBUC010001450), and theT. urartu[39] andAe. tauschii
genomes [40]. Each sequence was investigated for TE content using RepeatMasker (cross_match engine with default parameters) [72] with ClariTeRep. We developed CLARI-TE, a perl program [73,74], to correct the raw similarity search results. It performs the three following steps. First, resolution of overlapping predictions. To solve the overlap between two predictions, priority was given to keep the prediction that covers an extremity of a TE. If none or both of the predictions cover a TE extremity, pri-ority was given to keep the longest prediction and recalcu-late the positions of the other one. Second, merging predictions. Fragmentation of the TE models is due to the presence of gaps in the scaffolds and to the fact that a newly identified TE copy may diverge from the reference element so that one element is not predicted as a single piece but is rather split into several pieces matching differ-ent parts of elemdiffer-ents from the same family. In that case, all neighbor pieces related to the same family were merged into a single feature if the collinearity of the matching seg-ments was respected, except for LTR matching segseg-ments. LTR positions of reference TEs were annotated in our li-brary and this information was considered during the merging process. Third, reconstruction of nested TEs. We developed a procedure to join separated features that are part of the same TE and have been split by nested inser-tions. Joining was allowed when two segments matching the same family (with respect of the collinearity between the prediction and the reference TE) are separated by a maximum of 10 predicted TEs. The final stage of the annotation is the assignment of intact full-length versus fragmented TEs. Intact full-length TEs are predictions covering at least 90% of the reference complete TE in the library and for which both extremities were identified (in a range of 50 nucleotides). Moreover, PFAM domains were searched for every complete element to detect chromodo-mains and transposase-like dochromodo-mains.
Estimation of LTR-RT insertion date and phylogeny
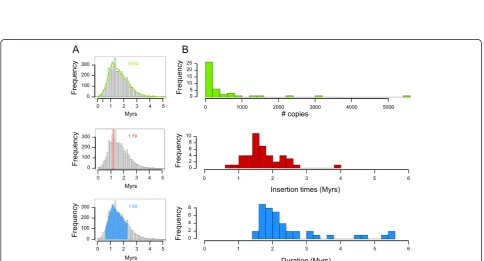
and insertion dates of LTR-RTs were estimated consider-ing a mutation rate of 1.3 × 10⁻⁸ substitutions/site/year [76]. Finally, using R, the distribution of insertion dates was plotted for each family with 20 or more copies with an estimated date. For each distribution, a burst peak date was determined and a period of activity was calculated by considering the shortest period of time containing more than 80% of the dated insertions. Phylogeny was established by computing multiple alignments of all intact LTR-RTs belonging to families RLG_famc1 and RLC_famc2 using MAFFT [70]. A neighbor-joining tree was then built using FasTree [77]. The tree was drawn using figtree 1.4.2 [78].
Distribution of transposable elements along the chromosome
The distribution of TEs along the chromosome 3B se-quence was computed by calculating the proportion (in size) and number of TEs in a sliding window of 10 Mb with a step of 1 Mb. The distribution of the TE diversity along the chromosome was computed using the same window by calculating the number of families per window. To prevent drastic variations due to mis-predictions, we considered the number of families representing 99% of the TE fraction per window (N99).
Prediction of solo-LTRs
Based on of the 30,406 intact LTR-RTs predicted on chromosome 3B, we built a library of LTR sequences by extracting 18,928 LTRs flanked by canonical 5′-TG and 3′-CA dinucleotides. This library was used for an add-itional round of similarity searching using RepeatMasker on the full chromosome 3B. To distinguish solo LTRs from truncated LTR-RTs, we searched specifically for the presence of a 5 bp target site duplication (one nucleotide variation tolerated) flanking the matching region.
Hierarchical clustering of distributions
In order to identify CACTA families with similar distri-butions along the chromosome, we performed a hierarch-ical clustering of the distributions calculated in a sliding window of 10 Mb (step of 1 Mb) by using the R package ‘pvclust’[79]. We considered only families representing at least 0.01% in at least one 10 Mb window. The Pearson correlations were calculated between each pair of distribu-tion and a clustering was applied by the agglomerative method‘average’(N = 10,000 bootstrap resampling).
Transposable element abundance in the vicinity of genes
The CDS positions of the annotated chromosome 3B protein-coding genes were used to estimate the relative abundance of TE families in the 20 kb upstream and downstream regions. The average proportion of a given TE family was calculated for each nucleotide position in
the CDS surrounding sequence by considering the orien-tation of the genes.
Detection of transposable element-captured gene and exon shuffling events
In order to detect TE-captured genes, we isolated genes flanked by two elements belonging to the same family, as a trace of a potential capture event. A total of 558 potential gene capture events were detected, 235 (42%) involving a CACTA, 104 (19%) involving agypsy, and 219 (39%) involv-ing other superfamilies. We manually checked the presence of target site duplications as evidence of gene capture.
To decipher potential exon shuffling events, we searched for the presence of chimeric genes. A similarity search using BLASTP against the B. distachyon proteome was performed for each captured gene product. Wheat proteins aligning over 70% of their length to aB. distachyonprotein were filtered out. For the others, we develop a parsing procedure to solve the overlapping regions of similar-ity between a B. distachyon protein and our query se-quence and to detect chimeric proteins, that is, proteins showing non-overlapping segments of similarity with dif-ferentB. distachyonproteins.
Data availability
Sequences and annotations of the reference pseudomole-cule and unassigned scaffolds have been deposited in the European Nucleotide Archive (ENA; project PRJEB4376) under accession numbers HG670306 and CBUC010000001 to CBUC010001450, respectively. The source code of the CLARI-TE program is available at [74].
Additional file
Additional file 1:The following additional data are available with the online version of this paper. Table S1.TE composition (in percentage of the sequence) of bread wheat chromosome 3B and of the draft genome sequences ofTriticum urartuandAegilops tauschii.
Table S2.Correlation between TE content, genetic recombination rate and gene density.Figure S1.Distribution of the average percentage of similarity shared among LTR-RT families forBrachypodium(bd), rice (os) sorghum (sb), maize (zm) and wheat (ta).Figure S2.Dendrograms of two families of LTR-RTs: RLG_famc1(A,B)and RLC_famc2(C,D).Figure S3.
Distribution of the number of different TE families found in a 10 Mb window sliding along the wheat chromosome 3B (in Mb).Figure S4.
Proportions of solo-LTRs, truncated TEs, and recombination rates in three different regions of chromosome 3B.Figure S5.Preferential location of gypsy families along the 3B chromosome.
Abbreviations
BAC:bacterial artificial chromosome; CDS: coding sequence; LINE: long interspersed nuclear element; LTR: long terminal repeat; LTR-RT: long terminal repeat retrotransposon; MITE: miniature inverted-repeat transposable element; MYA: million years ago; SINE: short interspersed nuclear element; TE: transposable element; TREP:TriticeaeREPeat sequence database.
Competing interests
Authors’contributions
JD performed programming, conducted data analyses and wrote the paper. NG undertook the nonsyntenic gene detection. LP collected and analyzed RNAseq expression data and carried out the cluster analysis. ST made the gene annotation and genome assembly. VJ participated in the TE annotation process. EP and HQ participated in the design of the study and critical revision of the manuscript. VB, SM, AA, and PW were involved in producing the sequence of chromosome 3B. CF participated in the design of the project, data interpretation, coordination of the project, and critical revision of the manuscript. FC designed the research, supervised this work, participated in data analyses and finalized the paper. All authors read and approved the final manuscript.
Acknowledgements
This project was supported by grants from the French National Research Agency (ANR-09-GENM-025 3BSEQ), a grant from France Agrimer, and a grant (project DL-BLE) from the INRA BAP division. JD is funded by a grant from the French Ministry of Research. NG is funded by a grant from the European Commission research training program Marie-Curie Actions (FP7-MC-IIF-NoncollinearGenes). LP is funded by a grant from the Region Auvergne.
Author details
1INRA UMR1095 Genetics, Diversity and Ecophysiology of Cereals, 5 chemin
de Beaulieu, 63039 Clermont-Ferrand, France.2University Blaise Pascal UMR1095 Genetics, Diversity and Ecophysiology of Cereals, 5 chemin de Beaulieu, 63039 Clermont-Ferrand, France.3INRA-URGI, Centre de Versailles, Route de Saint Cyr, 78026 Versailles, France.4CEA/DSV/IG/Genoscope, 2 rue Gaston Cremieux, 91000 Evry, France.5CNRS UMR 8030, 2 rue Gaston Crémieux, 91000 Evry, France.6Université d’Evry, P5706 Evry, France.
Received: 25 July 2014 Accepted: 17 November 2014
References
1. McClintock B:The origin and behavior of mutable loci in maize.Proc Natl Acad Sci U S A1950,36:344–355.
2. Feschotte C, Jiang N, Wessler SR:Plant transposable elements: where genetics meets genomics.Nat Rev Genet2002,3:329–341.
3. Arabidopsis GI:Analysis of the genome sequence of the flowering plant Arabidopsis thaliana.Nature2000,408:796.
4. Schnable PS, Ware D, Fulton RS, Stein JC, Wei F, Pasternak S, Liang C, Zhang J, Fulton L, Graves TA:The B73 maize genome: complexity, diversity, and dynamics.Science2009,326:1112–1115.
5. Devos KM:Grass genome organization and evolution.Curr Opin Plant Biol
2010,13:139–145.
6. Bennetzen JL, Ma J, Devos KM:Mechanisms of recent genome size variation in flowering plants.Ann Bot2005,95:127–132.
7. Tenaillon MI, Hollister JD, Gaut BS:A triptych of the evolution of plant transposable elements.Trends Plant Sci2010,15:471–478.
8. Naito K, Zhang F, Tsukiyama T, Saito H, Hancock CN, Richardson AO, Okumoto Y, Tanisaka T, Wessler SR:Unexpected consequences of a sudden and massive transposon amplification on rice gene expression.
Nature2009,461:1130–1134.
9. Li B, Choulet F, Heng Y, Hao W, Paux E, Liu Z, Yue W, Jin W, Feuillet C, Zhang X:Wheat centromeric retrotransposons: the new ones take a major role in centromeric structure.Plant J2013,73:952–965. 10. Vitte C, Bennetzen JL:Analysis of retrotransposon structural diversity
uncovers properties and propensities in angiosperm genome evolution.
Proc Natl Acad Sci U S A2006,103:17638–17643.
11. Matsumoto T, Wu J, Kanamori H, Katayose Y, Fujisawa M, Namiki N, Mizuno H, Yamamoto K, Antonio BA, Baba T:The map-based sequence of the rice genome.Nature2005,436:793–800.
12. Paterson AH, Bowers JE, Bruggmann R, Dubchak I, Grimwood J, Gundlach H, Haberer G, Hellsten U, Mitros T, Poliakov A:The Sorghum bicolor genome and the diversification of grasses.Nature2009,457:551–556.
13. Gao X, Hou Y, Ebina H, Levin HL, Voytas DF:Chromodomains direct integration of retrotransposons to heterochromatin.Genome Res2008,
18:359–369.
14. Marín I, Lloréns C:Ty3/Gypsy retrotransposons: description of new Arabidopsis thaliana elements and evolutionary perspectives derived from comparative genomic data.Mol Biol Evol2000,17:1040–1049. 15. Chatterjee AG, Leem YE, Kelly FD, Levin HL:The chromodomain of Tf1
integrase promotes binding to cDNA and mediates target site selection.
J Virol2009,83:2675–2685.
16. Devos KM, Brown JK, Bennetzen JL:Genome size reduction through illegitimate recombination counteracts genome expansion in Arabidopsis.Genome Res2002,12:1075–1079.
17. Ma J, Devos KM, Bennetzen JL:Analyses of LTR-retrotransposon structures reveal recent and rapid genomic DNA loss in rice.Genome Res2004,
14:860–869.
18. Tian Z, Rizzon C, Du J, Zhu L, Bennetzen JL, Jackson SA, Gaut BS, Ma J:Do genetic recombination and gene density shape the pattern of DNA elimination in rice long terminal repeat retrotransposons?Genome Res
2009,19:2221–2230.
19. Duret L, Marais G, Biémont C:Transposons but not retrotransposons are located preferentially in regions of high recombination rate in Caenorhabditis elegans.Genetics2000,156:1661–1669.
20. Long M, Betrán E, Thornton K, Wang W:The origin of new genes: glimpses from the young and old.Nat Rev Genet2003,4:865–875.
21. Yang L, Bennetzen JL:Distribution, diversity, evolution, and survival of Helitrons in the maize genome.Proc Natl Acad Sci U S A2009,
106:19922–19927.
22. Morgante M, Brunner S, Pea G, Fengler K, Zuccolo A, Rafalski A:Gene duplication and exon shuffling by helitron-like transposons generate intraspecies diversity in maize.Nat Genet2005,37:997–1002. 23. Hanada K, Vallejo V, Nobuta K, Slotkin RK, Lisch D, Meyers BC, Shiu S-H,
Jiang N:The functional role of pack-MULEs in rice inferred from purifying selection and expression profile.Plant Cell2009,21:25–38.
24. Jiang N, Wessler SR:Insertion preference of maize and rice miniature inverted repeat transposable elements as revealed by the analysis of nested elements.Plant Cell2001,13:2553–2564.
25. Juretic N, Bureau TE, Bruskiewich RM:Transposable element annotation of the rice genome.Bioinformatics2004,20:155–160.
26. Jiang N, Feschotte C, Zhang X, Wessler SR:Using rice to understand the origin and amplification of miniature inverted repeat transposable elements (MITEs).Curr Opin Plant Biol2004,7:115–119.
27. Lu C, Chen J, Zhang Y, Hu Q, Su W, Kuang H:Miniature inverted–repeat transposable elements (MITEs) have been accumulated through amplification bursts and play important roles in gene expression and species diversity in Oryza sativa.Mol Biol Evol2012,29:1005–1017. 28. Chen J, Hu Q, Zhang Y, Lu C, Kuang H:P-MITE: a database for plant
miniature inverted-repeat transposable elements.Nucleic Acids Res2014,
42:D1176–D1181.
29. Bennetzen JL, Coleman C, Liu R, Ma J, Ramakrishna W:Consistent over-estimation of gene number in complex plant genomes.Curr Opin Plant Biol2004,7:732–736. 30. Lerat E:Identifying repeats and transposable elements in sequenced
genomes: how to find your way through the dense forest of programs.
Heredity2009,104:520–533.
31. Choulet F, Wicker T, Rustenholz C, Paux E, Salse J, Leroy P, Schlub S, Le Paslier M-C, Magdelenat G, Gonthier C:Megabase level sequencing reveals contrasted organization and evolution patterns of the wheat gene and transposable element spaces.Plant Cell2010,22:1686–1701.
32. SanMiguel PJ, Ramakrishna W, Bennetzen JL, Busso CS, Dubcovsky J:
Transposable elements, genes and recombination in a 215-kb contig from wheat chromosome 5Am.Funct Integr Genomics2002,2:70–80. 33. Li W, Zhang P, Fellers JP, Friebe B, Gill BS:Sequence composition, organization,
and evolution of the core Triticeae genome.Plant J2004,40:500–511. 34. Sabot F, Guyot R, Wicker T, Chantret N, Laubin B, Chalhoub B, Leroy P,
Sourdille P, Bernard M:Updating of transposable element annotations from large wheat genomic sequences reveals diverse activities and gene associations.Mol Genet Genomics2005,274:119–130.
35. Paux E, Roger D, Badaeva E, Gay G, Bernard M, Sourdille P, Feuillet C:
Characterizing the composition and evolution of homoeologous genomes in hexaploid wheat through BAC‐end sequencing on chromosome 3B.Plant J2006,48:463–474.
37. TREP, the Triticeae REPeat Sequence Database.[http://wheat.pw.usda.gov/ ITMI/Repeats/]
38. Brenchley R, Spannagl M, Pfeifer M, Barker GL, D’Amore R, Allen AM, McKenzie N, Kramer M, Kerhornou A, Bolser D:Analysis of the bread wheat genome using whole-genome shotgun sequencing.Nature2012,
491:705–710.
39. Ling HQ, Zhao S, Liu D, Wang J, Sun H, Zhang C, Fan H, Li D, Dong L, Tao Y, Gao C, Wu H, Li Y, Cui Y, Guo X, Zheng S, Wang B, Yu K, Liang Q, Yang W, Lou X, Chen J, Feng M, Jian J, Zhang X, Luo G, Jiang Y, Liu J, Wang Z, Sha Y,
et al:Draft genome of the wheat A-genome progenitor Triticum urartu.
Nature2013,496:87–90.
40. Jia J, Zhao S, Kong X, Li Y, Zhao G, He W, Appels R, Pfeifer M, Tao Y, Zhang X, Jing R, Zhang C, Ma Y, Gao L, Gao C, Spannagl M, Mayer KF, Li D, Pan S, Zheng F, Hu Q, Xia X, Li J, Liang Q, Chen J, Wicker T, Gou C, Kuang H, He G, Luo Y,et al:Aegilops tauschii draft genome sequence reveals a gene repertoire for wheat adaptation.Nature2013,496:91–95.
41. International Wheat Genome Sequencing Consortium.[http://www. wheatgenome.org/]
42. Choulet F, Alberti A, Theil S, Glover N, Barbe V, Daron J, Pingault L, Sourdille P, Couloux A, Paux E, Leroy P, Mangenot S, Guilhot N, Le Gouis J, Balfourier F, Alaux M, Jamilloux V, Poulain J, Durand C, Bellec A, Gaspin C, Safar J, Dolezel J, Rogers J, Vandepoele K, Aury JM, Mayer K, Berges H, Quesneville H, Wincker P,
et al:Structural and functional partitioning of bread wheat chromosome 3B.Science2014,345:1249721.
43. IWGSC:A chromosome-based draft sequence of the hexaploid bread wheat (Triticum aestivum) genome.Science2014,345:1251788. 44. El Baidouri M, Panaud O:Comparative genomic paleontology across plant
kingdom reveals the dynamics of TE-driven genome evolution.
Genome Biol Evol2013,5:954–965.
45. Flutre T, Duprat E, Feuillet C, Quesneville H:Considering transposable element diversification in de novo annotation approaches.PLoS One
2011,6:e16526.
46. Vogel JP, Garvin DF, Mockler TC, Schmutz J, Rokhsar D, Bevan MW, Barry K, Lucas S, Harmon-Smith M, Lail K:Genome sequencing and analysis of the model grass Brachypodium distachyon.Nature2010,463:763–768. 47. Baucom RS, Estill JC, Chaparro C, Upshaw N, Jogi A, Deragon J-M, Westerman RP,
SanMiguel PJ, Bennetzen JL:Exceptional diversity, non-random distribution, and rapid evolution of retroelements in the B73 maize genome.PLoS Genet
2009,5:e1000732.
48. Rustenholz C, Choulet F, Laugier C,ŠafářJ,Šimková H, Doležel J, Magni F, Scalabrin S, Cattonaro F, Vautrin S:A 3,000-loci transcription map of chromosome 3B unravels the structural and functional features of gene islands in hexaploid wheat.Plant Physiol2011,157:1596–1608. 49. Wicker T, Guyot R, Yahiaoui N, Keller B:CACTA transposons in Triticeae. A
diverse family of high-copy repetitive elements.Plant Physiol2003,
132:52–63.
50. Liu R, Vitte C, Ma J, Mahama AA, Dhliwayo T, Lee M, Bennetzen JL:A GeneTrek analysis of the maize genome.Proc Natl Acad Sci U S A2007,
104:11844–11849.
51. Rees H, Walters M:Nuclear DNA and the evolution of wheat.Heredity1965,
20:73–82.
52. Kashkush K, Feldman M, Levy AA:Transcriptional activation of retrotransposons alters the expression of adjacent genes in wheat.
Nat Genet2002,33:102–106.
53. Parisod C, Alix K, Just J, Petit M, Sarilar V, Mhiri C, Ainouche M, Chalhoub B, Grandbastien MA:Impact of transposable elements on the organization and function of allopolyploid genomes.New Phytol2010,186:37–45. 54. Wright SI, Agrawal N, Bureau TE:Effects of recombination rate and gene
density on transposable element distributions in Arabidopsis thaliana.
Genome Res2003,13:1897–1903.
55. Yang G, Lee YH, Jiang Y, Shi X, Kertbundit S, Hall TC:A two-edged role for the transposable element Kiddo in the rice ubiquitin2 promoter.
Plant Cell2005,17:1559–1568.
56. Han Y, Qin S, Wessler SR:Comparison of class 2 transposable elements at superfamily resolution reveals conserved and distinct features in cereal grass genomes.BMC Genomics2013,14:71.
57. Kuang H, Padmanabhan C, Li F, Kamei A, Bhaskar PB, Ouyang S, Jiang J, Buell CR, Baker B:Identification of miniature inverted-repeat transposable elements (MITEs) and biogenesis of their siRNAs in the Solanaceae: new functional implications for MITEs.Genome Res
2009,19:42–56.
58. Consortium IBGS:A physical, genetic and functional sequence assembly of the barley genome.Nature2012,491:711–716.
59. Batzer MA, Deininger PL:Alu repeats and human genomic diversity.
Nat Rev Genet2002,3:370–379.
60. Hawkins JS, Kim H, Nason JD, Wing RA, Wendel JF:Differential lineage-specific amplification of transposable elements is responsible for genome size variation in Gossypium.Genome Res2006,16:1252–1261.
61. Piegu B, Guyot R, Picault N, Roulin A, Saniyal A, Kim H, Collura K, Brar DS, Jackson S, Wing RA:Doubling genome size without polyploidization: dynamics of retrotransposition-driven genomic expansions in Oryza australiensis, a wild relative of rice.Genome Res2006,16:1262–1269. 62. Vitte C, Panaud O:LTR retrotransposons and flowering plant genome
size: emergence of the increase/decrease model.Cytogenet Genome Res
2005,110:91–107.
63. Hawkins JS, Proulx SR, Rapp RA, Wendel JF:Rapid DNA loss as a counterbalance to genome expansion through retrotransposon proliferation in plants.Proc Natl Acad Sci U S A2009,106:17811–17816. 64. Zabala G, Vodkin LO:The wp mutation of Glycine max carries a
gene-fragment-rich transposon of the CACTA superfamily.Plant Cell
2005,17:2619–2632.
65. Takahashi S, Inagaki Y, Satoh H, Hoshino A, Iida S:Capture of a genomic HMG domain sequence by the En/Spm-related transposable element Tpn1 in the Japanese morning glory.Mol Gen Genet1999,
261:447–451.
66. Wicker T, Buchmann JP, Keller B:Patching gaps in plant genomes results in gene movement and erosion of colinearity.Genome Res
2010,20:1229–1237.
67. Jiang N, Bao Z, Zhang X, Eddy SR, Wessler SR:Pack-MULE transposable elements mediate gene evolution in plants.Nature2004,431:569–573. 68. Altschul SF, Madden TL, Schaffer AA, Zhang J, Zhang Z, Miller W, Lipman DJ:
Gapped BLAST and PSI-BLAST: a new generation of protein database search programs.Nucleic Acids Res1997,25:3389–3402.
69. Enright AJ, Van Dongen S, Ouzounis CA:An efficient algorithm for large-scale detection of protein families.Nucleic Acids Res2002,30:1575–1584. 70. Katoh K, Kuma K-i, Toh H, Miyata T:MAFFT version 5: improvement in
accuracy of multiple sequence alignment.Nucleic Acids Res2005,
33:511–518.
71. Waterhouse AM, Procter JB, Martin DM, Clamp M, Barton GJ:Jalview Version 2–a multiple sequence alignment editor and analysis workbench.Bioinformatics2009,25:1189–1191.
72. Smit AFA, Hubley R, Green P:RepeatMasker Open-3.0.[http://www. repeatmasker.org/]
73. Stajich JE, Block D, Boulez K, Brenner SE, Chervitz SA, Dagdigian C, Fuellen G, Gilbert JG, Korf I, Lapp H:The Bioperl toolkit: Perl modules for the life sciences.Genome Res2002,12:1611–1618.
74. Daron J:CLARI-TE.[https://github.com/jdaron/CLARI-TE]
75. Edgar RC:MUSCLE: multiple sequence alignment with high accuracy and high throughput.Nucleic Acids Res2004,32:1792–1797.
76. SanMiguel P, Gaut BS, Tikhonov A, Nakajima Y, Bennetzen JL:The paleontology of intergene retrotransposons of maize.Nat Genet1998,
20:43–45.
77. Price MN, Dehal PS, Arkin AP:FastTree 2–approximately maximum-likelihood trees for large alignments.PLoS One2010,5:e9490.
78. Rambaut A:FigTree-v1.4.2.[http://tree.bio.ed.ac.uk/software/figtree/] 79. Suzuki R, Shimodaira H:Pvclust: an R package for assessing the uncertainty
in hierarchical clustering.Bioinformatics2006,22:1540–1542.
doi:10.1186/s13059-014-0546-4
Cite this article as:Daronet al.:Organization and evolution of transposable elements along the bread wheat chromosome 3B.Genome