Research Article
Study on the AFM Force Curve Common Errors
and Their Effects on the Calculated Nanomechanical
Properties of Materials
D. Almasi,
1,2R. Sharifi,
3M. R. Abdul Kadir,
2G. Krishnamurithy,
4and T. Kamarul
51Young Researchers and Elite Club, Kermanshah Branch, Islamic Azad University, Kermanshah, Iran
2Medical Devices & Technology Group (MEDITEG), Faculty of Bioscience and Medical Engineering,
Universiti Teknologi Malaysia, 81310 Skudai, Johor, Malaysia
3Department of Endodontics, School of Dentistry, Kermanshah University of Medical Sciences, Kermanshah, Iran
4Institute of Translational Medicine, University of Liverpool, Sherrington Building, Liverpool L69 3GE, UK
5Department of Orthopaedic Surgery (NOCERAL), Faculty of Medicine, University of Malaya, 50603 Kuala Lumpur, Malaysia
Correspondence should be addressed to R. Sharifi; [email protected]
Received 12 August 2016; Accepted 29 September 2016
Academic Editor: Sheng-Rui Jian
Copyright © 2016 D. Almasi et al. This is an open access article distributed under the Creative Commons Attribution License, which permits unrestricted use, distribution, and reproduction in any medium, provided the original work is properly cited.
The atomic force microscope (AFM) force curve has been widely used for determining the mechanical properties of materials due to its high resolution, whereby very low (piconewton) forces and distances as small as nanometers can be measured. However, sometimes the resultant force curve obtained from AFM is slightly different from those obtained from a more typical nanoindentation force curve due to the AFM piezo’s hysteresis. In this study the nanomechanical properties of either a sulfonated polyether ether ketone (SPEEK) treated layer or bare polyether ether ketone (PEEK) were evaluated via AFM nanoindentation and a nanomechanical test system to probe the possible error of the calculated nanomechanical properties due to the AFM piezo’s hysteresis. The results showed that AFM piezo’s hysteresis caused the error in the calculated nanomechanical properties of the materials.
1. Introduction
Due to the increased applications of thin film polymeric materials and polymeric coating layers in different fields of research, probing the nanomechanical properties of poly-meric materials has become essential to scientists. Based on Buckle’s one-tenth rule for probing the mechanical properties of a coating or thin layer of a particular material, the maximum indentation depth must be less than one-tenth of the thickness of that layer to prevent an effect of the substrate in the resultant force curve [1]. High resolution equipment for measuring indentation force curves is therefore required. Atomic force microscopy (AFM) and nanomechanical test system have been used widely to probe the nanomechanical properties of the surface of materials.
The atomic force microscope was invented by Bin-ning and Smith [2]. Burnham and Colton [3] used AFM in
Contact area
F
𝛿f
𝛿c 𝛿
(a)
Approach Retract
𝛿f 𝛿max
Loa
d
(F)
Displacement (𝛿)
S
(b)
Figure 1: (a) Surface profile during loading with an indenter; (b) schematic of indentation force curve [28].
available, such as those by Johnson et al. (JKR) [24, 25], Derjaguin et al. (DMT) [26], Hertz [27], and Oliver and Pharr [28]. Each of the formulations has its unique strengths and limitations.
This comparative study was conducted to evaluate the effect of the AFM piezo hysteresis on the calculated mechan-ical properties of polymeric materials, compared with nanomechanical test system. For this reason Young’s modulus of a treated layer of PEEK in sulfuric acid (i.e., SPEEK) was evaluated, as well as that of bare PEEK using AFM and nanomechanical test system. These materials were chosen as PEEK is relatively stiff and SPEEK is relatively soft in compar-ison with the cantilever’s spring constant. Two formulations to calculate material properties from the AFM force curve— Hertz and Oliver-Pharr—were then used to analyze the two materials in terms of their suitability.
2. Materials and Methods
2.1. Sample Preparation. Twelve cylindrical samples of
implant grade PEEK Optima (Invibio) with a height of
0.8 cm and a diameter of 1.9 cm were used in the experiment. These samples were ground with 400-grit silicon carbide paper to reduce their surface roughness. After grinding, the samples were cleaned ultrasonically with acetone for 10 minutes [29]. For preparation of SPEEK samples, the ground PEEK disks were immersed in 95–97% sulfuric acid for 5 min-utes, followed by washing with deionized water several times until the pH of the water reached the neutral value of 7 [30].
2.2. Numerical Model to Calculate Young’s Modulus
2.2.1. The Oliver-Pharr Model. The Oliver-Pharr model can
be used to calculate Young’s modulus of materials from an indentation force curve. This technique relies on the fact that the displacements recovered during unloading are largely
elastic. In this case Young’s modulus can be determined by elastic punch theory from the indentation force curve [28, 31]. Figure 1(a) shows the schematic of a surface profile during indentation, and Figure 1(b) shows the schematic of a force curve of a typical nanoindentation. The offset in Figure 1(b)
is the residual plastic indentation depth (𝛿𝑓).
In nanoindentation studies of polymeric materials the elastic properties of the indenter can be ignored [32] due to the large differences in the elastic modulus between the tip and the sample. The following Oliver-Pharr equations [31] were based on this assumption. For a pyramid indenter with
an angle𝛼, the projected contact area (𝐴𝑐) can be calculated
from the contact depth (𝛿𝑐) via the following:
𝐴𝑐= 4𝛿𝑐2tan𝛼. (1)
And the contact depth (𝛿𝑐) can be obtained from (2) at
peak load, where stiffness (𝑆) can be calculated by measuring
the slope of the unloading part of the force curve at maximum
indentation depth (𝛿max).
𝛿𝑐= 𝛿max− 𝜀𝐹max
𝑆 , (2)
where𝐹maxis the load at the depth of maximum indentation.
The geometric constant of𝜀is 0.72 for pyramidal and conical
indenters [28]. Finally, to calculate Young’s modulus (𝐸), the
following can be used:
𝐸 = 𝑆√𝜋
2√𝐴𝑐. (3)
After unloading, the elastic deformation is completely recovered and only plastic indentation remains.
2.2.2. The Hertz Contact Model. The Hertz model can also
[image:2.600.109.492.79.280.2](𝜇m)
(𝜇m)
4 4
2 2
0 0
1.50
E3
(nm)
(a)
(𝜇m)
(𝜇m)
4 4
2 2
0 0
800
(nm)
[image:3.600.78.524.74.202.2](b)
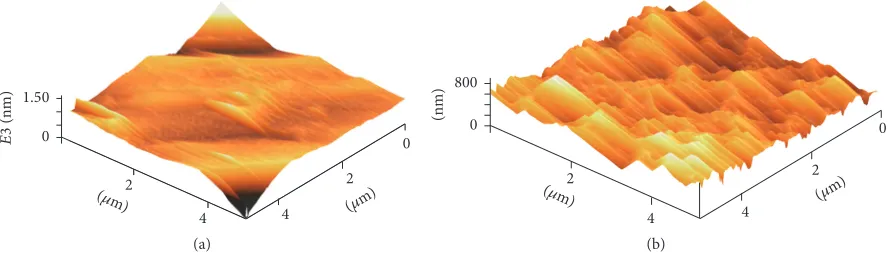
Figure 2: AFM 3D height image of (a) SPEEK and (b) PEEK.
its indentation force curve. Based on this model the sample is assumed to be linear in its elasticity and an isotropic solid, and the indenter is considered as a rigid material [27, 33]. Most studies have used the approach part of the force curve to calculate Young’s modulus [5, 6, 33]; however, the average value of the approach-retract portion has also been considered [11]. For the four-sided pyramid indenter used in AFM, the Hertz model for calculating Young’s modulus utilized the following [34]:
𝐹 = (1 − 𝜐𝐸 2)tan𝛼
√2 𝛿2, (4)
where𝛼is the face angle of the cantilever and𝜐is Poisson’s
ratio of the sample. For the Berkovich three-sided indenter used in the NTS, the Hertz model for calculating Young’s modulus utilized the following [33, 35]:
𝐹 = 𝐸
(1 − 𝜐2)
2 ∗tan𝛼
𝜋 𝛿2. (5)
In this study Poisson’s ratio of the SPEEK layer was assumed to be zero due to the high porosity of this layer, and Poisson’s ratio of PEEK was assumed to be 0.4 [36].
2.3. AFM Nanoindentation. A Seiko SPA 300 atomic force
microscope with a SPI 3700 probe station was used to evaluate the mechanical properties of the samples. An Olympus microcantilever (OMCL-TR400PSA-3) with a silicon nitride hollow pyramid indenter with a 70-degree indenter angle was
used for the test. The cantilever’s length was 100𝜇m with a
spring constant of 0.08 N/m. The AFM was run in force curve
mode and a scan size of 20𝜇m ×20𝜇m. The force curve
graph obtained from the test was used to calculate the elastic modulus. Three AFM nanoindentation tests were made per sample.
2.4. Nanomechanical Test System. The Hysitron TI 750D Ubi
nanomechanical test system with the Berkovich indenter tip was used for the nanoindentation test. Three nanoindentation tests were made per sample. The maximum applied load was chosen based on a preliminary experiment considering the one-tenth indentation rule [1]. During the preliminary
experiment, the applied load was varied from 200𝜇N to
1000𝜇N, and the load-displacement graphs were analyzed to
extract the maximum penetration depth, which must be less than one-tenth of the coating thickness. The results showed
that 200𝜇N was suitable. The chosen loading rate was 5𝜇N/s
and the holding time was 300 s.
3. Results
3.1. AFM and Nanomechanical Test System Results. Figure 2
shows the AFM 3D height image of the surface of PEEK and SPEEK. As can be seen the surface roughness of the PEEK increased after sulphonation due to the diffusion of the sulfuric acid [37]. Figure 3 shows the force-piezo
displacement (𝑍𝑝) for SPEEK and PEEK obtained from the
AFM. Figure 3(a) shows the force-piezo displacement of SPEEK to show the effect of snap-in and snap-out, which occurs for hydrophilic materials. Figures 3(a) and 3(b) show the method of extracting the indentation depth from the force curve for SPEEK and PEEK. Figure 4 shows the force curves of the SPEEK and PEEK via the NTS.
3.2. Analysis of the AFM Results. The SPEEK AFM force
curve showed the effect of snap-in and snap-out (Figure 3(a)). This phenomenon was not apparent for the PEEK AFM force curve (Figure 3(b)) and the NTS force curve results (Figure 4).
Another difference between AFM and NTS force curves which could happen is the reverse position of the approach and retract curve in the AFM’s force curve. The retract portion of the NTS force curve is located on the right side of the approach portion (Figure 4). However, the force curve graph for the AFM shows the reverse (Figure 3). As a
result, the residual indentation depth (𝛿𝑓) and contact area
between the sample and indenter (𝐴𝑐) at maximum load
−10 0 10
(nN)
0 200 400
−200
(nm) Retract
Approach
B C
K
A 𝛿
Snap-out
Snap-in
(a)
0 100 200 300 400
−100
(nm)
0 5 10 15
(nN)
Retract
Cantilever displacement line
Approach
K
[image:4.600.93.509.72.282.2](b)
Figure 3: Force-piezo displacement for (a) SPEEK and (b) PEEK via AFM.
0 50 100 150 200 250
0 500
1000 1500
Indentation l
o
ad
(mN)
Penetration depth (nm)
(a)
0 50 100 150 200 250
0 100
200 300
400
Indentation l
o
ad
(mN)
Penetration depth (nm)
(b)
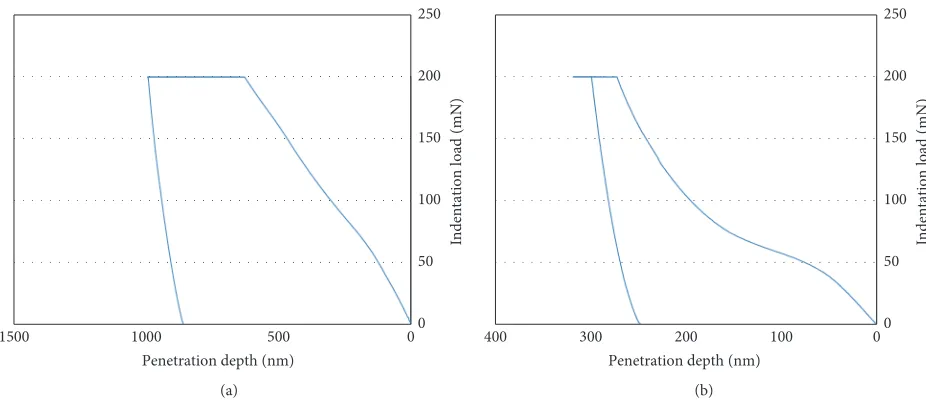
Figure 4: Force-indentation depth of (a) SPEEK and (b) PEEK via the NTS.
in the calculated Young’s modulus and hardness. The reverse position of the approach-retract parts of the force curve is one of the biggest problems regarding the hysteresis of the AFM’s piezo scanner and makes it difficult and sometimes impossible to analyze the AFM’s force curve graph.
Another consideration that must be taken into account when analyzing AFM force curve is that the force versus piezo
displacement (𝑍𝑝) must be converted into force-indentation
depth (𝛿) graph [39]. Figure 3 schematically shows the
method of extracting the penetration (𝛿) from𝐹-𝑍𝑝graph.
For calculating the indentation depth, a line with a slope
value of𝐾—the cantilever displacement line—must be drawn
from the first approach point of the force curve. This line shows that the cantilever displaced with an assumption of fixed spring constant factor (Figure 3(b)). The indentation
depth can be obtained from the piezo displacement via the following [16, 40]:
𝛿 = 𝑍𝑝− 𝐹
𝐾. (6)
As can be seen in Figure 3(a), the indentation (𝛿) for
[image:4.600.67.530.325.525.2]Sample 𝛿𝑐(nm) 𝑆(𝜇N/nm) 𝐴𝑐(nm2) 𝛿max(nm) 𝛿𝑓(nm) 𝐸(MPa) SPEEK 926±54 2.16 ± 0.24 21649253±237384 995±73 838±62 411±16 PEEK 276±36 6.51±0.18 2143810±295375 318±38 241±46 3937±149
0 50 100 150 200
Piezo displacement (nm) Calculated indentation depth (nm) Young’s modulus (Mpa)
0 50 100 150
Y
o
un
g’
s mo
d
u
lu
s (MP
a)
−40
−20 0 20 40 60
C
alc
ula
ted inden
ta
tio
n
dep
th
[image:5.600.51.551.89.130.2](nm)
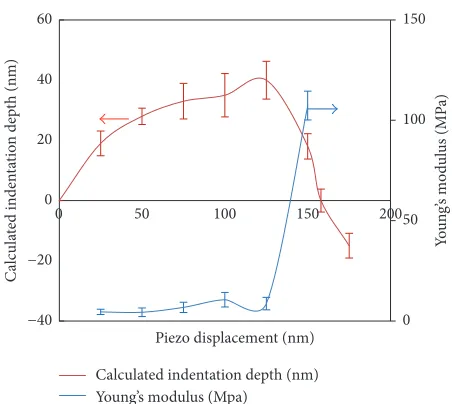
Figure 5: Indentation depth versus piezo displacement of SPEEK using the approach portion of the force curve via AFM and calculated Young’s modulus versus piezo displacement of SPEEK using the Hertz model.
indentation depth versus piezo displacement for SPEEK. For the first part of the indenter approach, the calculated indentation increased with increasing force, but as the load increases further, the calculated indentation decreased and eventually ended with a negative value, which is impossible. This happened due to the increase in error as the load increases. Nevertheless, the first part of the approach of the force curve of SPEEK (Figure 3(a)) can still be used for calculation using the Hertz model.
In Figure 3(a) the cantilever displacement line (A-B) overlaps the piezo displacement line, thus resulting in zero depth of indentation for the retract part of the AFM force curve of SPEEK. However, for region B-C there were minute differences resulting in a very small amount of indentation depth. Figure 6 shows the force-calculated indentation depth for the retract portion of the SPEEK’s force curve. Since the
tangent at maximum force does not cross the𝑥-axis, that is,
the indentation depth, the contact indentation depth cannot be obtained and therefore the elastic modulus cannot be calculated using this curve.
The calculated Young’s modulus of the SPEEK layer by AFM nanoindentation via the Hertz model is shown in Fig-ure 5. As can be seen, the calculated Young’s modulus between
25 nm and 75 nm piezo displacement is 5.2±1.6 MPa, but
with increasing piezo displacement the value increased to 107.3 MPa at 150 nm. The elastic properties of SPEEK cannot
5 10 15 20 25 30 35 0
Calculated indentation depth (nm) 0
2 4 6 8 10 12 14 16 18
F
o
rc
[image:5.600.57.283.158.360.2]e (nN)
Figure 6: Force versus indentation depth of SPEEK from the retract portion of the force curve via AFM.
be calculated using the Oliver-Pharr model, as the contact
area (𝐴𝑐) cannot be extracted from the force-indentation
graph.
Figure 3(b) shows the force curve graph for PEEK. Compared to SPEEK, snap-in was not visible. The cantilever displacement line for the approach and retract portions over-lapped with the piezo displacement line for the first few piezo displacement, resulting in zero indentation depth. However, with increasing of the value of the piezo displacement the force curve is located at the right side of the cantilever displacement line, which means a negative value for the indentation depth. The AFM indentation result for PEEK is different from SPEEK, showing that cantilever with low spring constant is not suitable for use in calculating the material properties of hard materials.
3.3. Analysis of the Nanomechanical Test System Results.
Table 1 shows the calculated elasticity modulus of the SPEEK and PEEK based on the NTS force curve (Figure 4) via the Oliver-Pharr model.
Figure 7 shows the calculated modulus of elasticity of SPEEK and PEEK based on the Hertz model. As can be seen, the calculated elastic modulus was different for different indentation loads. Young’s modulus for SPEEK
with indentation loads between 150 and 200𝜇N was 305±
46 MPa, which was close to the calculated elastic modulus via the Oliver-Pharr method (411 MPa). The calculated elastic modulus of PEEK with indentation loads between 150 and
200𝜇N was 1500 ± 40 MPa, which was less than half of
[image:5.600.318.542.160.295.2]12083
1702 557 352 259 5970 1630 1560 1640
PEEK SPEEK
50 100 150 200 250 0
Indentation load (𝜇N)
0 2000 4000 6000 8000 10000 12000 14000 16000
E
(MP
a)
−10000
0 10000 20000 30000 40000 50000
E
(MP
[image:6.600.181.421.72.237.2]a)
Figure 7: Calculated Young’s modulus versus piezo displacement of (a) SPEEK and (b) PEEK using the Hertz model via the NTS.
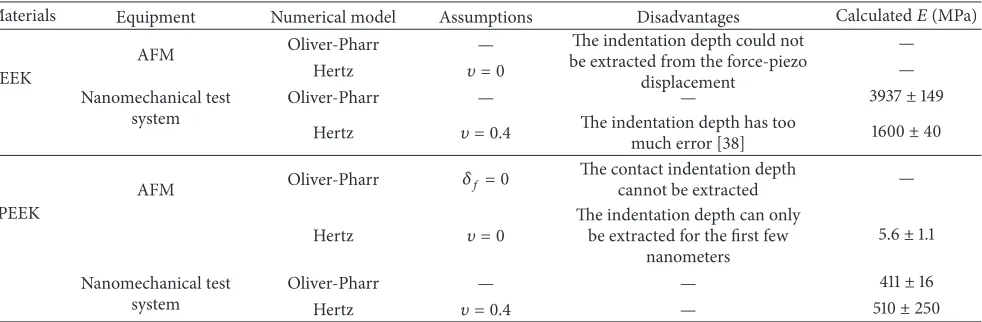
Table 2: Summary of the calculated elastic modulus and the disadvantages of each type of equipment and numerical model used in this study.
Materials Equipment Numerical model Assumptions Disadvantages Calculated𝐸(MPa)
PEEK
AFM Oliver-Pharr — be extracted from the force-piezoThe indentation depth could not displacement
—
Hertz 𝜐 = 0 —
Nanomechanical test system
Oliver-Pharr — — 3937±149
Hertz 𝜐 = 0.4 The indentation depth has too
much error [38] 1600±40
SPEEK
AFM Oliver-Pharr 𝛿𝑓= 0
The contact indentation depth
cannot be extracted —
Hertz 𝜐 = 0
The indentation depth can only be extracted for the first few
nanometers
5.6±1.1
Nanomechanical test system
Oliver-Pharr — — 411±16
Hertz 𝜐 = 0.4 — 510±250
4. Discussion
We have compared the outcome of the AFM force curve and nanomechanical test force curve for two types of polymeric materials—PEEK and SPEEK. The AFM force curve for SPEEK shows snap-in and snap-out due to the hydrophilicity of the material. However, this does not occur in PEEK which is hydrophobic [6, 39, 41]. The observed differences between the two materials were not apparent if the NTS was used, as its indenter was not linked to a cantilever similar to that found in the AFM. Snap-in is a condition where the cantilever suddenly bends or is attracted to the sample due to the van der Waals attraction [42]. After contact, the indenter will bend upwards as it is continually pushed by the sample in the upwards direction, thus increasing the contact force on the sample. During retraction, the indenter is initially prevented from separation due to adhesive forces which includes the van der Waals forces, the electrostatic force, capillary force, and the chemical bonds [42, 43]. At a certain distance of retraction, the indenter suddenly snaps out as the adhesive forces can no longer sustain the separation load.
Another error in the AFM force curves which affects the prediction of mechanical properties is the reverse position of
the approach and retract curves. This is a common error due to the hysteresis of the AFM’s piezo scanner which has been reported by several researchers [13–18]. This error makes it
impossible to extract the residual indentation depth(𝛿𝑓)and
contact area between the sample and indenter. Even with the reverse portion of the approach and retract part, the elastic modulus can still be extracted from the force curve using the Hertz model [27, 33]. Also the Oliver-Pharr model can be used for calculating the elastic modulus with an assumption
of zero residual indentation depth(𝛿𝑓).
In this particular comparative study, we found that the prediction of elastic modulus from the AFM was less accurate than the NTS due to the cantilever effect and piezo hysteresis from the AFM. For the NTS, the Oliver-Pharr model gave a more accurate prediction of the elastic modulus compared to the Hertz model [38].
5. Conclusion
[image:6.600.58.549.293.454.2]Young’s modulus of PEEK and SPEEK. We observed the fol-lowing difficulties when analyzing mechanical properties via the AFM’s force curve which are common in terms of using AFM for nanoindentation purpose. Firstly the force curve graph of PEEK could not be extracted from the force-piezo displacement due to the relatively high stiffness of PEEK compared to the cantilever’s spring constant. Therefore using cantilever with higher cantilever spring constant is preferred for indentation purpose. Secondly the approach and retract portion of the AFM’s force curve was reversed in comparison with the NTS force curve graph. The reversed curve was due to hysteresis of the piezo of the AFM equipment making it
impossible to extract𝛿𝑓 from the AFM force curve graph.
In contrast, the NTS with the Oliver-Pharr model predicted Young’s modulus of both PEEK and SPEEK accurately.
Competing Interests
The authors declare that there are no competing interests regarding the publication of this paper.
References
[1] I. Manika and J. Maniks, “Effect of substrate hardness and film structure on indentation depth criteria for film hardness testing,”Journal of Physics D: Applied Physics, vol. 41, no. 7, Article ID 074010, 2008.
[2] G. Binnig and D. P. E. Smith, “Single-tube three-dimensional scanner for scanning tunneling microscopy,”Review of Scientific
Instruments, vol. 57, no. 8, pp. 1688–1689, 1986.
[3] N. A. Burnham and R. J. Colton, “Measuring the nanomechan-ical properties and surface forces of materials using an atomic force microscope,”Journal of Vacuum Science & Technology A, vol. 7, no. 4, pp. 2906–2913, 1989.
[4] M. Plodinec, M. Loparic, R. Suetterlin, H. Herrmann, U. Aebi, and C.-A. Schoenenberger, “The nanomechanical properties of rat fibroblasts are modulated by interfering with the vimentin intermediate filament system,”Journal of Structural Biology, vol. 174, no. 3, pp. 476–484, 2011.
[5] A. Zdunek and A. Kurenda, “Determination of the elastic prop-erties of tomato fruit cells with an atomic force microscope,”
Sensors, vol. 13, no. 9, pp. 12175–12191, 2013.
[6] Y. Zhu, Z. Dong, U. C. Wejinya, S. Jin, and K. Ye, “Determination of mechanical properties of soft tissue scaffolds by atomic force microscopy nanoindentation,”Journal of Biomechanics, vol. 44, no. 13, pp. 2356–2361, 2011.
[7] E. K. Dimitriadis, F. Horkay, J. Maresca, B. Kachar, and R. S. Chadwick, “Determination of elastic moduli of thin layers of soft material using the atomic force microscope,”Biophysical
Journal, vol. 82, no. 5, pp. 2798–2810, 2002.
[8] C. D. Markert, X. Guo, A. Skardal et al., “Characterizing the micro-scale elastic modulus of hydrogels for use in regenerative medicine,” Journal of the Mechanical Behavior of Biomedical
Materials, vol. 27, pp. 115–127, 2013.
[9] W. Liang, Z. Ning, Z. Dang, and L. Wu, “Plastic deformation behaviors of Ni- and Zr-based bulk metallic glasses subjected to nanoindentation,”Materials Characterization, vol. 86, pp. 290– 295, 2013.
chanical characterization of polymers by AFM nanoindenta-tions: criticalr approach to the elastic characterization,”
Macro-molecules, vol. 39, no. 13, pp. 4547–4556, 2006.
[11] J. Domke and M. Radmacher, “Measuring the elastic properties of thin polymer films with the atomic force microscope,”
Langmuir, vol. 14, no. 12, pp. 3320–3325, 1998.
[12] M. Sebastiani, A. Cusm`a, E. Bemporad, and F. Carassiti, “Elastic anisotropy of coatings by AFM analysis of microindentations,”
Surface Engineering, vol. 30, no. 1, pp. 41–47, 2014.
[13] J. Z. Ai, X. P. Guo, and Z. Y. Chen, “The adsorption behavior and corrosion inhibition mechanism of anionic inhibitor on galvanic electrode in 1% NaCl solution,”Applied Surface Science, vol. 253, no. 2, pp. 683–688, 2006.
[14] Y. Chen, G. Zeng, S. S. Chen, Q. Feng, and Z. W. Chen, “AFM force measurements of the gp120-sCD4 and gp120 or CD4 antigen-antibody interactions,” Biochemical and Biophysical
Research Communications, vol. 407, no. 2, pp. 301–306, 2011.
[15] V. M. Masterson and X. Cao, “Evaluating particle hardness of pharmaceutical solids using AFM nanoindentation,”
Interna-tional Journal of Pharmaceutics, vol. 362, no. 1-2, pp. 163–171,
2008.
[16] Influence of Soft Segment Content and Chain Length on the
Physical Properties of Poly(ether ester) Elastomers and
Fabrica-tion of Honeycomb Pattern and Electrospun Fiber, Reactive and
Functional Polymers, 2013.
[17] JPK Instruments AG, “A practical guide to AFM force spec-troscopy and data analysis,” Technical Note, JPK Instruments AG, Berlin, Germany, 2014.
[18] Q. Ouyang, K. Ishida, and K. Okada, “Investigation of micro-adhesion by atomic force microscopy,”Applied Surface Science, vol. 169-170, pp. 644–648, 2001.
[19] C. A. Schuh, “Nanoindentation studies of materials,”Materials
Today, vol. 9, no. 5, pp. 32–40, 2006.
[20] O. S¸ahin, O. Uzun, U. K¨olemen, and N. Uc¸ar, “Mechanical characterization for𝛽-Sn single crystals using nanoindentation tests,”Materials Characterization, vol. 59, no. 4, pp. 427–434, 2008.
[21] D. J. Shuman, A. L. M. Costa, and M. S. Andrade, “Calculating the elastic modulus from nanoindentation and microindenta-tion reload curves,”Materials Characterization, vol. 58, no. 4, pp. 380–389, 2007.
[22] A. Dey, A. K. Mukhopadhyay, S. Gangadharan, M. K. Sinha, D. Basu, and N. R. Bandyopadhyay, “Nanoindentation study of microplasma sprayed hydroxyapatite coating,” Ceramics
International, vol. 35, no. 6, pp. 2295–2304, 2009.
[23] F. K. Mante, G. R. Baran, and B. Lucas, “Nanoindentation studies of titanium single crystals,”Biomaterials, vol. 20, no. 11, pp. 1051–1055, 1999.
[24] K. L. Johnson, K. Kendall, and A. D. Roberts, “Surface energy and the contact of elastic solids,”Proceedings of the Royal Society
A: Mathematical, Physical and Engineering Sciences, vol. 324, no.
1558, pp. 301–313, 1971.
[25] D. Maugis and M. Barquins, “Adhesive contact of sectionally smooth-ended punches on elastic half-spaces: theory and experiment,”Journal of Physics D: Applied Physics, vol. 16, no. 10, pp. 1843–1874, 1983.
[26] B. V. Derjaguin, V. M. Muller, and Y. P. Toporov, “Effect of contact deformations on the adhesion of particles,”Journal of
[28] W. C. Oliver and G. M. Pharr, “Improved technique for deter-mining hardness and elastic modulus using load and displace-ment sensing indentation experidisplace-ments,” Journal of Materials
Research, vol. 7, no. 6, pp. 1564–1580, 1992.
[29] A. Rabiei and S. Sandukas, “Processing and evaluation of bioactive coatings on polymeric implants,”Journal of Biomedical
Materials Research Part A, vol. 101, no. 9, pp. 2621–2629, 2013.
[30] K. Janaki, S. Elamathi, and D. Sangeetha, “Development and characterization of polymer ceramic composites for orthopedic applications,”Trends in Biomaterials & Artificial Organs, vol. 22, no. 3, pp. 169–178, 2008.
[31] G. M. Pharr, W. C. Oliver, and F. R. Brotzen, “On the gener-ality of the relationship among contact stiffness, contact area, and elastic modulus during indentation,”Journal of Materials
Research, vol. 7, no. 3, pp. 613–617, 1992.
[32] C. A. Clifford and M. P. Seah, “Quantification issues in the identification of nanoscale regions of homopolymers using modulus measurement via AFM nanoindentation,” Applied
Surface Science, vol. 252, no. 5, pp. 1915–1933, 2005.
[33] O. Olubi, D. Gadi, B. Sannigrahi, M. Williams, B. Baird, and I. Khan, “Fabrication of electroactive composite nanofibers of functionalized polymer and CNT capable of specifically binding with the IgE (Immunoglobulin E) antibody,”Surface
and Interface Analysis, vol. 46, no. 4, pp. 237–242, 2014.
[34] N. Gavara and R. S. Chadwick, “Determination of the elastic moduli of thin samples and adherent cells using conical atomic force microscope tips,”Nature Nanotechnology, vol. 7, no. 11, pp. 733–736, 2012.
[35] A. C. Fischer-Cripps, “Review of analysis methods for sub-micron indentation testing,”Vacuum, vol. 58, no. 4, pp. 569–585, 2000.
[36] VictrexPEEK 450G General Purpose, 2014, http://www.mat-web.com/.
[37] D. Almasi, S. Izman, M. Assadian, M. Ghanbari, and M. R. Abdul Kadir, “Crystalline ha coating on peek via chemical deposition,”Applied Surface Science, vol. 314, pp. 1034–1040, 2014.
[38] Introducing ortho PEEK, 2014.
[39] H.-J. Butt, B. Cappella, and M. Kappl, “Force measurements with the atomic force microscope: technique, interpretation and applications,”Surface Science Reports, vol. 59, no. 1–6, pp. 1–152, 2005.
[40] B. Cappella and G. Dietler,Force Distance Curves by Atomic
Force Microscopy, North-Holland, Amsterdam, The
Nether-lands, 1999.
[41] Y. Kaibara, K. Sugata, M. Tachiki, H. Umezawa, and H. Kawarada, “Control wettability of the hydrogen-terminated diamond surface and the oxidized diamond surface using an atomic force microscope,”Diamond and Related Materials, vol. 12, no. 3–7, pp. 560–564, 2003.
[42] S. Maghsoudy-Louyeh and B. R. Tittmann, “Assessment of hydrous affinity of selected material,”Colloids and Surfaces A:
Physicochemical and Engineering Aspects, vol. 331, no. 3, pp. 268–
274, 2008.
International Journal of
Aerospace
Engineering
Hindawi Publishing Corporation
http://www.hindawi.com Volume 2014
Robotics
Journal ofHindawi Publishing Corporation
http://www.hindawi.com Volume 2014
Hindawi Publishing Corporation
http://www.hindawi.com Volume 2014 Active and Passive Electronic Components
Control Science and Engineering Journal of
Hindawi Publishing Corporation
http://www.hindawi.com Volume 2014 Hindawi Publishing Corporation
http://www.hindawi.com Volume 2014
Hindawi Publishing Corporation http://www.hindawi.com
Journal of
Engineering
Volume 2014Submit your manuscripts at
http://www.hindawi.com
VLSI Design
Hindawi Publishing Corporation
http://www.hindawi.com Volume 2014
Hindawi Publishing Corporation
http://www.hindawi.com Volume 2014
Shock and Vibration
Hindawi Publishing Corporation
http://www.hindawi.com Volume 2014
Civil Engineering
Advances inAcoustics and VibrationAdvances in
Hindawi Publishing Corporation
http://www.hindawi.com Volume 2014
Hindawi Publishing Corporation
http://www.hindawi.com Volume 2014 Electrical and Computer Engineering
Journal of
Advances in OptoElectronics
Hindawi Publishing Corporation
http://www.hindawi.com Volume 2014
The Scientific
World Journal
Hindawi Publishing Corporation
http://www.hindawi.com Volume 2014
Sensors
Journal of Hindawi Publishing Corporationhttp://www.hindawi.com Volume 2014
Modelling & Simulation in Engineering Hindawi Publishing Corporation
http://www.hindawi.com Volume 2014
Hindawi Publishing Corporation
http://www.hindawi.com Volume 2014
Chemical Engineering
International Journal of Antennas and
Propagation
International Journal of
Hindawi Publishing Corporation
http://www.hindawi.com Volume 2014
Hindawi Publishing Corporation
http://www.hindawi.com Volume 2014 Navigation and Observation
International Journal of
Hindawi Publishing Corporation
http://www.hindawi.com Volume 2014
![Figure 1: (a) Surface profile during loading with an indenter; (b) schematic of indentation force curve [28].](https://thumb-us.123doks.com/thumbv2/123dok_us/8602585.865154/2.600.109.492.79.280/figure-surface-profile-loading-indenter-schematic-indentation-force.webp)