© 2017, IRJET | Impact Factor value: 5.181 | ISO 9001:2008 Certified Journal
| Page 1539
STUDY OF VERTICAL IRREGULARITY OF TALL RC STRUCTURE UNDER
LATERAL LOAD
RAHUL
1, SHIVANAND C G
21
M Tech, Department of Civil Engineering, The Oxford College of Engineering & Technology, Bengaluru, Karnataka
2Assistant Professor, Department of Civil Engineering, The Oxford College of Engineering & Technology, Bengaluru,
Karnataka, India
---***---Abstract -To study the behaviour of the building when thestructure is subjected to the lateral loads (earthquake load and the wind load). For the urbanization and for the aesthetic purpose many irregular structures have been designed. As we all know that for good behaviour of the structure it is essential that the structure should be regular. Understanding the behaviour of the Setback building and comparing them with the building without setback building (Regular building) under the lateral load, Similarly for the Mass irregularity. Modelling and analysis of the models is been carried out using the Etab’s 2013 software. The present study is limited for analysis of RC structure for lateral loads (EL & WL). The behaviour of the G+30 storey Regular building, Setback building and Mass irregularity building was studied. These building are analysed using Response Spectrum Method. The effect of the setback irregularity and mass irregularity is been studied by considering the parameter such as Storey displacement, storey drift, storey stiffness, Base shear and Time period and they are compared with the regular building.
Key Words: Mass Irregularity, Setback, Storey
displacement, base shear, Time period & Response spectrum Analysis
1.INTRODUCTION
Earthquake is the most devastating and destructive of all the natural calamities. Earthquake is distinctive shaking of the earth surface which results in damage of the structures and causes several hundreds of causalities or loss of life. The earthquake is caused due to the energy released at the movement of faulty rocks. There will be continuous movement of the rock. The earthquake occurred in past days proves that effect on the building Structures, loss of human lives, damage on the ancient structures, flyovers bridges etc. this will directly affect the growth of the country. Many researches are carried out to design an earthquake resistant structure, but still it is not been possible to design the earthquake resistant structure without causing damage. In order to overcome this problem we need to know the seismic performance of the structure or building with various aspects, which will help us to design the structure which will resist the frequent
minor earthquake and gives sufficient caution whenever it is exposed to major earthquakes. Hence in present study there an effort made to study the behaviour of vertical irregular RC structure with mass and set back irregularity.
1.1 Scope of Study
The seismic performance of the RC structures mainly depends on the shape of the building and the structural system of the building. While symmetrical buildings effect in an equally uniform distribution of seismic forces all over its components. Unsymmetrical buildings result in tremendous indeterminate distribution of forces making the analysis and prediction becomes complicated. A desire to create an aesthetic and functionally efficient structure drives architects to perceive wonderful as well as imaginative structures. Earthquake resistant engineering emphasis the inconvenience of using irregular plans, recommending as an alternative the use of simple shapes. The effects that cause seismic action in irregular structures were observed in many recent earthquakes.
Furthermore to design and analyse an irregular building a considerably high level of engineering and designer effort are required, whereas a poor designer can design and analyse a simple architectural features. In other words, damages in those with irregular features are more than those in regular one. Therefore, irregular structures need a more cautious structural analysis to reach an appropriate behavior during a devastating earthquake.
1.2 OBJECTIVE OF STUDY
In this present study, The study of vertical irregularity and Mass irregularity of tall RC structure under lateral loads is carried out using Response Spectrum Analysis. Modelling and Analysis is done using Etabs 2013.
2. DISCRIPTION OF MODEL
© 2017, IRJET | Impact Factor value: 5.181 | ISO 9001:2008 Certified Journal
| Page 1540
mass irregularity and the setback. The stormy height isuniform throughout for all the building models considered for analysis. The software used for analysis of the frame models is ETABS 2013.
Modeling
Fig-1 Regular Plan Fig-2 Setback Plan
Fig-3 Model M1VZ5 Fig-4 Model M2VZ5
Fig-5 Model M3VZ5 Fig-6 Model M3VZ5
The plan and elevations of models considered are as follows
MODEL RMZ5 - Building in rectangular shape with regular configuration for Zone 5.
MODEL RMZ2 - Building in rectangular shape with regular configuration for Zone 2.
MODEL M1VZ5 - Building with setback in 10th to 20th and
20th to 30th floors at 5m at regular 10 floors interval
(ZONE 5).
MODEL M2VZ5 - Building with setback from 20th floor
(ZONE 5).
MODEL M3VZ5 - Building with setback from 10th floor
(ZONE 5).
MODEL M4VZ5 - Building with setback from 5th floor
(ZONE 5).
MODEL MMZ5 - Building with mass irregularity at 10th,
20th and 30th floor for (Zone 5).
MODEL MMZ2 - Building with mass irregularity at 10th,
20th and 30th floor for (Zone 2).
The above mentioned models are considered for zone 5 and similarly same models are considered for zone 2 and they are named as RMZ2, model M1VZ2, model M2VZ2. Model M3VZ2 and model M4VZ2
Table-1 PARAMETERS CONSIDERED FOR ANALYSIS
Particulars Quantity
Type of the structure SMRF
Number of stories 30
Seismic zone 5 & 2
Floor height 3m
Grade of concrete M40 & M25
Grade of steel Fe550,
Fe415
Type of the soil Soft Soil
Importance factor 1
Response reduction
factor: 5
Live load 3KN/m^2
Wind Speed 50 kmps
Terrain category 4
Class of the structure C
Table-2 BEAM AND COLUMN SIZE DIMENSION
Ticulars Dimensions Grade of
concrete Beam Size
1- 10 floors 300X550mm M40
11-20 floors 300X500mm M40
21-30 floors 300X400mm M40
Column Size
1- 10 floors 650X650mm M40
11-20 floors 550X550mm M40
21-30 floors 500X500mm M40
Thickness of
slab 150mm M25
Interior wall
thickness 150mm
Exterior wall
thickness
© 2017, IRJET | Impact Factor value: 5.181 | ISO 9001:2008 Certified Journal
| Page 1541
Table-3 LOAD DETAILSParticulars Quantity
Live load 3 kN/m^2
Live load on top roof 1.5 kN/m^2
Floor Finish 1.8 kN/m^2
Floor Finish on top roof 1.2 kN/m^2
Mass Irregularity load 25 kN/m^2
2. RESULTS AND DISCUSSIONS
This chapter represents the results and discussions of seismic analysis of vertical irregularities of RC tall Structures. Considering the different seismic zones that is Zone 5 and Zone 2, and the method of analysis is Response Spectrum Method. The results of both mass irregularity and the results of setback are discussed by considering the following parameters.
1. Storey Displacement 2. Storey Drift
3. Storey Stiffness 4. Base shear 5. Time Period
Comparison of Storey Displacement X-Direction
Chart-1 Setback results of storey displacement for Zone 5.
Chart-2 Setback results of storey displacement for Zone 2.
✓ It is observed from chart-1 and chart-2 that
displacement increases with increase in storey in both the directions that is in X direction.
✓ Comparing all the models with regular model
(RMZ5), it is seen that model M1VZ5 (Setback irregularity
at 5th storey) has the higher displacement values.
✓ Comparing chart-1 and chart-2 it represents that
the displacement of structure in zone 5 is maximum than displacement of the structure in zone 2.
Comparison of Storey Displacement X-Direction.
Chart-3 Setback results of storey drift for Zone 5.
Chart-4 Setback results of storey drift for Zone 2.
✓ The storey drift is maximum in model M1VZ5 and
increased by 22% when compared with regular model RMZ5.
✓ The storey drift is maximum in model M1VZ2 and
increased by 24% when compared with regular model RMZ2.
✓ Comparing of all models in zone 5( RMZ5, M1VZ5,
M2VZ5, M3VZ5 and M4VZ5) with models in zone2 (RMZ2, M1VZ2, M2VZ2, M3VZ2 and M4VZ2) it is observed that models in zone 5 has the higher storey drift values.
0 50 100 150 200
0 10 20 30 40
St
ore
y
D
is
pl
ac
em
en
t in
mm
Storey DISPLACEMENT
RMZ5 M1VZ5 M2VZ5 M3VZ5 M4VZ5
0 10 20 30 40 50 60
0 10 20 30 40
St
ore
y
di
spl
ac
eme
n
t in
mm
Storey DISPLACEMENT
RMZ2 M1VZ2 M2VZ2 M3VZ2 M4VZ2
0 0.0002 0.0004 0.0006 0.0008 0.001 0.0012
0 10 20 30 40
St
ore
y
D
ri
ft
Storey
DRIFT
RMZ2
M1VZ2
M2VZ2
M3VZ2
M4VZ2
0 0.0002 0.0004 0.0006 0.0008 0.001 0.0012
0 10 20 30 40
St
ore
y
D
ri
ft
Storey
DRIFT
RMZ2
M1VZ2
M2VZ2
M3VZ2
© 2017, IRJET | Impact Factor value: 5.181 | ISO 9001:2008 Certified Journal
| Page 1542
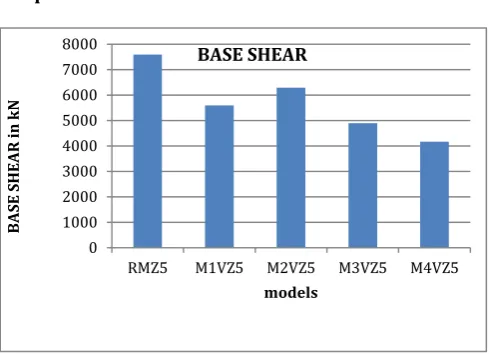
Comparison of base shear results X-DirectionChart-5 setback base shear results for zone 5
[image:4.595.39.284.104.281.2]Chart-5 setback base shear results for zone 2
Table-4 Base shear
Base shear of regular model (RMZ5) and Setback
irregularity models along X is been presented in chart-5 & 6 for Zone 5 & zone2 respectively.
It is observed that the base shear is maximum in
regular model compared with model with setback irregularity.
The base shear in models M1VZ5, M2VZ5, M3VZ5
and M4VZ5 reduced by 26%, 17%, 35 and 45% respectively when compared with regular model RMZ5.
Comparing of all models in zone 5 (RMZ5, M1VZ5,
M2VZ5, M3VZ5 and M4VZ5) with models in zone2 (RMZ2, M1VZ2, M2VZ2, M3VZ2 and M4VZ2) it is observed that base shear of models at zone5 has the higher values.
RESULTS OF MASS IRREGULARITY
BASE SHEAR RESULTS
Chart-7 Base shear results for zone 5 & 2
Chart-8 Base shear results for zone 5 & 2
Base shear of regular model (RMZ5) and Mass
irregularity model along X and Y-direction is been presented in figure 5.8.1 and figure 5.8.2 for Zone 5 respectively. Similarly Base shear of regular
model (RMZ5) and Mass irregularity models along
X and Y-direction is been presented in figure 5.8.3 and figure 5.8.4 for Zone 2 respectively.
It is observed that the base shear is maximum in
mass irregularity model compared with model with regular model.
0 1000 2000 3000 4000 5000 6000 7000 8000
RMZ5 M1VZ5 M2VZ5 M3VZ5 M4VZ5
B
A
SE
S
H
EA
R
in
k
N
models BASE SHEAR
0 500 1000 1500 2000 2500
RMZ2 M1VZ2 M2VZ2 M3VZ2 M4VZ2
B
A
SE
S
H
EA
R
in k
N
model
BASE SHEAR
0 1000 2000 3000 4000 5000 6000 7000 8000 9000
RMZ5 RMZ2 MMZ5 MMZ2
B
A
SE
S
H
EA
R
in
k
N
Model X direction
0 2000 4000 6000 8000 10000
RMZ5 RMZ2 MMZ5 MMZ2
B
A
SE
S
H
EA
R
in
k
N
Model Y direction
BASE SHEAR in kN
MODEL X direction Y direction
RMZ5 7589.622 7538.308
MMZ5 7836.24 7783.111
RMZ2 2108.568 2094.312
© 2017, IRJET | Impact Factor value: 5.181 | ISO 9001:2008 Certified Journal
| Page 1543
Comparing the model RMZ5 in zone 5 with model
RMZ2 in zone2 it is observed that models in zone 5 has the higher base shear values.
Table-5 Base shear
STOREY DRIFT RESULTS
Chart-9 Storey Drift results for zone 5
Chart-10 Storey Drift results for zone 2
Storey drift of regular model (RMZ5) and Mass
irregularity model along X and Y-direction is been presented in figure 5.7.1 and figure 5.7.2 for Zone 5 respectively.
The storey drift is maximum in model MMZ5 and
increased by 3.5% when compared with regular model RMZ5.
The storey drift is maximum in model MMZ2 and
increased by 3% when compared with regular model RMZ2.
Comparing the model RMZ5 in zone 5 with model
RMZ2 in zone2 it is observed that models in zone 5 has the higher storey drift values
3. CONCLUSIONS
From the present study it is concluded that the
building with irregular structural configuration are subjected to severe damage when compared to the regular structure.
During earthquake structure located in zone 2 are
less affected when compared to the structure located at zone 5.
There is difference in the base shear in all models
this is due to the seismic weight of the building.
The storey lateral displacement of mass irregular
frame will increase as the heavy mass floor level increases in the buildings. Regular frame has the least displacement.
At last, we finish up from the outcomes
unpredictable structures are to be treated with appropriate plan and ought to be trailed by all IS code procurements given the guidelines
REFERENCES
[1] Neha P. Modakwar1, Sangita S. Meshram2, Dinesh W. Gawatre3 “Seismic Analysis of Structures with Irregularities” IOSR Journal of Mechanical and Civil Engineering (IOSR-JMCE.
[2] N.Anvesh 1, Dr. Shaik Yajdani2, K. Pavan kumar3 “Effect of Mass Irregularity on Reinforced Concrete Structure Using Etabs” International Journal of Innovative Research in Science, Engineering and Technology Vol. 4, Issue 10, October 2015.
[3] C.M. Ravi Kumar1, K.S. Babu Narayan2, M.H. Prashanth3, H.B Manjunatha4 and D. Venkat Reddy5 “SEISMIC PERFORMANCE EVALUATION OF RC BUILDINGS WITH VERTICAL IRREGULARITY” ISET GOLDEN JUBILEE SYMPOSIUM, October 20-21, 2012.
[4] Rupesh R. Pawade1, Dr.M.N.Mangulkar2 “Influence of Combine Vertical Irregularities in the Response of Earthquake Resistance Rc Structure” IOSR Journal of Mechanical and Civil Engineering (IOSR-JMCE) Volume 14, Issue 1 Ver. IV (Jan. - Feb. 2017).
[5] J. Shaikh Sameer1, S. B. Shinde2 “SEISMIC RESPONSE OF VERTICALLY IRREGULAR RC FRAME WITH MASS IRREGULARITY” International Journal of Civil Engineering and Technology (IJCIET) Volume 7, Issue 5, September-October 2016.
[6] Ravindra N. Shelke1, U. S. Ansari2 “SEISMIC ANALYSIS OF VERTICALLY IRREGULAR RC BUILDING FRAMES”
0 0.0005 0.001 0.0015 0.002 0.0025 0.003 0.0035
0 10 20 30 40
STO
R
EY
D
R
IFT
STOREY DRIFT
RMZ5 MMZ5
0 0.0001 0.0002 0.0003 0.0004 0.0005 0.0006 0.0007 0.0008 0.0009
0 10 20 30 40
STO
R
EY
D
R
IFT
STOREY DRIFT GRAPH
RMZ2 MMZ2
BASE SHEAR in kN
MODEL X direction Y direction
RMZ2 2108.5684 2094.312
M1VZ2 1560.4699 1570.135
M2VZ2 1745.9683 1705.54
M3VZ2 1359.9852 1343.45
© 2017, IRJET | Impact Factor value: 5.181 | ISO 9001:2008 Certified Journal
| Page 1544
International Journal of Civil Engineering and Technology(IJCIET) Volume 8, Issue 1, January 2017.
[7] Rahul Ghosh1 , Rama Debbarma2 “Performance evaluation of setback buildings with open ground storey on plain and sloping ground under earthquake loadings and mitigation of failure” Int J Adv Struct Eng, 27 January 2017.
[8] Suchita HirdeȦ and Romali PatilȦ* “Seismic Performance of Setback Building Stiffened with Reinforced Concrete Shear Walls” International Journal of Current Engineering and Technology Vol.4, No.3 (June 2014). [9] Oman Sayyed1, Suresh Singh Kushwah2, Aruna Rawat3 “Effect of Infill and Mass Irregularity on RC Building under Seismic Loading”, International Research Journal of Engineering and Technology (IRJET), Volume: 04 Issue: 02 | Feb -2017.
[10] Aashish Kumar, Aman Malik, Neeraj Mehta “Seismic Response of Set-Back Structure” International Journal of Engineering and Technical Research (IJETR) ISSN: 2321-0869, Volume-3, Issue-6, June 2015.
BIOGRAPHY:
RAHUL
BTECH IN CIVIL ENGINNERING FROM ACHARYA COLLEGE OF ENGINEERING, MTECH IN STRUCTURAL