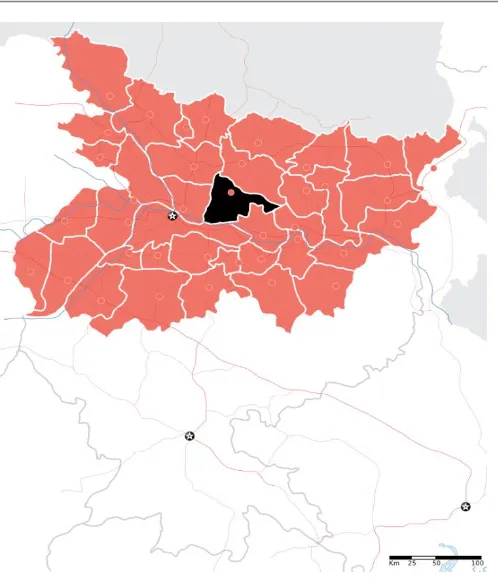
Change Detection and Prediction of Land Use and Land Cover
Full text
Figure

Related documents
In addition to the Shuler Awards, Cobb Energy Performing Arts Centre Foundation presents the following scholarships: The Morrell Memorial Scholarship to Caroline Grace Stuart
Green propellants, Launch industry,..
ABSTRACT: The present paper presents the results of an experimental investigation carried out to study the effect of Hydrochloric acid on High performance concrete with
The change in the equilibration time-scale and even the exact value for the equilibrium temperature are, how- ever, not relevant to the final solution for the chemical potential,
Structure of IBB (Source: Bangladesh Bank report, June-2016) Based on an extensive review of prior literature on IBB, the re- searcher synthesizes five important phases
Figure 6 Normal and abnormal fruits of Barhee date palm cultivar. A,B) Longitudinal section in normal fruits, forming zygote; C,D) Cross section in normal flower, development
We discovered and confirmed a separate CHIKV introduction to Brazil in Feira de Santana, which com- prises ECSA genotype infections, a CHIKV genotype previously undetected in
