© 2017, IRJET | Impact Factor value: 6.171 | ISO 9001:2008 Certified Journal
| Page 381
Sl.No. Definition Author Year
1
A city that monitors and integrates conditions of all its critical infrastructures, including roads, bridges, tunnels, rails, subways, airports, seaports, communications, water, power, even major buildings, can better optimize its resources, plan its preventive maintenance activities and monitor security aspects while maximizing services to its citizens.
Hall 2000
2
A city well performing in a forward looking way in economy, people, governance, mobility, envi- ronment and living built on the smart combination of endowments and activities of self-decisive, independent and aware citizens. Smart city generally refers to the search and identification of in- telligent solutions which allow modern cities to enhance the quality of the services provided to citizens
Giffinger et al. 2007
3 A city connecting the physical infrastructure, the IT infrastructure, the social infrastructure and the business infrastructure to leverage the collective intelligence of the city Harrison et al. 2010
4 A smart city is based on intelligent exchanges of information that flow between its many different subsystems. This flow of information is analysed and translated into citizen and commercial ser- vices. The city will act on this information flow to make its wider ecosystem more resource
effi-Gartner 2011
DEVELOPMENT STRATEGY FOR SMART CITY - A case of Chennai City
Ar. Sunitha. R.
1, Dr. Monsingh D. Devadas
21
Professor, Jawahar School of Architecture, Planning and Design, Chennai, India.
2
Dean and Professor, School of Architecture and Planning, Anna University, Chennai-600 025, India.
---***---
Abstract - The term and the concept of “Smart City” are to be promoted as an effective assessment and instrumental tool to
drive the economic growth and to improve the quality of life of the citizen. This present study paper aims to formulate the indicators and parameters executed in world cities and also to categorize to build a new understanding on the development of smart city application, strategy formulated, solution and funding provisions of cities nominated and need in Chennai city.Key Words: Smart City, Strategy, Policy, Area Based De- velopment, Pan City Development, Chennai Smart City.
1. INTRODUCTION
Population tends to increase and grow in large scale years by years as a result more citizens will move to cities which in turn needs to fulfil the infrastructure facilities become hard and hard. As India’s urban population meets the 31% of the total population, which as a turn contributes over 60% of India’s gross domestic product (GDP). As per the census re- port 2011 it is projected that urban India will contribute nearly 75% of the national GDP by 2030. It is estimated, that the Indian cities could reach 843 million numbers of people by 2050.
There starts a need and direction of platform change in the management of complexity, income stability, improvising the efficiency and to enhance the quality of life which is termed as smart city. To understand this concept it is most im- portant at the first to analyse why cities are considered key elements for the future. Cities are engines of growth for the economy of every nation.
1.1 Smart City Definition
First, there is no universally accepted definition of a smart city. It means different things to different people. S - SOLUTION TO M - MANAGE THE
A - APPLICATION OF R - RESOURCE T - TECHNOLOGY FOR CITY.
This is the terminology which was understood by the author. A range of conceptual variants is often by replacing “smart” with alternative adjectives, for example, “intelligent” or “digi- tal”.
According to the Smart Cities Council, a smart city is one that uses Information and Communications Technology (ICT) to enhance live ability, workability and sustainability. The definition also varies person by person as shown in the Table-1.
© 2017, IRJET | Impact Factor value: 6.171 | ISO 9001:2008 Certified Journal
| Page 382
Sl.No
Components of smart city
Related aspects of urban life
1 Smart economy Industry
2 Smart people Eeducation 3 Smart governance e-democracy
4 Smart mobility Logistics & infrastructures 5 Smart environment Efficiency & sustainability 6 Smart living Security & quality
cient and sustainable. The information exchange is based on a smart governance operating frame- work designed to make cities sustainable
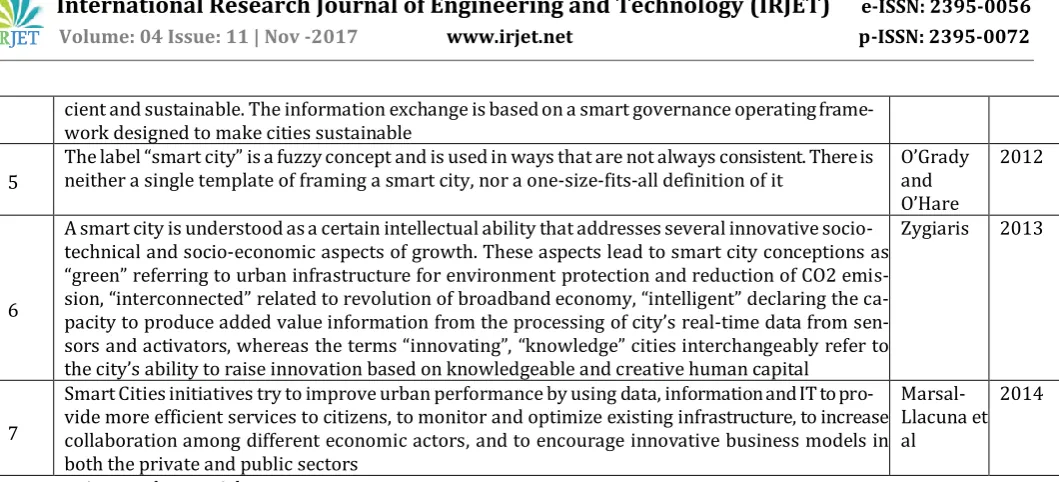
5
The label “smart city” is a fuzzy concept and is used in ways that are not always consistent. There is
neither a single template of framing a smart city, nor a one-size-fits-all definition of it O’Grady and O’Hare
2012
6
A smart city is understood as a certain intellectual ability that addresses several innovative socio- technical and socio-economic aspects of growth. These aspects lead to smart city conceptions as “green” referring to urban infrastructure for environment protection and reduction of CO2 emis- sion, “interconnected” related to revolution of broadband economy, “intelligent” declaring the ca- pacity to produce added value information from the processing of city’s real-time data from sen- sors and activators, whereas the terms “innovating”, “knowledge” cities interchangeably refer to the city’s ability to raise innovation based on knowledgeable and creative human capital
Zygiaris 2013
7
Smart Cities initiatives try to improve urban performance by using data, information and IT to pro- vide more efficient services to citizens, to monitor and optimize existing infrastructure, to increase collaboration among different economic actors, and to encourage innovative business models in both the private and public sectors
Marsal- Llacuna et al
2014
Source : various authors articles
1.2 Concept of Smart City
The conceptualization of Smart city is that it
(i) Varies from city to city and country to country (ii) Depending on the level of development (iii) Willingness to change and reform
(iv) Resources and aspirations of the city residents.
1.3 Objective and Focus of Smart City
In the approach of the smart city mission, the objective is to promote cities that provide core infrastructure and give a decent quality of life to its citizens, a clean and sustainable environment and application of ‘Smart Solutions’.
The focus is on sustainable and inclusive development and the idea is to look at compact areas, create a replicable model which will act like a light house to other aspiring cities.
1.4 Components of Smart City
[image:2.596.43.573.53.294.2]The six components with different aspects of urban life have been derived by Lombardi et al. 2012 as shown in the Table -2.
© 2017, IRJET | Impact Factor value: 6.171 | ISO 9001:2008 Certified Journal
| Page 383
2. LITERATURE REVIEW
2.1 Case Studies of Smart City
The study of different case studies of smart cities from other parts of the world with similar or unique features and differ- ent approaches lead to explore the extensive use of various process and methods used in creating a smart city with a good result.
This also le
d to study on the capitalisation for different methods adopted and time frame for various smart city pro- posals.
These case studies help in developing the ideas which are smart solutions and scalable and to make corrections wher- ever errors and mistakes occurred in the previous proposals.
2.2 Barcelona, Spain - World’s Smartest City
The Spanish city of Barcelona has been ranked the world’s smartest city, beating off competitors, New York, London and Singapore, with Rio de Janeiro missing out on a top five position.
Fig -1: Night Image showing World’s Smartest City –
BARCELANO
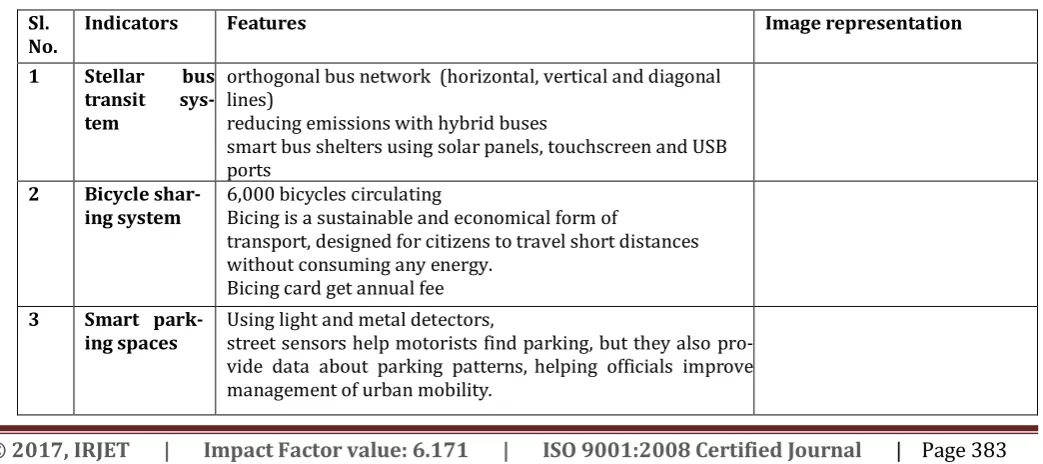
[image:3.596.175.420.302.435.2]Barcelona is not a perfect city. But with an overall aging population and an economic recession, local government has found ways to create jobs and improve the quality of daily life for its residents and visitors. The various indicators and features are detailed out in the Table -3
TABLE -3: Indicators of Barcelano World’s Smartest City
Sl.
No. Indicators Features Image representation
1 Stellar bus
transit sys- tem
orthogonal bus network (horizontal, vertical and diagonal lines)
reducing emissions with hybrid buses
smart bus shelters using solar panels, touchscreen and USB ports
2 Bicycle shar-
ing system 6,000 bicycles circulating Bicing is a sustainable and economical form of
transport, designed for citizens to travel short distances without consuming any energy.
Bicing card get annual fee
3 Smart park-
[image:3.596.42.564.546.778.2]© 2017, IRJET | Impact Factor value: 6.171 | ISO 9001:2008 Certified Journal
| Page 384
4 Pneumatic
waste man- agement sys- tem.
Compact drop-off containers have a subterranean vacuum network through the pipes, sucking up trash below the ground. This automated waste collection system decreases noise pollu- tion made by trash trucks and keeps the public space and stench clear.
Through radio frequency and WiFi, the sensor gives data to a central system, detecting the trash level. Sanitation workers can then plan the optimal route and times to collect it
5 Installation of smart lighting
Efficient lighting using LED technology is being installed in Barcelona to reduce cost and pollution it activates when de- tecting motion, but also gathers environmental information, humidity, temperature, pollution, and noise.
6 Use of re- newable and more effec- tive energy systems
taken advantage of the ample solar energy.
the first city to require to use solar water heaters in 2006. Solar Thermal Ordinance also regulated all new large buildings such as hotels, hospitals, gyms, or swimming pools to produce their own domestic hot water, lowering emissions.(2000) The heating uses steam from the incineration of urban waste and the cooling uses seawater for refrigerating, producing less fossil energy consumption and carbon emissions.
Districlima plant uses local Mediterranean seawater to cool buildings.As one of the largest photovoltaic installations in Europe, this solar panel produces 550,000 Kw/h a year, which can generate power to over 160,000 households.
7
The Mobile World Capi- tal
Many candidates attend the conference and exhibition facili- ties, tourism and transportation infrastructure, and its commitment to extending the reach of mobility locally and nationally.72,000 people attended the Mobile World Congress
8 urban mobil- ity through apps
TMB Virtual - Point your smartphone’s camera in any direc- tion, and “bus stop signs, lines and the distance to them in me- tres will appear on the screen, superimposed on real-world images Trànsit - helps you find the best route
Tricentenari - Point your camera at any of the numbered plac- es, and information of Barcelona in 1714 appears
9 Participatory citizens and transparent government
© 2017, IRJET | Impact Factor value: 6.171 | ISO 9001:2008 Certified Journal
| Page 385
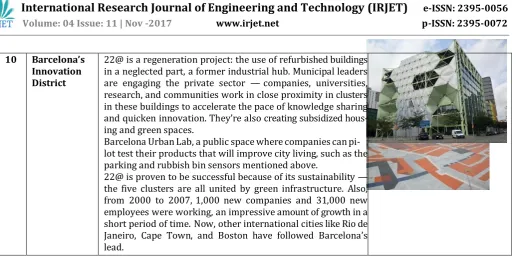
10 Barcelona’s Innovation District
22@ is a regeneration project: the use of refurbished buildings in a neglected part, a former industrial hub. Municipal leaders are engaging the private sector — companies, universities, research, and communities work in close proximity in clusters in these buildings to accelerate the pace of knowledge sharing and quicken innovation. They’re also creating subsidized hous- ing and green spaces.
Barcelona Urban Lab, a public space where companies can pi- lot test their products that will improve city living, such as the parking and rubbish bin sensors mentioned above.
22@ is proven to be successful because of its sustainability — the five clusters are all united by green infrastructure. Also, from 2000 to 2007, 1,000 new companies and 31,000 new employees were working, an impressive amount of growth in a short period of time. Now, other international cities like Rio de Janeiro, Cape Town, and Boston have followed Barcelona’s lead.
3. DEVELOPMENT STRATEGY OF SMART CITY
[image:5.596.50.567.48.309.2]The strategic components of Area based development in the smart cities mission are: City Improvement (Retrofitting), City Renewal (Redevelopment), City Extension (Greenfield development), Pan-city Initiative in which smart solutions are applied covering larger parts of the city. The Area based development is the key element of the Smart City Proposal are framed in the Table -4 as below.
Table -4: Strategic Components
AREA BASED DEVELOPMENT INITIATIVE
DESCRIPTION RETROFITTING REDEVELOPMENT GREENFIELD
DEVELOP-MENT PANCITY DEVEL-OPMENT
Planning As-
pects Existing built up area Existing built up and new layout Vacant land Existing city
Planning
Benefits To create a more effi- cient and liveable of ex- isting area
To enhance infrastruc- ture using mixed land use and increased den- sity Smart solution Using innovative planning Plan financing Plan implementation tools
Use of technology Information and data to make infra- structure and ser- vices better
Development Existing Area more than
500 Acres Area more than 50 Acres Vacant area more than 250 Acres Smart solution ap- plication
Identification By the city in consulta-
tion with citizens By the Urban Local Bod- ies in consultation with citizens
Limits of Urban Local Bodies
Limits of Urban Development Authority
By the Urban Local Bodies
Time frame Shorter span Long span Long span
Features
de-pend on Existing infrastructure services to become smart
Mixed land use Higher FSI
High ground
coverage
Land pooling
Land reconstitution Intelligent traffic management Waste water recycling Smart metering
Benefit Replicate in another part
© 2017, IRJET | Impact Factor value: 6.171 | ISO 9001:2008 Certified Journal
| Page 386
EXAMPLES SaifeeBurhani
Upliftment Project in Mumbai
East Kidwai Nagar in New Delhi
GIFT city in Gujarat
Source : Smart City Mission and Guidelines
[image:6.596.36.561.48.166.2]To develop the entire urban system, it is represented by the four pillars of comprehensive development as given in Table -5.
Table -5: Four Pillars of Smart City
INSTITUTIONAL INFRASTRUCTURE
1. Good governance.
2. City development plans based on ICT and spatial mapping.
3. Safety and security. 4. Public participation.
SOCIAL INFRASTRUCTURE
1. Smart and quality education. 2. Smart and quality healthcare 3. Entertainment and sports facilities. 4. Convention centres and auditoriums.
5. Botanical garden.
PHYSICAL INFRASTRUCTURE
1. 24x7 smart utility services(water, power,etc.,) 2. Smart urban mobility
3. Smart but affordable housing 4. Zero emission sanitation services. 5. Integrated ICT infrastructure.
ECONOMIC INFRASTRUCTURE
1. Industrial parks and export processing zones. 2. IT/BT parks.
3. Trade, services, financial and tourism centres. 4. Skill development centres.
5. Logistics hubs. Source : Smart City Mission Guidelines
4. STUDY AREA – CHENNAI
Chennai is the state capital of Tamil Nadu, India’s Metropolitan area is fourth largest city, by economy and population. The city directed as a business hub of the state and has a diverse array of economic sectors and is known for its automobile industry historically and rich IT sector.
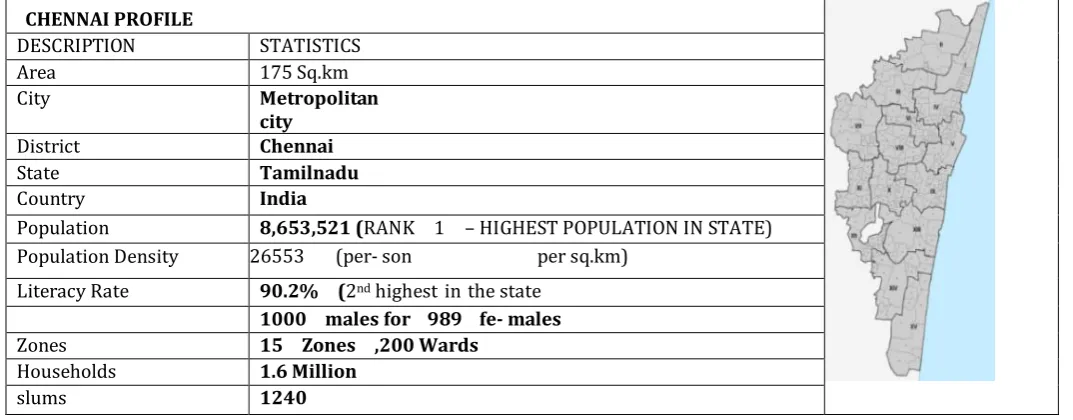
[image:6.596.33.570.518.728.2]The location of Chennai with the state and the Table-6 clearly states the Chennai profile status in detail.
Table -6: Profile of Chennai District
CHENNAI PROFILE
DESCRIPTION STATISTICS
Area 175 Sq.km
City Metropolitan
city
District Chennai
State Tamilnadu
Country India
Population 8,653,521(RANK 1 – HIGHEST POPULATION IN STATE) Population Density 26553 (per- son per sq.km)
Literacy Rate 90.2% (2nd highest in the state 1000 malesfor 989 fe- males
Zones 15 Zones ,200 Wards
Households 1.6 Million
slums 1240
© 2017, IRJET | Impact Factor value: 6.171 | ISO 9001:2008 Certified Journal
| Page 387
4.1 Chennai’s Eminent Features
In recent years, Chennai has emerged as an electron- ic manufacturing hub in South Asia, Chennai is known as the Detroit of Asia.
a) The city accounts for 60 per cent of India’s automotive exports, which leads it to be called as ‘The Detroit of Asia’.
b) Chennai has been tagged as the Banking Capital of India, for its vibrant banking culture and trading. Chennai leads in the health care sector and is considered the Health Capital of India.
c) Chennai has been recognized as the first city in India to adopt and in the implementation Non-Motorized Transport (NMT) policy as a result of promotion of pedestrianisation. Chennai corporation has been awarded with the prestigious international SUSTAINIA AWARD.
d) Chennai won the GLOBAL WATER LEADERS AWARD
-2015 for fast tracking its innovative resilience plan in solution for the fulfillment of the water scarcity as per Census 2011.
e) Chennai is ranked as a number one districts in Tamil Na- du for 1) Concrete housing roofs about 77%. 2) Houses with bath & drainage facilities of 97%.
f) Chennai with its strong presence in planned environment has scored the number one position as “MOST LIVEABLE CITY”
in India as per Institute for Competitiveness, 2012.
g) India today ranked Chennai as the "Best City" for two consecutive years (2014 & 2015) in its Best Cities Survey for its excellence and betterment in parameters like expenditure on education, crime rates, economic growth and investment generation.
4.2 Chennai City – A Smart City
Chennai is one of the city has been selected in the list of 100 smart cities and also in the FIRST LIST out of 20 cities under Urban Development Ministry Smart City Mission.
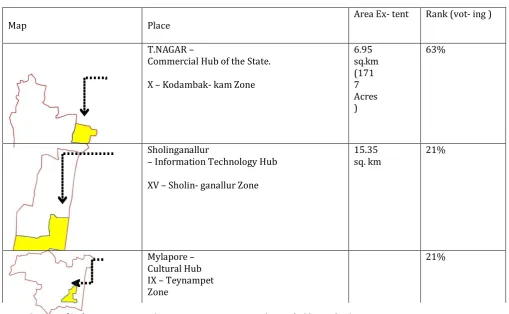
The Corporation of Chennai has selected three cities – T.Nagar, Sholinganallur and Mylapore to develop as a smart city under Urban Development Ministry ‘Smart City Mission’ which was launched by Indian Prime Minister Narendra Modi on 21 June 2015.
Chennai Corporation selected three Cities to develop as a Smart City as they classified into three different hubs, Such as
T Nagar - Commercial hub. Mylapore - Cultural hub. Sholinganallur - IT hub.
The detail study of the three places nominated to promote as a smart city is given in the Table X
4.4 Chennai City – Identified Features
© 2017, IRJET | Impact Factor value: 6.171 | ISO 9001:2008 Certified Journal
| Page 388
Map Place Area Ex- tent Rank (vot- ing )
T.NAGAR –
Commercial Hub of the State.
X – Kodambak- kam Zone
6.95 sq.km (171 7 Acres )
63%
Sholinganallur
– Information Technology Hub
XV – Sholin- ganallur Zone
15.35
sq. km 21%
Mylapore – Cultural Hub IX – Teynampet Zone
[image:8.596.40.550.115.429.2]21%
Table -7: Smart City Identified Hub Profile
Source : Census of India,
COMPONENTS PARAMETERS
Open spaces management Interconnected Open Spaces
Smart Open Space manage- ment Rejuvenation of parks and pub- lic spaces Public park over Nallah
Plazas
Integrating and Re-organizing spaces
Flood Man- agement Hydrological information sys-
tem
Flood warning and monitoring system
Table -9: Pan City Proposals – Chennai
Source : Smart City Mission Guidelines
PAN CITY PROPOSALS FOR CHENNAI
Smart parking system NMT infrastructure LED street lighting
Grievance redresses through web, app and phone Hydraullic information system/ flood monitoring Cycle sharing
Parking management (pricing) Online system of water connections Water level sensors
2011. www.chennaicorporation.gov.in (compiled by author)
International Research Journal of Engineering and Technology
(IRJET)
e-ISSN: 2395-0056 Volume: 04 Issue: 11 | Nov -2017 www.irjet.net p-ISSN: 2395-0072© 2017, IRJET | Impact Factor value: 6.171 | ISO 9001:2008 Certified Journal
| Page 389
4.5 Area Based Development – T.Nagar
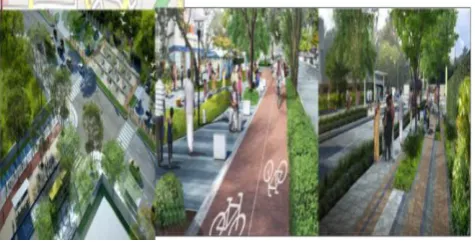
The proposal with the area based development, T.Nagar is shortlisted based on the voting by online/offline, the pref- erences are from the citizen engagement, stakeholder con- sultation, elected representative discussion. It has a diverse mix of residential, commercial, retail, educational and enter- tainment developments, thereby setting a global example for a balanced and self-sustained mixed use modern city with the model of other smart cities where infrastructure is be- coming more and more connected, intelligent and automat- ed.
The Figure-2 and -3 is the artistic impression an idea of providing smart traffic system and walkway along the park, cycling into the community by introducing non motor transport system after the implementation of the Smart City Proposal in T.Nagar, Chennai city.
Fig -2: Identified parks – ABD – T.Nagar
Fig -3: Artistic Impression Of T.Nagar
4.6 Fund Allocation – T.Nagar
The Chennai Smart City Limited (CSCL) of the Greater Chennai Corporation drives this mega Smart City Proposal in Chennai by the special purpose vehicle tasked with the project’s implementation. This project implemented Rs. 518 crore to water management and information technology and Rs. 848 crore worth retrofitting solutions for T.Nagar.
4.7 Findings
[image:9.596.182.422.250.421.2] [image:9.596.181.419.456.577.2]© 2017, IRJET | Impact Factor value: 6.171 | ISO 9001:2008 Certified Journal
| Page 390
Comprehensive development in this way will improve quality of life, create employment and enhance incomes for all, especially the poor and the disadvantaged, leading to inclusive Cities. Undergoing after a long study of the Smart city mission Proposal for Chennai, it is very clear that Chennai shall be privileged to be a universal cultural hub for safe and sustainable living with enhanced mobility, smart urban infrastructure and become more resilient to the physical, social, and economic challenges.The features of the smart city proposal could bring the best result such as i) Create a natural environment as the future strategic component. ii) Inclusion of urban residents
iii) Innovative Planning action in urban development. iv) Smart Infrastructure Technology.
5. CONCLUSION
The concept of smart city clearly defines it is a different things to different cities. Area based development plays a vital role in the term of smart city project which enhances the quality of life and the environment a better living. Pan city development focus on the advanced technology and being a research model for future projects to be implemented. This study paper clearly defines the various methods, components, strategies and applications adopted for a smart city. Many of the assessment metrics, elements and tools which focus on smart city has been emerged from the analysis of the existing literature. A smart city achievement and assessment should be accounted by which cities have different vision and priorities to reach their objectives, but sure that there should be a promotion for integrated framework strategy development of different aspects.
REFERENCES
[1] Albino, V., Berardi, U., & Dangelico, R. (2015). Smart cities:Definitions, dimensions, performance,and initiatives. Journal of Urban Technology, 22(1), 3–21. http://dx.doi.org/10.1080/10630732.2014.942092
[2] Chennai Metropolitan Development Authority (2008). Second master plan for Chennai Metropolitan Area, 2026. http://www.cmdachennai.gov.in/smp_main
[3] Directorate of Census Operations, Tamil Nadu 2001, ‘Census of Tamil Nadu 2001’, Ministry of Home Affairs, Government of India.
[4] Directorate of Census Operations, Tamil Nadu 2011, ‘Census of Tamil Nadu 2011’, Ministry of Home Affairs, Government of India.
[5] Giffinger, R., Fertner, C., Kramar, Kalasek, R., Pichler- Milanović, N., & Meijers, E. (2007), Ranking of European medium- sized cities. Vienna UT, October: Centre of Regional Science .
http: www.smart- cities.eu/download/smart_cities_final_report.pdf
[6] Greater Chennai Corporation http://www.chennaicorporation.gov.in/
[7] Hall, R.E.,“The Vision of a Smart City.” Proc. of the 2nd International Life Extension Technology Workshop, Paris,
France, 2000.
[8] Harrison, C., B. Eckman, R. Hamilton, P. Hartswick, J.Kalagnanam, J. Paraszczak, and P. Williams, “Foundations for Smarter Cities,” IBM Journal of Research and Development 54: 4 (2010) 1–16.
[9] Lee, J. H., Hancock, M. G., & Hu, M. -C. (2014). Towards an effective framework for building smart cities: Lessons from Seoul and San Francisco. Technological Forecasting and Social Change, 89, 80–99.
[10] Lombardi, P., Giordano, S., Farouh, H., & Yousef, W.(2012). Modelling the smart city performance .Innovation: The European Journal of Social Science
© 2017, IRJET | Impact Factor value: 6.171 | ISO 9001:2008 Certified Journal
| Page 391
sustainable and livable cities to better address the Smart Cities initiative. Technological Forecasting and Social Change, 90(B), 611–622. http://dx.doi.org/10.1016/j.techfore.2014.01.012.[12] Master Plan - II for Chennai Metropolitan Area - 2026, March 2007, Chennai Metropolitan Development Authority, Tamil Nadu.
[13] MoUD, Government of India, "Smart cities: Mission statement and guidelines",2015, smartcities.gov.in/ SmartCityGuidelines.pdf