© 2017, IRJET | Impact Factor value: 5.181 | ISO 9001:2008 Certified Journal | Page 3018
Quality Improvement Using GR&R : A Case Study
Raman Bhakhri
1, Dr. R.M.Belokar
21Production Engineering Department PEC University of Technology, Chandigarh
2Production Engineering Department PEC University of Technology. Chandigarh
---***---Abstract
- Gauge R&R, which means gauge repeatabilityand reproducibility, is a statistical tool which calculates the variation in the measurement system to how much extent that comes from the measurement tool and the operators calculating the measurement.One of the method of gauge R&R has been explained i.e. crossed study to find Gauge R&R in detail and shows how important role is played by GR&R in finding acceptability of a measuring system of the firm.. We have generated an industry expert interviews and survey based study of Ludhiana- phagwara industrial region also a case study is also done on implementation of GR&R technique in a industry manufacturing engine spare parts.. A four months long industry analysis for initiating GR&R practices and then devising a plan for reducing rejection of manufacturing parts in the Industry and reducing the cost of poor quality of the manufactured parts of the industry
KeyWord - MSA,bias, accuracy ,precision, linearity, stability, total variation, gauge, part, trial, repeatability error, reproducibility error
1. INTRODUCTION
The motive of implementing Gauge R&R study is determine if a measurement system is sufficient for your requirements which is shown after finding the R&R%. A gauge R&R study will explain operators if the measurement system is fair for its intended use. The gauge study also proves which part of the measurement system is giving contribution the most to the unstability of the measurements and assists operators execute stability to the system. Measurement systems have variation from three major sources: thecomponents, the operators taking the measurements and the device used to take the measurement.The contribution in each of these areas can be analyzed from the GR&R results from minitab . In a good measurement system, one must expect to calculate almost complete variation in the products only. If the operators or the devices creates most of the variation, then the system may not be valid. The goal of using Gauge R&R study is fullfilled if a measurement system is worth for your requirements which can be told after finding the R&R%. However, the disadvantage of applicationof GR&R is that it does
not give the idea of accuracy. Though we are having GR&R values which are not significant further results of the test are not accurate and no idea of material or the final product is not obtained.
2. GR&R Study Types
Following are the types 1 .Crossed gage R&R study
A study in which each part is measured by each operator. The study is known as crossed because the each operator measure the same parts number of times . To perform a crossed gage R&R study in Minitab,go to stat then quality tools then gage study. Oftenly, we are using a crossed gage R&R study to find out amount of our process variation is caused by measurement system variation.
2. Nested gage R&R study
A study in which each part is measured by single operator because the part is destroyed by the test. This study is known as nested because another factor nest one or more factors and concluding not being crossed with the other factors. To perform a nested gage R&R study in Minitab then follow the same steps as above and click on GR&R (nested)
3. Expanded gage R&R study
A study in which one or more of the following conditions are valids
More than two factors, mainly appraisels, measuring instruments, and product.
Random or fixed factors
Both crossed and nested conditions Design is not balanced.
© 2017, IRJET | Impact Factor value: 5.181 | ISO 9001:2008 Certified Journal | Page 3019 3. Research Methodology
4. Sources of variation
Actual process variation and measurement variation is in each observation of process variation. Actual process variation made of extended, short, and within sample variation. Gage variation made up of of variations due to calibration, stability, repeatability, and linearity
1. Repeatability & Reproducibility Error ( R&R) The R&R error is the combined result of repeatability reproducibility error.
2.Appraiser Variation(Av) Or Reproducibility Error : Reproducibility error is caused when the reading of a part is not reproduced across operators or under different environmental conditions. It is also termed as Operator appraiser error
3. Part Variation Error (Pv)
Part Variation error is the error coming from product choosen for measurement.
4. Total Variation (Tv)
Total variation is the resultant of Repeatability and Reproducibility error (R&R) and Part variation error (PV).
5. Equipment Variation (Ev) Or Repeatability Error When instrument is not repeating reading of the product when same operators measure no. of times in the same conditions of environment . It is also called Instrument error.
5. Measure phase of DMAIC METHODOLOGY
To ensure system (measurement) is statistically sound Gauge R&R study is performed. Gauge reproducibility & repeatability studies shows that how much of the observed process variation is due to measurement system variation. It has been conducted with 3 operators,3 repeats and 14 parts using dial gauge and micrometer. Forming a gauge run chart and then conducting analysis of gauge R&R study and then answering questions
TABLE4.1: MINITAB DATA SHEET OF DIAMETER OF LINER CYLINDER FOR GAUGE R&R STUDY (IN MILIMETER)
SERIAL
NO. TRIALS OPERATORS MEASUREMENT
1 1 Raman 100.139
2 2 Raman 99.123
3 3 Raman 100.216
4 4 Raman 99.552
5 5 Raman 99.171
6 6 Raman 99.997
7 7 Raman 99.884
8 8 Raman 99.809
9 9 Raman 100.174
10 10 Raman 100.567
11 11 Raman 99.871
LITERATURE SURVEY
RESEARCH GAP
OBJECTIVES OF THE STUDY
CASE STUDY OF Mfg. INDUSTRY
IDENTIFICATION OF PROBLEM
DATA COLLECTION DMAI
C
METHODOLO GY
IMPROVEMENT RESULTS
RESULT APPRAISAL
CONCLUSION S
© 2017, IRJET | Impact Factor value: 5.181 | ISO 9001:2008 Certified Journal | Page 3020
12 12 Raman 100.545
13 13 Raman 100.282
14 14 Raman 100.714
15 1 Raghav 100.263
16 2 Raghav 99.650
17 3 Raghav 100.270
18 4 Raghav 99.741
19 5 Raghav 99.595
20 6 Raghav 100.543
21 7 Raghav 99.791
22 8 Raghav 99.591
23 9 Raghav 99.844
24 10 Raghav 100.304
25 11 Raghav 99.934
26 12 Raghav 100.472
27 13 Raghav 100.319
28 14 Raghav 100.421
29 1 saurabh 100.196
30 2 saurabh 99.673
31 3 saurabh 100.348
32 4 saurabh 99.744
33 5 saurabh 99.667
34 6 saurabh 100.563
35 7 saurabh 99.881
36 8 saurabh 99.599
37 9 saurabh 99.885
38 10 saurabh 100.403
39 11 saurabh 100.116
40 12 saurabh 100.578
41 13 saurabh 100.274
42 14 saurabh 100.492
43 1 Raman 100.499
44 2 Raman 99.364
45 3 Raman 99.865
46 4 Raman 99.920
47 5 Raman 99.356
48 6 Raman 100.411
49 7 Raman 100.004
50 8 Raman 99.102
51 9 Raman 99.908
52 10 Raman 100.776
53 11 Raman 99.533
54 12 Raman 100.310
55 13 Raman 100.023
56 14 Raman 100.474
57 1 Raghav 100.180
58 2 Raghav 99.633
59 3 Raghav 100.375
60 4 Raghav 99.685
61 5 Raghav 99.627
62 6 Raghav 100.618
63 7 Raghav 99.713
64 8 Raghav 99.595
65 9 Raghav 99.903
66 10 Raghav 100.249
67 11 Raghav 99.951
68 12 Raghav 100.433
69 13 Raghav 100.232
70 14 Raghav 100.499
71 1 saurabh 100.272
72 2 saurabh 99.596
73 3 saurabh 100.295
74 4 saurabh 99.827
75 5 saurabh 99.681
76 6 saurabh 100.639
77 7 saurabh 99.773
78 8 saurabh 99.567
79 9 saurabh 99.863
80 10 saurabh 100.302
81 11 saurabh 99.981
82 12 saurabh 100.535
83 13 saurabh 100.256
84 14 saurabh 100.502
85 1 Raman 100.239
86 2 Raman 99.502
87 3 Raman 100.329
88 4 Raman 99.789
89 5 Raman 99.549
90 6 Raman 100.438
91 7 Raman 99.727
92 8 Raman 99.497
93 9 Raman 99.872
94 10 Raman 100.310
95 11 Raman 99.986
96 12 Raman 100.481
97 13 Raman 100.242
98 14 Raman 100.394
99 1 Raghav 100.228
100 2 Raghav 99.595
101 3 Raghav 100.269
102 4 Raghav 99.810
103 5 Raghav 99.606
104 6 Raghav 100.586
105 7 Raghav 99.741
106 8 Raghav 99.624
107 9 Raghav 99.844
108 10 Raghav 100.300
109 11 Raghav 100.044
110 12 Raghav 100.538
© 2017, IRJET | Impact Factor value: 5.181 | ISO 9001:2008 Certified Journal | Page 3021
112 14 Raghav 100.424
113 1 saurabh 100.319
114 2 saurabh 99.670
115 3 saurabh 100.320
116 4 saurabh 99.788
117 5 saurabh 99.643
118 6 saurabh 100.494
119 7 saurabh 99.774
120 8 saurabh 99.658
121 9 saurabh 99.877
122 10 saurabh 100.391
123 11 saurabh 100.063
124 12 saurabh 100.472
125 13 saurabh 100.250
126 14 saurabh 100.536
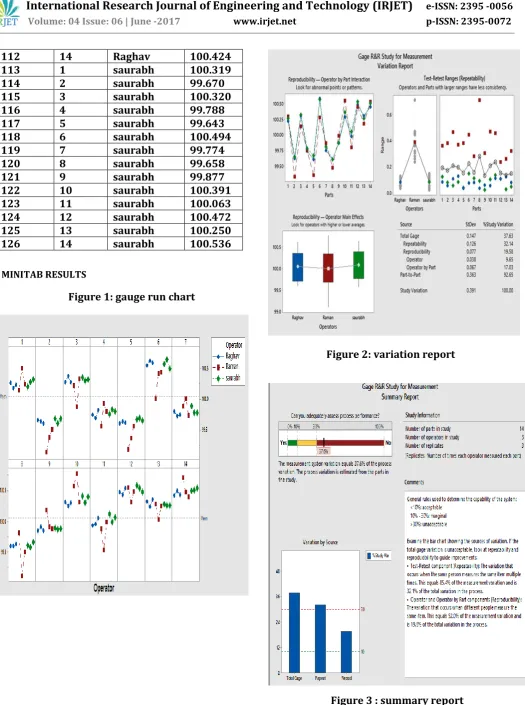
6. MINITAB RESULTS
[image:4.595.45.571.50.756.2]Figure 1: gauge run chart
Figure 2: variation report
© 2017, IRJET | Impact Factor value: 5.181 | ISO 9001:2008 Certified Journal | Page 3022 7. ANALYSIS PHASE OF DMAIC methodology
From gauge run chart 2 things can be analysed
1. Reproducibility and Repeatability issues
Raman is not agreeing with himself and with others so he is responsible for repeatability and reproducibility issues
2. Range of parts
It tells what is the maximum and minimum size and what is the difference between the two and how does that compare to the errors. Sixth part on an avg has highest measurements and part with lowest measurement is eighth. Biggest range is between sixth and eighth and how does Raman errors compared to that range and errors he is making are quite significant
From fig variation report we can analyze after looking at avg measurement for each part and operator that Raghav and saurabh are overlapping with each other and Raman is not agreeing with avg measurement so he is the problem creating factor. From box charts for each operator , box charts are,nt so bad actually they are quite level, just tails on the poor Raman is longer and for repeatability issues we can have a look at the range charts that this is range of measurements plotted for each part we have difference between max and min for each operator for each part plotted here and again Raghav and saurabh agree with each other . Range for Raman is far greater than other 2 guys and we can see how Raman range of measurement is way bigger than anyone else and for PART 8 we are giving break down at the error. Other thing to note here under reproducibility we have atleast one guy having problem by % study variation and atleast one part’s manufacturing i.e. 8th must be checked to lessen down the rejection. In this phase, an action plan is created to close the gap between how things currently work and how the organization would like them to work in order to meet the goals for a particular product or service.
8. IMPROVEMENT PHASE
In this phase we try to improve the cause of problem. In current case operator must be well trained and ovality is found to be the source of problem so the improvement action is taken for same.There is something wrong with part 8 i.e. ovality variation,perpendicularity,etc because raman’s measured data is away from other guys so its manufacturing in a production line must be analyzed and controlled.Eliminating raman’s measured data measurement system variation become equal to 14.2 % of process variation, so he must undergo training program to measure properly.Moreover since capability of system is marginal we have some repeatability issues to avoid and eliminate it our measuring instrument should be proper caliberated
9. REFERENCES
© 2017, IRJET | Impact Factor value: 5.181 | ISO 9001:2008 Certified Journal | Page 3023 2. Burdick, R. K., Borror, C. M., and Montgomery, D. C.
(2005), Design and Analysis of Gauge R&R Studies: Making Decisions with Confidence Intervals in Random and Mixed ANOVA Models, SIAM, Philadelphia, PA
3. Smith R.R., McCrary S.W., Callahan R.N., “Gauge repeatability and reproducibility studies and measurement system analysis: A Multi method exploration of the state of practice”, Journal of Quality Technology, 23, 1, 1-11, (2007)
4. Tsai.P (1988-89). “Variable Gauge Repeatability and Reproducibility Study Using the Analysis of variance Method”, Quality EngineerinG.
5. Keith M. Bower, Michelle E.Touchton “Evaluating The Usefulness of Data By Gauge Repeatability and Reproducibility”, Minitab Inc.(2009)
6. Dr. R. M. Belokar, Harish Kumar Banga, Jagbir Singh, Pratik Belokar “Improvement of Quality through Six Sigma: A Case Study”. International Journal of Engineering, Business and Enterprise Applications, 8(2), March-May., 2014, pp. 127-131
7. Brook, Quentin. Lean Six Sigma and Minitab. UK:
OPEX Resources