© 2017, IRJET | Impact Factor value: 5.181 | ISO 9001:2008 Certified Journal
| Page 2307
COMPUTER AIDED MANUFACTURING FACTORS AFFECTING
REDUCTION OF SURFACE ROUGHNESS AND THICKNESS IN
INCREMENTAL SHEET FORMING PROCESS
Deepak
1, Sanjeet Singh
21
M. Tech. Research scholar, Department of Mechanical Engineering, CBS Group of Institutions, Fatehpuri, Jhajjar,
Haryana, India (124103)
2
Assistant Professor, Department of Mechanical Engineering, CBS Group of Institutions, Fatehpuri, Jhajjar,
Haryana, India (124103)
---***---Abstract -
Incremental sheet forming (ISF) has established its great potential to form complex three-dimensional parts without using a matching die. The process locally deforms sheet metal using a moving tool head attaining higher forming limits than those of conventional sheet metal stamping process. The die-less nature in incremental forming provides a viable substitute for economical and effective fabricating low-volume functional sheet products. Various application areas include aerospace engineering, customized products in biomedical engineering and prototyping in the automotive engineering. This paper presents a review on experimental investigation of ISF process factors or parameters like feed rate, speed, tool diameter, sheet thickness, lubrication, step size and tool path affecting surface roughness and thickness reduction.Key Words: Incremental sheet forming (ISF), single
point incremental sheet forming, roughness, thickness reduction, tool path.
1. INTRODUCTION
Incremental Sheet Forming (ISF) process is sustainable in small scale production to deal with the various needs like customization, low tooling cost and setup time. The conventional forming processes already used in the industry (like deep drawing, stamping) need high investment cost and long die-preparation times for small scale production [1]. Therefore, ISF is a process which is, now a days, available for small batch production or prototyping as it deals with the issues in the conventional forming process.
ISF is a forming technique of sheet metal process based on layered manufacturing principle. The sheet part is locally
deformed through horizontal slices. The moving locus of
forming tool (tool path) in these slices is performed by the CNC milling machine. The tool path is generated directly from CAD model of final product by using CAM system. Surface roughness is reduced to increase the surface quality of parts (e.g. reflexive surfaces for headlights) and to reduce friction between mating parts like production dies and mould surfaces etc. Thickness reduction defines both Geometrical accuracy as well as the strength of the forming parts. Uniform thickness distribution leads to better geometrical accuracy and better strength.
[image:1.595.313.535.271.368.2]
Fig -1: Principle of Incremental Sheet Forming [1]
1.1 Classification of Incremental Sheet Forming
The ISF can be classified as
Single Point Incremental Forming (SPIF)
Two Point Incremental Forming (TPIF)
1.1.1
Single Point Incremental Forming (SPIF)
In SPIF type of incremental forming, the blank is clamped along its edges and the tool (generally a spherical tool) moves along the sheet surface, as shown in fig - 2. Hence no die is used and even asymmetrical parts can be easily formed. This method can be executed using a conventional CNC milling machine, including a CAD/CAM system to produce the tool path [2].
[image:1.595.335.542.601.732.2]© 2017, IRJET | Impact Factor value: 5.181 | ISO 9001:2008 Certified Journal
| Page 2308
1.1.2
Two Points Incremental Forming:
[image:2.595.318.557.190.281.2]In Two Point Incremental Forming (TPIF) the blank is clamped in the blank holder which can be adjusted in the Z axis. The forming tool is similar to the tool in SPIF and performs a trajectory of the outer surface of the part, from top to bottom of the geometry. In TPIF a die is used below the blank & die has the same function as the supporting plate only and increase the geometry accuracy.
Fig -3: Two Point Incremental Sheet Forming [3]
1.2
CAM factors / process parameters used for
Incremental Sheet Forming are :
(i)Tool diameter (ii) Step size (iii) Feed rate (iv) Speed (v) Sheet Thickness (vi) Lubrication (vii) Tool path
In ISF the process parameters (like speed, feed rate, incremental step size, lubrication, tool diameter, sheet thickness, material, and tool path) are affecting the surface roughness, and thickness reduction as described below from the previous study:
Surface roughness:
Factors have greatly influenced the surface quality in incremental sheet forming. J. Kopac, Z. Kampus (2005) [6] presented the processes controlled by CNC milling machine tool with CAD/CAM. Surface roughness of aluminum sheet is lower that steel because steel is highly deformable and subjected at minimum hardening. I. Cerro, E. Maidagan (2006) [7] stated that roughness is lower in the tool advancing direction than in perpendicular one. Roughness can be decrease by decreasing axial step size.
Thickness reduction:
Factors mainly affecting thickness reduction are sheet thickness, step size and feed rate. Ambrogio et al. (2005) [5] and Young and Jeswiet (2004) [4] found that wall thickness initially greater than the sine low thickness then reduces to less than the sine low thickness across the formed region of copper plates. This suggests that thinning beyond the sine low prediction as a result of material being pushed towards the center of geometry.
2. EXPERIMENTAL SETUP
2.1 CNC Machine:
All the experiments were performed at CTR (central tool room) Ludhiana, Punjab. Where precise machines are available and CNC Milling Machine is readily available. CNC Vertical Milling Machine (VMC2216XV) used for the experimentation purpose of ISF As shown in Fig -4(a)
Fig -4(a): Overview of CNC milling machine (VMC) and
Fig -4(b): Stainless steel tool of diameter 20 mm
2.2 Forming Tool:
Forming tool used are basically are made of hardened stainless steel. Tool diameter is 16mm, 18mm and 20mm. Tool with tool holder shown in fig -4(b).2.3 Fixture and Clamping system for SPIF:
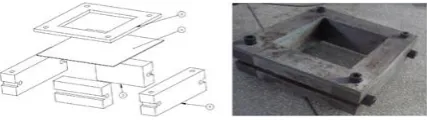
Single point incremental sheet forming performed on hollow fixture as shown in figure. A static frame is composed with using clamping devices. Assembly drawing for the SPIF clamping system and its overview is shown in the fig - 5. A blank holder is fixed with fixture using bolts, to holds the sheet over the blank. Total working area of the machine is 240 x 240 mm2 in this processFig -5 Assembly drawing for the SPIF Clamping System
2.4 Material used:
Aluminium grade Al-2014 is used for forming process with three different thicknesses 1.2, 2 and 2.3 mm. Specification of material is described in table 1Table 1
Material Specification:
Aluminum Balance
Chromium 0.1 max
Copper 3.9-5
Iron 0.7 max
Magnesium 0.2-0.8
Manganese 0.4-1.2
Silicon 0.5-1.2
Titanium 0.15 max
Titanium + Zinc 0.2 max
[image:2.595.52.284.215.306.2] [image:2.595.346.560.471.531.2]© 2017, IRJET | Impact Factor value: 5.181 | ISO 9001:2008 Certified Journal
| Page 2309
[image:3.595.54.272.164.258.2]2.5 Dynamometer:
It is used for measuring the force during the forming process. A load cell up to 1000 kg is used for measuring the force applied by the tool on sheet during forming. Dynamometer is directly connected with fixture which holds the sheet as shown in Fig -6.Fig – 6: Overview of Dynamometer
[image:3.595.53.268.365.448.2]2.6 Lubricants: In
this work, coolant, oil and grease are used as lubricants. WD-40 is used as oil and water- iscible fluid including soluble oil is used as coolant. Lubrication system used during ISF shown in fig - 7.Fig -7: Lubrication system used during ISF
2.7 Actual experiment:
Actual experiments were conducted by varying all the process parameters using orthogonal array to study their effects on forming results. The forming results are surface roughness, thickness reduction and force based failure. All the
resp onse s are mea sure d usin g diffe rent instr ume
[image:3.595.308.559.375.460.2]nts. The formed parts of actual experiments are shown in Fig-8
Fig -8: Picture representation of all eighteen experiments
2.8 Instrument Used:
Surface Roughness Tester:
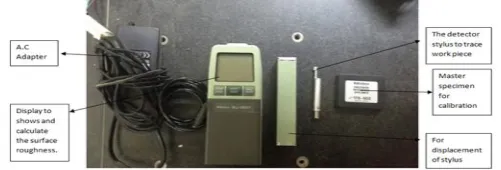
Instrument used in this work for measurement of surface Roughness is itutoyoSurftest 201P as shown in fig-9 The surftest SJ-201P (mitutoyo) is a shop–floor type surface-roughness measuring instrument, which traces the surface various machine parts and calculates the surface roughness based on roughness standards, and displays the results.Fig -9 MitutoyoSurftest SJ-201P (Surface Roughness Tester)
The work piece is attached to the detector unit of the SJ-201P will trace the minute irregularities of the work piece surface. The vertical stylus displacement during the trace is processed of the SJ-201P as shown in figure 10
Fig 10: SJ-201P surface roughness testing of formed part
3. Experimental Design Strategy
[image:3.595.32.277.502.695.2] [image:3.595.328.535.560.663.2]© 2017, IRJET | Impact Factor value: 5.181 | ISO 9001:2008 Certified Journal
| Page 2310
speed, feed rate and lubrication are considered andrepresented at different levels.
In the Taguchi method, the results of the experiments are analyzed to achieve one or more of the following objectives:
•To estimate the best or the optimum condition for a product or process.
•To estimate the contribution of individual parameters and interactions.
•To estimate the response under the optimum condition. The optimum condition is identified by studying the main effects of each of the parameters. The analysis of variance (ANOVA) is the statistical treatment most commonly applied to the results of the experiments in determining the percent contribution of each parameter against a stated level of confidence.
4. RESULT AND DISCUSSION
4.1 Experimental Results:
[image:4.595.29.556.414.784.2]Experiments of SPIF were performed on the basis of selected orthogonal arrays (L18) for studying the effect of parameters whose values are assigned in table 2. In the present work all the experimental results are obtained using Minitab 17 Statistical software.
Table 2: Taguchi L18 Orthogonal Arrays with response mean and S/N ratio
Tri al No. To ol pat h Tool Diame ter (mm) Sheet thickn ess (mm) Ste p Size (m m) Spind le Spee d (rpm ) Feed Rate (mm/ min) Lubr i-catio n Response (Raw data) S/N Rati o R1 R2 S/N(1
)
1. 1 1 1 1 1 1 1 - - -
2. 1 1 2 2 2 2 2 - - -
3. 1 1 3 3 3 3 3 - - -
4. 1 2 1 1 2 2 3 - - -
5. 1 2 2 2 3 3 1 - - -
6. 1 2 3 3 1 1 2 - - -
7. 1 3 1 2 1 3 2 - - -
8. 1 3 2 3 2 1 3 - - -
9. 2 3 3 1 3 2 1 - - -
10 2 1 1 3 3 2 2 - - -
11 2 1 2 1 1 3 3 - - -
12 2 1 3 2 2 1 1 - - -
13 2 2 1 2 3 1 3 - - -
14 2 2 2 3 1 2 1 - - -
15 2 2 3 1 2 3 2 - - -
16 2 3 1 3 2 3 1 - - -
17 2 3 2 1 3 1 2 - - -
18 2 3 3 2 1 2 3 - - -
R1 and R2 are repeated values of response. Where 1, 2 and 3 represent the values of 1st, 2nd and 3rd level for each factor respectively.
4.2 Analysis and discussion of result:
All the SPIF experiments are conducted using the parametric approach of Taguchi method to measure the effects of individual process parameters on the response. The mean and S/N ratio data for different level are calculated from experimental results and then the effects of process parameters for both mean and S/N ratio data are plotted. The response curves are used for examine the effect of parameters on the response characteristics. The analysis of variance (ANOVA) of mean and S/N ratio data is used to categorize the significant variable and to measure their effects on the response characteristics. The optimum value of process variables in terms of mean are established by analysing response curve and ANOVA table.
4.2.1 Effect on Surface Roughness:
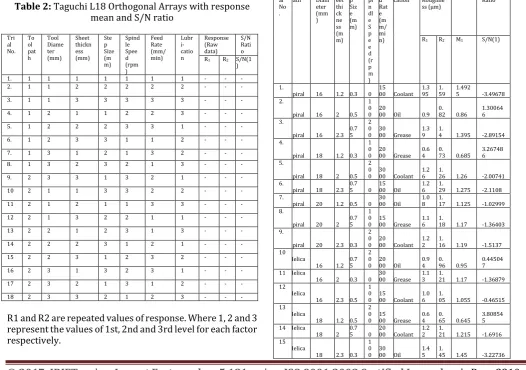
The effects of process parameters on Surface roughness of formed part is calculated by using mean and S/N ratio of each row where Surface roughness for each level of experiment is established in orthogonal array. Orthogonal array with mean and S/N ratio data is shown in table 3.
Table 3 Orthogonal array for result of Surface roughness with mean & S/N ratio data
Tri al No .
Tool path Tool Diam
eter (mm ) Sh eet thi ck ne ss (m m) Ste p Siz e (m m) S pi n dl e S p e e d (r p m ) Fee d Rat e (m m/ mi n)
Lubri-cation Surface Roughne ss (µm)
Mean S/N Ratio
R1 R2 M1 S/N(1)
1.
Spiral 16 1.2 0.3 0 1500 Coolant 1.395 1.59 1.4925 -3.49678 2.
Spiral 16 2 0.5 1 0
0 2000 Oil 0.9 0.82 0.86 1.300646 3.
Spiral 16 2.3 0.75 2 0
0 3000 Grease 1.39 1.4 1.395 -2.89154 4.
Spiral 18 1.2 0.3 1 0
0 2000 Grease 0.64 0.73 0.685 3.267486 5.
Spiral 18 2 0.5 2 0
0 3000 Coolant 1.26 1.26 1.26 -2.00741 6.
Spiral 18 2.3 0.75 0 1500 Oil 1.26 1.29 1.275 -2.1108 7.
Spiral 20 1.2 0.5 0 3000 Oil 1.08 1.17 1.125 -1.02999 8.
Spiral 20 2 0.75 1 0
0 1500 Grease 1.16 1.18 1.17 -1.36403 9.
Spiral 20 2.3 0.3 2 0
0 2000 Coolant 1.22 1.16 1.19 -1.5137 10
Helica
l 16 1.2 0.75 2 0
0 2000 Oil 0.94 0.96 0.95 0.445047 11 Helica
l 16 2 0.3 0 3000 Grease 1.13 1.21 1.17 -1.36879 12
Helica
l 16 2.3 0.5
1 0
0 1500 Coolant 1.06 1.05 1.055 -0.46515 13
Helica
l 18 1.2 0.5
2 0
0 1500 Grease 0.64 0.65 0.645 3.808545 14 Helica
l 18 2 0.75 0 2000 Coolant 1.22 1.21 1.215 -1.6916 15
Helica
l 18 2.3 0.3
1 0
© 2017, IRJET | Impact Factor value: 5.181 | ISO 9001:2008 Certified Journal
| Page 2311
16 Helica
l 20 1.2 0.75 1 0
0 3000 Coolant 0.72 0.67 0.695 3.154688 17
Helica
l 20 2 0.3
2 0
0 1500 Oil 0.75 0.74 0.745 2.556679 18 Helica
l 20 2.3 0.5 0 2000 Grease 2.38 2.31 2.345 -7.40382
Selection of optimal levels:
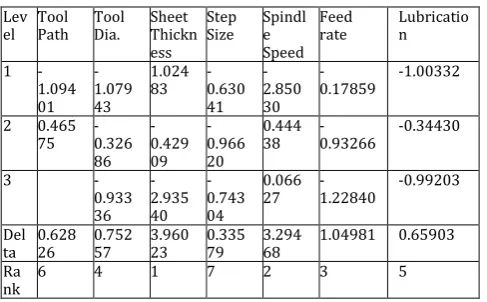
Effect of process parameters over surface roughness is calculated by using response tables. The response table 4 and 5 shows the average of each surface roughness characteristic of each level for every factor. Surface roughness “smaller is better” type quality characteristic. From chart-1 it found that second level of tool path (A2), second level of tool diameter (B2), first level of sheet thickness (C1), third level of step size (D3), second level of spindle speed (E2), first level of feed rate (F1) and second level of lubrication (G2) are optimum values. S/N ratio and Mean data of surface roughness for each corresponding level is shown in table 4 and 5.
Table 4 Response table for S/N ratio of Surface Roughness (Smaller is better)
Lev
el Tool Path Tool Dia. Sheet Thickn ess
Step Size Spindle
Speed Feed
rate Lubrication
1
-1.094 01
-1.079 43
1.024
83 -0.630
41 -2.850 30
-0.17859 -1.00332
2 0.465
75 -0.326
86 -0.429 09
-0.966 20
0.444
38 -0.93266 -0.34430
3
-0.933 36
-2.935 40
-0.743 04
0.066
27 -1.22840 -0.99203
Del
ta 0.62826 0.75257 3.96023 0.33579 3.29468 1.04981 0.65903 Ra
[image:5.595.310.562.278.423.2]nk 6 4 1 7 2 3 5
Table 5 Response table for Mean of Surface Roughness (Smaller is better)
Lev
el Tool Path Tool Diamet er
Sheet Thickne ss
Step Size Spindle
Speed Feed
rate Lubrication
1 1.161
4 1.1537 0.9321 1.1221 1.4371 1.0638 1.1513
2 1.141
1 1.0883 1.0700 1.2150 0.9858 1.2075 1.0675
3 1.2117 1.4517 1.116
7 1.0308 1.1825 1.2350 Delt
a 0.0203 0.1233 0.5196 0.0983 0.4512 0.1437 0.1675 Ran
k 7 5 1 6 2 4 3
Main effect plots for S/N ratio and Mean data are shown in chart 1 and 2 respectively, to predict the effect of process parameters for different levels on the surface roughness for same factor.
Manufacturing parameters
0 1 2 3 4
Surf
ace roughness
-4 -3 -2 -1 0 1 2
tool path tool diameter (mm) sheet thickness (mm) step size (mm) spindle speed (rpm) feed rate (mm/min) lubrication
Chart-1 Effect of plot for S/N ratio (for Surface roughness)
Manufacturing parameters
0 1 2 3 4
S
urf
ace
roughness
(um
)
0.9 1.0 1.1 1.2 1.3 1.4 1.5
tool path tool diameter (mm) sheet thickness (mm) step size (mm) spindle speed (mm) feed rate (mm) lubrication
Chart-2 Effect of plot for Mean (for Surface roughness)
Analysis of variance for Surface Roughness (SR):
[image:5.595.30.274.352.503.2]To study the significance of process parameters over Surface roughness analysis of variance (ANOVA) is performed in design of experiment. For 95% confidence level value of P should be less than 0.05. Therefore, from table it is clearly signified that all the process parameters affects the surface roughness. As Surface roughness “smaller is better” type quality characteristic. So, smaller value of surface roughness is considered as optimal. The raw data of ANOVA is given in table 6 using MINITAB17.
Table 6 Analysis of Variance for SR, using Adjusted SS (for Surface roughness)
Source DF Adj SS Adj MS F P
Tool Path 1 0.00370 0.003701 0.05 0.831
Tool Dia. 2 0.09138 0.045690 0.57 0.572
Sheet Thk. 2 1.73863 0.869315 10.92 0.001
Step Size 2 0.07333 0.036665 0.46 0.637
Spindle
Speed 2 1.48276 0.741381 9.31 0.001
Feed Rate 2 0.14156 0.070781 0.89 0.425
Lubrication 2 0.16834 0.084169 1.06 0.364
Error 22 1.75187 0.079630
Total 35 5.45157
© 2017, IRJET | Impact Factor value: 5.181 | ISO 9001:2008 Certified Journal
| Page 2312
Most influential factor for Surface roughness can be decidedusing rank. According to the ascending order of rank, value the most effective process parameter is sheet thickness followed by spindle speed, lubrication, feed rate, tool diameter, step size and tool path. Thus optimum values can easily find out for better surface roughness.
4.5.2 Effect on Thickness Reduction:
[image:6.595.309.557.95.137.2]In order to see the effect of process parameters on thickness reduction we used the orthogonal array as shown in table 7 with Mean and S/N ratio data.
Table 7 Orthogonal array for Thickness reduction with Mean and S/N ratio data
S. N. Tool
pat h Too l Dia. (m m) Sh eet thi ckn ess (m m) Ste p Siz e (m m) Spin dle Spee d (rpm ) Fee d Rat e (m m) Lub ricat ion Thickness Reduction (%/30mm )
Mean S/N Ratio
R1 R2 M1 S/N(1)
1. Spir
al 16 1.2 0.3 0 1500 Coolant 36.45 41.42 38.935 -31.824 5 2.
Spir
al 16 2 0.5 100 2000 Oil 51.85 51.12 51.485 -34.233 8 3.
Spir
al 16 2.3 0.75 200 3000 Grease 32.15 35.62 33.885 -30.611 5 4. Spir
al 18 1.2 0.3 100 2000 Grease 45.84 49 47.42 -33.524 5. Spir
al 18 2 0.5 200 3000 Coolant 28.01 29.88 28.945 -29.236 6.
Spir
al 18 2.3 0.75 0 1500 Oil 24.47 33.65 29.06 -29.372 9 7.
Spir
al 20 1.2 0.5 0 3000 Oil 39.81 46.45 43.13 -32.721 2 8.
Spir
al 20 2 0.75 100 1500 Grease 18.07 16.26 17.165 -24.704 9 9.
Spir
al 20 2.3 0.3 200 2000 Coolant 28.9 30.6 29.75 -29.473 3 1
0 Heli
cal 16 1.2 0.75 200 2000 Oil 46.07 47.72 46.895 -33.423 9 1
1 Heli
cal 16 2 0.3 0 3000 Grease 36.8 42.94 39.87 -32.038 6 1
2 Heli
cal 16 2.3 0.5 100 1500 Coolant 31.99 34.45 33.22 -30.433 9 1
3 Helical 18 1.2 0.5 200 1500 Grease 35.7 39.46 37.58 -31.51 1
4 Heli
cal 18 2 0.75 0 2000 Coolant 48.55 47.08 47.815 -33.592 3 1
5 Heli
cal 18 2.3 0.3 100 3000 Oil 45 48.11 46.555 -33.364 2 1
6 Heli
cal 20 1.2 0.75 100 3000 Coolant 43.61 40.26 41.935 -32.458 5 1
7 Helical 20 2 0.3 200 1500 Oil 17.31 14.83 16.07 -24.146
1 1
8 Heli
cal 20 2.3 0.5 0 2000 Grease 42.23 40.6 41.415 -32.344 8
Selection of optimal levels:
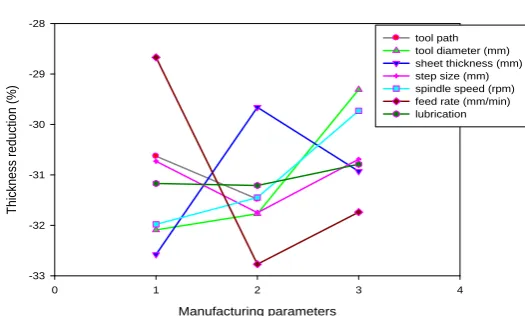
Using the response table 8 and 9, selection of optimum parameters has been made and the effect of process parameters over thickness reduction is calculated. Thickness reduction is also a “smaller is better” type quality characteristic. Therefore, from figure 4.4 it is found that first level of tool path (A1), third level of tool diameter (B3), second level of sheet thickness (C2), third level of step size (D3), third level of spindle speed (E3), first level of feed rate (F1) and third level of lubrication (G3) are optimum values. Table 8 and 9 shows the S/N ratio and Mean data of thickness reduction for each corresponding level.
Table 8 Response table for S/N ratio of Thickness reduction (Smaller is better)
Le
vel Tool Path Tool Dia. Sheet Thickne ss
Step Size Spindle
Speed Fee d rate Lubric ation
1
-30.6 3
-32.09 -32.58
-30.7 3
31.98 -28.6 7
-31.17
2
-31.4 8
-31.77 -29.66
-31.7 5
31.45 -32.7 7
-31.21
3 -29.31 -30.93
-30.6 9
29.73 -31.7 4
-30.79
Delt
a 0.85 2.79 2.92 1.05 2.25 4.10 0.42
Rank 6 3 2 5 4 1 7
Table 9 Response table for Mean of Thickness reduction (Smaller is better)
Lev
el Tool Path Tool Diamet er
Sheet Thickne ss
Step Size Spindle
Speed Feed
rate Lubrication
1 35.5
3 40.71 42.65 36.43 40.04 28.67 36.77
2 39.0
4 39.56 33.56 39.30 39.63 44.13 38.87
3 31.58 35.65 36.1
3 32.19 39.05 36.22
Delt
a 3.51 9.14 9.09 3.17 7.85 15.46 2.64
Ran
k 5 2 3 6 4 1 7
© 2017, IRJET | Impact Factor value: 5.181 | ISO 9001:2008 Certified Journal
| Page 2313
Manufacturing parameters
0 1 2 3 4
Thi ckness reducti on (%) -33 -32 -31 -30 -29 -28 tool path tool diameter (mm) sheet thickness (mm) step size (mm) spindle speed (rpm) feed rate (mm/min) lubrication
Chart -3 Effect of plot for S/N ratio (for thickness reduction)
Manufacturing parameters
0 1 2 3 4
Thick ness reduc tion (%) 26 28 30 32 34 36 38 40 42 44 46 tool path tool diameter (mm) sheet thickness (mm) step size (mm) spindle speed (rpm) feed rate (mm/min) lubrication
Chart -4 Effect of plot for Mean (for Thickness reduction)
Analysis of variance for Thickness Reduction (TR):
[image:7.595.36.299.107.265.2]From table 10, it is clearly signified that all the process parameters affects the thickness reduction because for 95% confidence level value of P should be less than 0.05. Thickness reduction “lower is better” type quality characteristic. So, smaller value of thickness reduction is considered as optimal.
Table 10 Analysis of Variance for TR, using Adjusted SS (for Thickness reduction)
Source DF Adj SS Adj MS F P
Tool Path 1 110.81 110.811 7.71 0.011
Tool Dia. 2 594.33 297.165 20.66 0.000
Sheet Thk. 2 544.12 272.062 18.92 0.000
Step Size 2 73.35 36.675 2.55 0.101
Spindle
Speed 2 468.72 234.359 16.30 0.000
Feed Rate 2 1490.05 745.023 51.81 0.000
Lubrication 2 46.76 23.380 1.63 0.220
Error 22 31.638 1.4381
Total 35 3644.51
S = 3.79219, sq = 91.32%, sq(adj)= 86.19%& R-sq(pred)= 76.76%
According to ascending order of rank value the most effective process parameter is lower value of rank. Therefore, most effective parameter in case of thickness reduction is feed rate followed by tool diameter, sheet thickness, spindle speed, tool path, step size and lubrication. Thus optimum values can easily find out for better thickness reduction.
4.5.3 Effect on forming Force:
[image:7.595.38.289.313.466.2]To predict the effect of process parameters on forming force using Mean and S/N ratio data. Mean and S/N ratio data of forming force with its orthogonal array is shown in table 11.
Table 11 Orthogonal array for forming Force with Mean and S/N ratio data
Tr ial N o. Tool pat h Too l Dia (m m) Sh eet thi ck n-ess (m m) Ste p Siz e (m m) Spi ndl e Sp ee d (rp m) Feed Rate (m m/ min ) Lubri-cation Forming
Forc e(N)
Mean S/N Ratio
R1 M1 S1
1 Spir
al 16 1.2 0.3 0 1500 Coolant 1751.26 1751.26 -64.8 67 2
Spir
al 16 2 0.5 100 2000 Oil 2058 2058
-66.2 689 3
Spir
al 16 2.3 0.75 200 3000 Grease 6007.4 6007.4 -75.5 737 4
Spir
al 18 1.2 0.3 100 2000 Grease 1127 1127
-61.0 385 5
Spir
al 18 2 0.5 200 3000 Coolant 5439 5439
-74.7 104 6
Spir
al 18 2.3 0.75 0 1500 Oil 7203 7203
-77.1 503 7
Spir
al 20 1.2 0.5 0 3000 Oil 1244.6 1244.6
-61.9 006 8.
Spir
al 20 2 0.75 100 1500 Grease 5262.6 5262.6 -74.4 24 9.
Spir
al 20 2.3 0.3 200 2000 Coolant 7350 7350 -77.3 257 10
Heli
cal 16 1.2 0.75 200 2000 Oil 1156.4 1156.4 -61.2 622 11
Heli
cal 16 2 0.3 0 3000 Grease 4057.2 4057.2 -72.1 645 12
Heli
cal 16 2.3 0.5 100 1500 Coolant 5635 5635 -75.0 179 13
Heli
cal 18 1.2 0.5 200 1500 Grease 1185.8 1185.8 -61.4 802 14 Heli
© 2017, IRJET | Impact Factor value: 5.181 | ISO 9001:2008 Certified Journal
| Page 2314
512 15
Heli
cal 18 2.3 0.3 100 3000 Oil 6076 6076
-75.6 724 16
Heli
cal 20 1.2 0.75 100 3000 Coolant 1342.6 1342.6 -62.5 589 17
Heli
cal 20 2 0.3 200 1500 Oil 5450.6 5450.6 -75.3 44 18
Heli
cal 20 2.3 0.5 0 2000 Grease 6310 6310
-76.0 828
Selection of optimal levels:
[image:8.595.297.559.55.231.2]Selection of optimum parameters and the effect of process parameters over forming force are calculated by using response table 12 and 13. As the forming force “smaller is better” type quality characteristic, it is found that second level of tool path (A2), first level of tool diameter (B1), first level of sheet thickness (C1), second level of step size (D2), second level of spindle speed (E2), second level of feed rate (F2) and second level of lubrication (G2) are optimum values of forming force to minimize the forming force during manufacturing process.
Table 12 Response table for S/N ratio of forming Force (Smaller is better)
Leve
l Tool Path Tool Diamete r
Sheet Thicknes s
Ste p Size
Spindl e Speed
Feed
rate Lubrication
1
-70.3 6
-69.19 -62.18
-71.0 7
-69.75 -71.3 8
-70.14
2
-69.5 5
-69.40 -71.54
-69.2 4
-69.16 -68.0 5
-69.60
3 -71.27 -76.14
-69.5 5
-70.95 -70.4 3
-70.13
Delt
a 0.81 2.08 13.95 1.83 1.79 3.33 0.54
Ran
k 6 3 1 4 5 2 7
Table 13 Response table for S/N ratio of forming Force (Smaller is better)
Leve
l Tool Path Tool Diamet er
Sheet Thickne ss
Step Size Spindle
Speed Fee d rate
Lubricatio n
1 416
0 3444 1301 4369 3784 4481 3933
2 375
0 3851 4124 3655 3584 3357 3931
3 4570 6440 384
2 4498 4028 4002
Delt
a 410 1126 5139 713 915 1125 70
Ran
k 6 2 1 5 4 3 7
Main effect plot for S/N ratio and Mean data are shown in chart 5 and 6 respectively.
Manufacturing parameters
0 1 2 3 4
for
ming Forc
e (N
)
-78 -76 -74 -72 -70 -68 -66 -64 -62 -60
tool path tool diameter (mm) sheet thickness (mm) step size (mm) spindle speed (rpm) feed rate (mm/min) lubrication
Chart -5 Main effect plot for S/N ratio (forming Force)
Manufacturing parameters
0 1 2 3 4
forming
Forc
e
(N
)
1000 2000 3000 4000 5000 6000 7000
tool path tool diameter (mm) sheet thickness (mm) step size (mm) spindle speed (rpm) feed rate (mm/min) lubrication
Chart -6 Main effect plot for Mean (forming Force)
5. CONCLUSIONS
1. Sheet thickness is most influential process parameter on surface roughness followed by spindle speed and lubrication where feed rate, tool diameter, step size and tool path have little influence over surface roughness. The optimal experimental condition are determined as tool path (helical), tool diameter (18mm), sheet thickness (1.2mm), step size
(0.75mm), spindle speed (100rpm), feed rate
(1500mm/min) and lubrication (oil) with minimum surface roughness (0.64µm), which is efficiently confirmed by validation experiment.
2. Feed rate is highly influential factors in case of thickness reduction followed by tool diameter, sheet thickness, spindle speed but tool path, step size and lubrication have little influence on thickness reduction. The optimal experimental condition for thickness reduction are determined as tool path (spiral), tool diameter (20mm), sheet thickness (2mm), step size (0.75mm), spindle speed (200rpm), feed rate (1500mm/min) and lubrication (grease) with minimum thickness reduction (14.83%).
[image:8.595.315.555.286.403.2]© 2017, IRJET | Impact Factor value: 5.181 | ISO 9001:2008 Certified Journal
| Page 2315
4. Al-2014 is high strength and hardness alloy, hence largeamount of forming force (7350 N) is calculated during ISF, which cause of abrupt failure in case of thick sheet. So, it is estimated that low hardness and thin sheet have good formability for ISF.
5. For overall performance including surface quality, thickness distribution and forming force, sheet thickness is most influential process parameter in ISF and for better quality product it should be used between 1.2mm to 2mm.
REFERENCES
[1] G. Fan, L. Gao, G. Hussain, & Z. Wu (2008). “Electric hot incremental forming: A novel technique.” International Journal of Machine Tools and Manufacture, 48(15), 1688–1692.
[2] J. R. Duflou, B. Callebaut, J. Verbert, & H. De Baerdemaeker (2007). “Laser Assisted Incremental Forming: Formability and Accuracy Improvement.” Annals - Manufacturing Technology, 56(1), 273–276.
[3] F. Micari, G. Ambrogio, & L. Filice (2007). “Shape and
dimensional accuracy in Single Point Incremental Forming: State of the art and future trends.” Journal of Materials Processing Technology, 191(1-3), 390–395.
[4] Young and J. Jeswiet 2004. “Wall thickness variations in
single-point incremental forming. J. Eng. Manufact.” Part B 218, 1453–1459.
[5] G. Ambrogio, 2005. “Sheet thinning prediction in single
point incremental forming.” 05 International Conference on Sheet Metal, Germany, pp. 479–486.
[6] J. Kopac (2005), “Incremental sheet metal forming on
CNC milling machine-tool.” Journal of material processing technology 162-163 (2005) 622-628 [7] Cerro, E. Maidagan, J. Arana, A. Rivero & P. P. Rodríguez,
![Fig -1: Principle of Incremental Sheet Forming [1]](https://thumb-us.123doks.com/thumbv2/123dok_us/8157348.804541/1.595.335.542.601.732/fig-principle-incremental-sheet-forming.webp)