Nasal neuron PET imaging quantifies neuron
generation and degeneration
Genevieve C. Van de Bittner, … , Mark W. Albers, Jacob M.
Hooker
J Clin Invest.
2017;
127(2)
:681-694.
https://doi.org/10.1172/JCI89162
.
Olfactory dysfunction is broadly associated with neurodevelopmental and
neurodegenerative diseases and predicts increased mortality rates in healthy individuals.
Conventional measurements of olfactory health assess odor processing pathways within
the brain and provide a limited understanding of primary odor detection. Quantification of the
olfactory sensory neurons (OSNs), which detect odors within the nasal cavity, would provide
insight into the etiology of olfactory dysfunction associated with disease and mortality.
Notably, OSNs are continually replenished by adult neurogenesis in mammals, including
humans, so OSN measurements are primed to provide specialized insights into
neurological disease. Here, we have evaluated a PET radiotracer, [
11C]GV1-57, that
specifically binds mature OSNs and quantifies the mature OSN population in vivo.
[
11C]GV1-57 monitored native OSN population dynamics in rodents, detecting OSN
generation during postnatal development and aging-associated neurodegeneration.
[
11C]GV1-57 additionally measured rates of neuron regeneration after acute injury and
early-stage OSN deficits in a rodent tauopathy model of neurodegenerative disease.
Preliminary assessment in nonhuman primates suggested maintained uptake and saturable
binding of [
18F]GV1-57 in primate nasal epithelium, supporting its translational potential.
Future applications for GV1-57 include monitoring additional diseases or conditions
associated with olfactory dysregulation, including cognitive decline, as well as monitoring
effects of neuroregenerative or neuroprotective therapeutics.
Research Article
Aging
Neuroscience
Find the latest version:
Introduction
Olfactory function may serve as a general marker of brain health. In neurodevelopmental disease, patients with intellectual disabil-ity, e.g., Down syndrome and idiopathic intellectual disabildisabil-ity, or later-onset neurodevelopmental disorders, e.g., schizophrenia, show marked olfactory dysfunction (1–4). In the healthy aging population, olfactory dysfunction is correlated with cognitive decline (5, 6). Olfactory dysfunction is also a sign of neurodegen-erative diseases, including the 2 most prevalent, Alzheimer’s dis-ease (AD) and Parkinson’s disdis-ease (PD), as well as amyotrophic lateral sclerosis and Huntington’s disease (7, 8). In many AD and PD patients, hyposmia or anosmia, a partial or complete loss of the sense of smell, is detectable prior to cognitive decline in AD or motor dysfunction in PD (4, 9–13). Pilot studies have shown a
high sensitivity for olfaction tests to predict conversion from mild cognitive impairment to AD (14, 15) with higher specificity than hippocampal volume measurements. Even after controlling for dementia, a recent study reveals that olfactory dysfunction in old-er adults predicts an increased mortality rate (16). Additionally, the increased mortality rates for adults with anosmia have been found to surpass the rates for adults with cancer or heart failure (17), with mortality consistently correlating with the severity of smell loss (16–18). Together, these studies indicate that olfactory health may be a broad marker for nervous system health.
The olfactory function measurement provided by smell identi-fication tests used in the above-cited studies offers an incomplete picture of olfactory health. These functional odor identification tests survey higher-level olfactory processing, as opposed to the primary-level odor detection mediated by the olfactory sensory neurons (OSNs) within the superior nasal cavity. Biopsies of the OSN-containing nasal epithelium reveal loss of OSN density in patients with neurodevelopmental disease (Rett syndrome) as well as neurodegenerative disease (Alzheimer’s disease) (19, 20), suggesting that disease-related olfactory dysfunction extends to the primary olfactory pathway. In fact, the OSNs may be particu-larly vulnerable to neurological disease, since they are refreshed continually by adult neurogenesis in mammals, including humans (21–23). This property renders the OSNs a dynamic neuron popu-lation whose total neuron count is continuously dependent on the balance of neuron generation and neuron death, processes that
Olfactory dysfunction is broadly associated with neurodevelopmental and neurodegenerative diseases and predicts increased mortality rates in healthy individuals. Conventional measurements of olfactory health assess odor processing pathways within the brain and provide a limited understanding of primary odor detection. Quantification of the olfactory sensory neurons (OSNs), which detect odors within the nasal cavity, would provide insight into the etiology of olfactory dysfunction associated with disease and mortality. Notably, OSNs are continually replenished by adult neurogenesis in mammals, including humans, so OSN measurements are primed to provide specialized insights into neurological disease. Here, we have evaluated a PET radiotracer, [11C]GV1-57, that specifically binds mature OSNs and quantifies the mature OSN population in vivo. [11C]GV1-57 monitored native OSN population dynamics in rodents, detecting OSN generation during postnatal development and aging-associated neurodegeneration. [11C]GV1-57 additionally measured rates of neuron regeneration after acute injury and early-stage OSN deficits in a rodent tauopathy model of neurodegenerative disease. Preliminary assessment in nonhuman primates suggested maintained uptake and saturable binding of [18F]GV1-57 in primate nasal epithelium, supporting its translational potential. Future applications for GV1-57 include monitoring additional diseases or conditions associated with olfactory dysregulation, including cognitive decline, as well as monitoring effects of neuroregenerative or neuroprotective therapeutics.
Nasal neuron PET imaging quantifies neuron
generation and degeneration
Genevieve C. Van de Bittner,1 Misha M. Riley,1 Luxiang Cao,2 Janina Ehses,1 Scott P. Herrick,2 Emily L. Ricq,1,3 Hsiao-Ying Wey,1
Michael J. O’Neill,4 Zeshan Ahmed,4 Tracey K. Murray,4 Jaclyn E. Smith,1 Changning Wang,1 Frederick A. Schroeder,1
Mark W. Albers,2 and Jacob M. Hooker1
1Athinoula A. Martinos Center for Biomedical Imaging, Department of Radiology, and 2Department of Neurology, Massachusetts General Hospital, Harvard Medical School, Charlestown, Massachusetts, USA. 3Department of Chemistry and Chemical Biology, Harvard University, Cambridge, Massachusetts, USA. 4Eli Lilly and Co. Ltd., Lilly Research Centre, Erl Wood Manor, Windlesham, Surrey, United Kingdom.
Related Commentary: p. 447
Conflict of interest: G.C. Van de Bittner and J.M. Hooker are inventors on a patent application related to this work (Radiolabeled compounds for imaging – PCT/ US2015/040971). M.J. O’Neill, Z. Ahmed, and T.K. Murray receive a salary for their work at Eli Lilly and Co. Ltd.
License: This work is licensed under the Creative Commons Attribution 4.0 Inter-national License. To view a copy of this license, visit http://creativecommons.org/ licenses/by/4.0/.
Submitted: June 21, 2016; Accepted: December 1, 2016.
ogy setting, indicating a high reliability for grouping WT and tauop-athy animals. Additionally, preliminary application to nonhuman primates (NHPs) suggests that the GV1-57 radiotracer maintains good uptake and saturable binding in the primate nasal epithelium. Taken together, these results indicate that GV1-57 is a quantitative tool for measurement of the OSN population that provides insight into fluctuations in OSN population resulting from normative devel-opment, acute injury, neuron recovery, aging, and disease.
Results
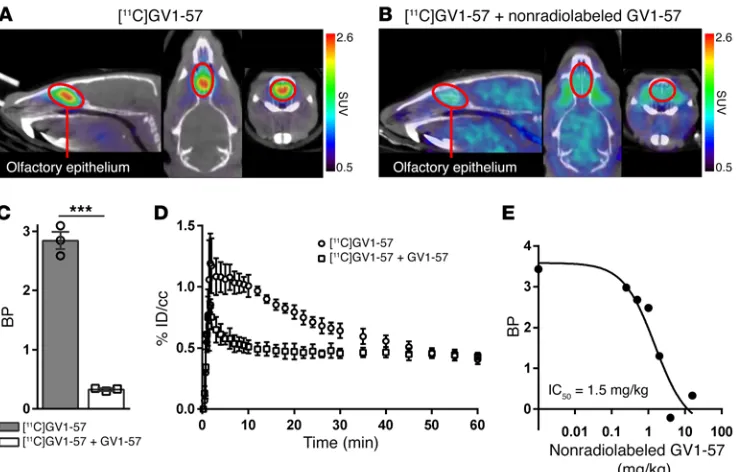
Specific, saturable uptake of [11C]GV1-57 in the olfactory epithelium. [11C]GV1-57 contains a purinergic core minimally substituted with
benzylamine, fluorine, and an isotopically interchangeable meth-yl group (Supplemental Figure 1; supplemental material available online with this article; https://doi.org/10.1172/JCI89162DS1). Although purinergic scaffolds are considered promiscuous because of their structural similarity to ATP, [11C]GV1-57
unique-ly localizes to the olfactory epithelium (OE), as demonstrated by standardized uptake value (SUV) images in rodents (Figure 1A). [11C]GV1-57 demonstrates saturable binding with its specific
bio-logical target(s), as evaluated by pretreatment with the nonradio-labeled GV1-57, which is reflected as an 89% reduction in binding via Logan analysis (Figure 1, B and C). Logan analysis was com-pleted using the brain as the reference region. The result is a linear
Logan plot for [11C]GV1-57 injected alone or following treatment
with nonradiolabeled GV1-57 (Supplemental Figure 2). Function-al and binding inhibition assays of nonradiolabeled GV1-57 with adenosine-utilizing enzymes, including a panel of 365 kinases, 4 adenosine receptors, and 5 purinergic receptors, have ruled out binding to common purinergic binders (Supplemental Tables 1 and 2; Supplemental Figures 3 and 4; and ref. 30); additional target identification experiments are under way.
[11C]GV1-57 time-activity curve analysis from scans
complet-ed in the presence or absence of nonradiolabelcomplet-ed GV1-57 reveals relatively fast pharmacokinetics with specific target engagement between approximately 3 and 45 minutes and a nonsaturable
com-ponent throughout the scan interval (Figure 1D). The in vivo IC50
(1.5 mg/kg) for [11C]GV1-57 was measured by cotreatment with
increasing masses (0.25–4 mg/kg) of nonradiolabeled GV1-57 (Figure 1E). Accounting for the percentage uptake of [11C]GV1-57
in the OE (~1% injected dose per cubic centimeter; Figure 1D)
results in an approximate in vivo OE IC50 value of 20 μM. This
volumetric measurement does not account for the bones and air pockets surrounding the OE tissue and thus overestimates the in vivo IC50. Ex vivo autoradiography analysis suggests tighter bind-ing with an IC50 of 0.33 μM (Supplemental Figure 5). Together, the initial characterizations of [11C]GV1-57 reveal its high, OE-specific
uptake, suitable pharmacokinetic properties, and self-saturability, a quality necessary for PET measurement of receptor occupancy, protein density, or cellular population (31).
[11C]GV1-57 uptake is associated with the mature OSN
popu-lation. To identify the cellular localization of [11C]GV1-57
with-in the OE, we used a standard surgical rodent model for mature OSN-specific removal, olfactory bulbectomy (32, 33). This proce-dure cuts the mature OSN axons posterior to the cribriform plate, a partition that isolates the OE and mature OSN cell bodies from direct surgical or inflammatory damage. The mature OSNs with are altered in neurological disease (24, 25). Direct quantification
of OSNs would provide a measurement of olfactory health that is complementary to functional odor identification tests and would potentially provide an opportunity to monitor improved neural health through measurement of OSN regeneration.
For the measurement and quantification of OSNs, a noninva-sive, whole-tissue analysis method would offer benefits over exist-ing OSN analysis methods. The conventional histological analy-sis of nasal biopsies has revealed OSN losses in disease (19, 20); however, nasal biopsies are limited by their invasiveness, techni-cal difficulty, and a significant sampling bias. Indeed, respiratory epithelial cells are often obtained instead of OSNs. Alternatively, noninvasive imaging techniques offer methods to assess the struc-tural integrity and functional status of the olfactory neural system. Functional MRI (fMRI) studies have been used to assess chang-es in olfactory-related procchang-essing centers in AD patients (26–29). However, the OSNs provide a unique challenge to MRI techniques, particularly fMRI, due to the tissue thinness of the nasal epitheli-um and the surrounding air pockets. Noninvasive PET imaging of the OSNs using a radiotracer with high biological target specificity could surpass the limitations of both fMRI and nasal biopsies by providing a quantitative whole-tissue analysis.
To meet this need, we present a novel PET radiotracer,
[11C]GV1-57, which enables objective, global measurement of the
mature OSN population as well as alterations of OSN population
through longitudinal imaging. [11C]GV1-57 was discovered during
exploration of the structure-uptake relationships of several
purine-based radiotracers. Unique to [11C]GV1-57 were a
remark-ably high signal-to-background and saturable binding within the nasal cavity. Determination of the cellular target of [11C]GV1-57,
mature OSNs, was achieved by imaging targeted mature OSN death resulting from olfactory bulbectomy. Following this in vivo
characterization, [11C]GV1-57 was applied to monitoring the OSN
population across lifespan, which revealed an increasing OSN population to middle age, followed by OSN losses during aging. These data verify sensitivity to OSN population flux, the time- dependent change in the level of a neuron population. Assess-ment of OSN population fluctuations in individual animals during developmental periods indicated differences in individual rates of OSN influx, pointing to innate differences in OSN generation and degeneration rates.
In addition to monitoring normative alterations in OSN popu-lation, [11C]GV1-57 was applied to models of neuroregeneration and
neurodegeneration. Following acute injury, longitudinal [11C]GV1-57
imaging uncovered increased rates of OSN influx that vary across individuals. This indicates that acute injury tunes OSN generation and death rates, which combine to regulate the mature OSN popu-lation, on an individual-dependent basis. To assess OSN popula-tion in a neurodegenerative disease that impacts olfactory funcpopula-tion, [11C]GV1-57 was used in the rTg4510 tauopathy model of
frontotem-poral dementia/AD. In these animals, [11C]GV1-57 detected an OSN
population deficit during the period of behavioral symptom onset, suggesting that the OSN population is impacted at early stages of neurodegenerative disease and OSN loss may contribute to the olfactory dysfunction measured early in AD progression.
radiol-one provided by [11C]GV1-57
imaging, necessarily averages the mature OSN reductions over the whole tissue.
An assessment of the aver-age mature OSN reduction in whole-tissue OE lysate follow-ing anterior bulbectomy was accomplished through Western immunoblotting. This analy-sis confirmed reduction of the mature OSN population, as assessed by probing for OMP (Figure 2E) (34). Comparison of the distribution volume ratio (DVR), a measure of [11C]GV1-57
binding, and OMP in individual mice across treatments indicates a significant correlation (Spear-man, r = 0.89, P = 0.033; Figure 2F) between the 2 whole-tissue analysis methods, indicating that
[11C]GV1-57 reliably reports on
the mature OSN population. Specific markers of other major OE cell types, immature OSNs (growth-associated pro-tein 43, GAP43) and sustentacu-lar cells (receptor accessory pro-tein 6, REEP6) (Supplemental Figure 6 and refs. 35, 36), did not show a significant postbulbecto-my correlation with [11C]GV1-57
binding by immunoblotting (Supplemental Figure 7), further sup-porting the association of [11C]GV1-57 with mature OSNs. In
addi-tion to confirming the [11C]GV1-57 cellular target, the bulbectomy
model provides 1 mechanism for [11C]GV1-57 imaging of brain
health — measurement of OSN loss resulting from CNS damage.
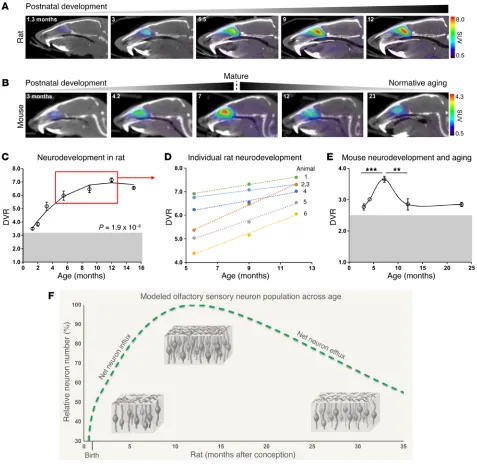
Fluctuations in mature OSN population during postnatal devel-opment and aging. To assess the sensitivity of [11C]GV1-57 to the
natural, longitudinal dynamics of the mature OSN population,
we performed [11C]GV1-57 imaging at ages spanning normative
neurodevelopment and aging-associated neurodegeneration. We imaged rats at 7 ages spanning 1.3 and 15 months (Figure 3A) and mice at 5 ages spanning 3 and 23 months (Figure 3B). A con-stant volume of interest (VOI) was used during image analysis to quantify OSN population, specifically OSN density within this region, across age. Between 1.3 and 15 months of age, we observed
a statistically significant (P = 1.9 × 10⁻⁸) influence of age on
[11C]GV1-57 binding in the rat OE with an apex, i.e., OSN
popula-tion maximum, around 12 months of age (Figure 3C). Age-depen-dent imaging results were compared with OE cellular populations using extracts of dissected septal tissue from 2-, 3-, and 9-month-old rats. The OE tissue lysates were immunoblotted for specific markers of mature OSNs (olfactory marker protein, OMP), imma-ture OSNs (GAP43), and sustentacular cells (REEP6); a discussion of these data can be found in Supplemental Figure 8.
severed axons are selectively and robustly reduced 2–3 days after bulbectomy (32). To accomplish a graded mature OSN reduction, we completed unilateral and bilateral anterior bulbectomies.
[11C]GV1-57 imaging 2–3 days after anterior bulbectomy resulted
in a 15% decrease in average [11C]GV1-57 binding potential after
unilateral bulbectomy and a 37% decrease [1-way ANOVA, F(2, 9) = 8.808, P < 0.01; post hoc 1-tailed t test, P < 0.005] follow-ing bilateral bulbectomy (Figure 2, A and B), indicatfollow-ing specific-ity for [11C]GV1-57 uptake within mature OSNs and sensitivity of
[11C]GV1-57 to graded alterations in the mature OSN population.
The specificity of the anterior bulbectomy for mature OSN reduction was confirmed via cell counting of OE tissue sections immunostained for the mature OSN-specific olfactory marker protein (OMP) and the nucleus-specific DAPI (34). The OE from a unilaterally treated animal demonstrated markedly reduced OMP+ cell counts (P < 0.005) and stable OMP– cell counts
follow-ing bulbectomy (Figure 2, C and D), indicatfollow-ing selective loss of mature OSNs ipsilateral to the anterior bulbectomy. Cell count-ing was performed in a region prominently impacted by the bul-bectomy to validate the specificity of the model for mature OSN reduction in an area with severe tissue loss. Notably, different regions throughout the OE show lesser or greater loss of mature OSNs (L. Cao, S.P. Herrick, M.W. Albers, unpublished observa-tions). A whole-tissue measurement of OSN population, like the
Figure 1. [11C]GV1-57 localizes to the OE and exhibits saturable binding. (A) Representative coregistered CT and
[11C]GV1-57 PET images (SUV, NIH+white, 3–45 minutes) following treatment with [11C]GV1-57 (0.97 ± 0.097 mCi
per animal). [11C]GV1-57 uptake is specific to the OE, which is circled in red in sagittal, transverse, and coronal
views (left to right). (B) Representative [11C]GV1-57 PET images (SUV, NIH+white, 3–45 minutes) following
pre-treatment with nonradiolabeled GV1-57 (i.v., 16 mg/kg) 5 minutes prior to administration of [11C]GV1-57 (0.89 ±
0.032 mCi per animal). (C) Binding potential (BP) quantification of [11C]GV1-57 uptake in the OE of rats treated as
described in A and B. BP was determined using a Logan analysis (Supplemental Figure 2). Error bars are ± SEM; n = 3 per group. ***P < 0.005 using a 2-tailed Student’s t test. (D) Averaged time-activity curves from rats treated as described in A and B. Error bars are ± SEM; n = 3 per group. %ID/cc, percent injected dose per cubic centimeter. (E) In vivo IC50 curve for [11C]GV1-57 (IC50 = 1.5 mg/kg, ~20 μM); rats coadministered with [11C]GV1-57 (0.52 ± 0.025
mCi) and increasing doses of nonradiolabeled GV1-57 (i.v., 0–4 mg/kg). Graph includes the [11C]GV1-57 BP obtained
[image:4.585.45.417.55.291.2]rates relative to neuron death rates when compared with animals starting with a higher mature OSN population.
The quantified [11C]GV1-57 signal was highly consistent in
mice (Figure 3E), with increased binding during postnatal devel-opment into adulthood and a mature OSN population maximum
around 7 months of age. Hereafter, reduced [11C]GV1-57 uptake
is detected, validating [11C]GV1-57 sensitivity to
aging-associat-ed OSN neurodegeneration at relatively young ages and
support-ing the application of [11C]GV1-57 to neurodegenerative disease.
Combined, the mouse and rat life-spanning imaging data support a mature OSN population model wherein total OSN numbers change across lifespan, resulting in a lifelong dynamic neuron population (Figure 3F). This mature OSN population model
devel-oped from the [11C]GV1-57 imaging data agrees well with existing
articles, which combined suggest that there are an increasing OE tissue size and OSN density from birth into adulthood, followed by net OSN losses during aging (37–39). Thus, the unique power of noninvasive imaging has enabled a basic understanding of the Analysis of individual animals from 5.5 months to 12 months
of age highlights individual rates of increased [11C]GV1-57
bind-ing durbind-ing postnatal development (Figure 3D). Here, the increase
in [11C]GV1-57 signal signifies a net increase in the mature OSN
population, which results from a net addition of neurons to the tissue, or net neuron influx. The rate of increase in [11C]GV1-57
binding, or rate of net mature OSN influx, varies across individ-ual animals with a range of 0.084–0.30 DVR per month (Figure 3D and Supplemental Table 3). The individual variation in influx rates suggests that [11C]GV1-57 is monitoring individual
physiolog-ical differences in OSN neurodevelopment rates, which represent a combination of neurogenesis, neuron maturation, and neuron death rates. Between 5.5 and 12 months of age, individuals starting with a DVR less than 5.5 exhibited a 2.4-fold higher mature OSN population growth rate (P < 0.005) compared with animals ing with a DVR greater than 6.0. This indicates that animals start-ing with a lower level of OSNs at specific developmental ages have subsequently increased neurogenesis and/or neuron maturation
Figure 2. [11C]GV1-57 binds mature OSNs. (A)
Representative [11C]GV1-57 PET images (SUV,
NIH+white, 3–45 minutes) of 3-month-old mice imaged with no treatment (control) or 2–3 days after unilateral or bilateral anterior bulbectomy. (B) DVR quantification of [11C]GV1-57 uptake in control and
bulbectomy-treated mice. Error bars are ± SEM; n = 3–6 per group. One-way ANOVA, F(2, 9) = 8.808, P < 0.01, followed by a 1-tailed Student’s t test, ***P < 0.005. (C and D)Coronal OE sections from a mouse that underwent unilateral anterior bulbec-tomy and [11C]GV1-57 imaging were immunostained
with anti-OMP and stained with DAPI to provide total and OMP+ nuclei counts. OE regions with the
greatest damage on the bulbectomy side were paired with the contralateral sham side, and both were counted. (C) OMP+ nuclei were significantly
reduced following anterior bulbectomy, and OMP–
nuclei numbers were not significantly altered. Error bars are ± SEM; n = 3 tissue sections. ***P < 0.005 using a 2-tailed Student’s t test. NS, P = 0.34 using a 2-tailed Student’s t test. (D) Representative image of an immunostained OE section. White boxes indicate regions used for cell counting. (E) Western immunoblot of the mature OSN population (OMP) in control and bulbectomy-treated mice, using OE tissue from animals imaged with [11C]GV1-57. For
this and the following immunoblot analyses, protein marker intensities relative to total protein loaded were used, since the goal was to analyze changes in relative cellular populations, as opposed to alter-ations in protein expression. n = 2 per group. (F) Significant correlation between [11C]GV1-57
[image:5.585.34.354.55.501.2]Figure 3. [11C]GV1-57 imaging of the mature OSN population during normative development and aging. (A) Representative [11C]GV1-57 PET images (SUV,
NIH+white, 3–45 minutes) of male rats administered [11C]GV1-57 (0.93 ± 0.14 mCi) at select ages during postnatal olfactory neurodevelopment and into the
OE developmental plateau. Images selected from 7 ages between 1.3 and 15 months old (C). (B) Representative [11C]GV1-57 PET images (SUV, NIH+white,
3–45 minutes) of female mice administered [11C]GV1-57 (0.54 ± 0.11 mCi) at select ages during postnatal olfactory neurodevelopment, maturation, and
aging. (C) DVR quantification of [11C]GV1-57 uptake in rats imaged across OSN neurodevelopment and into the OE developmental plateau. Gray box
indicates additional [11C]GV1-57 dynamic range. Error bars are ± SEM; n = 3–8 per age. Regression analysis indicates a cubic fit to the data; type III ANOVA
with Satterthwaite approximation indicates significant curve fit, P = 1.9 × 10⁻⁸. (D) DVR quantification of [11C]GV1-57 uptake in individual rats imaged at 5.5,
9, and 12 months. The slope of each line indicates the rate of OSN influx for a single animal (Supplemental Table 3). (E) DVR quantification of [11C]GV1-57
uptake in mice imaged at 3, 4, 7, 12, and 23 months. Gray box indicates additional [11C]GV1-57 dynamic range. Error bars are ± SEM; n = 2–6 per age.
**P < 0.01, ***P < 0.005, using a 2-tailed Student’s t test with Bonferroni correction (α = 0.025) for multiple comparisons. (F) Modeled olfactory neuron population curve using [11C]GV1-57 rodent imaging data from C and E. This model corroborates existing ex vivo OSN data (37–39) that suggest that net OSN
[image:6.585.48.525.56.525.2]dynamic nature of the mature OSN population and its fluctuations in individual animals. Future comparison of individual OSN
pop-ulation curves measured by [11C]GV1-57 with individual lifespan
may provide insight into the relationship between homeostatic OSN population levels and aging and senescence, potentially pro-viding a biomarker, i.e., mature OSN population, for health status during aging (17, 18).
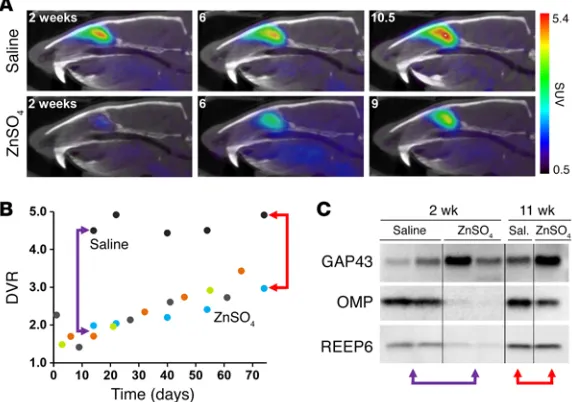
Visualizing neuron regeneration. To longitudinally and
nonin-vasively assess neurogenesis-stimulated mature OSN regenera-tion, we used an OE tissue ablation model. Intranasal irrigation with several chemical species results in complete or nearly com-plete removal of the major OE constituents (mature OSNs, imma-ture OSNs, and sustentacular cells), subsequently inducing neu-rogenesis for mature OSN replacement (40–43). We intranasally administered a zinc sulfate (ZnSO4) solution to 4 Sprague-Dawley rats, and performed longitudinal imaging studies over 10.5 weeks
(Figure 4A). Using the [11C]GV1-57 imaging data, we plotted a
neuron population curve, which shows 2 phases: an initial phase of mature OSN death (net neuron efflux) and a subsequent phase of mature OSN regeneration (net neuron influx) (Figure 4B). The neuron death is relatively rapid, with a 64% reduction in
[11C]GV1-57 binding after 18 hours and an additional 58%
reduc-tion over the next several days, affording a minimum OSN pop-ulation after approximately 1 week. Beginning 2–3 weeks after treatment, we observed a net mature OSN influx at rates between
0.55 and 2.0 DVR/mo (Supplemental Table 4). As [11C]GV1-57
measures mature OSNs, the neural regeneration that is moni-tored relies on both neurogenesis and successful integration of the newly born neurons into the neural network.
A comparison with the normative OSN growth rate of 0.35 DVR/mo for rats between 3.2 and 5.5 months of age indicates that
the OSN generation rate is higher for age-matched ZnSO4-treated
animals (Supplemental Table 4), suggesting a higher rate of OSN neurogenesis and maturation following severe OSN loss. Addi-tionally, the OSN influx rates after ZnSO4 exhibit a 3.7-fold differ-ence between the lowest and highest individual OSN influx rates, demonstrating for a second time the sensitivity of [11C]GV1-57 to
individual nuances in neuron population flux. These differences may stem from injury severity and/or individual variation in neu-rogenesis, neuron maturation, and neuron death rates, and future studies will be required to parse out the individual factors and their impact. On the whole, the group-level OSN efflux and influx timelines are in agreement with existing ZnSO4 literature (40–42); however, an individual rate analysis was previously unfeasible because of a lack of longitudinal OSN population monitoring tools.
For statistical analysis of the OSN population alteration after
saline vehicle and ZnSO4 treatments, we imaged an additional
cohort of untreated controls and saline- and ZnSO4-treated
ani-mals 2 weeks after treatment. No significant change in [11C]GV1-57
binding was observed in the saline vehicle cohort relative to the
untreated controls, but [11C]GV1-57 binding was diminished 85%
in the ZnSO4 cohort (P < 0.005) (Supplemental Figure 9). Immuno-blotting of OE extracts prepared from these animals 2 weeks after treatment confirmed a nearly complete loss of markers of mature OSNs and sustentacular cells, with an increase in the immature OSN marker, GAP43 (Figure 4C). Immunoblotting of OE tissue obtained from longitudinally imaged animals 11 weeks after treat-ment indicated a complete return of the sustentacular cells, a per-sistent increase of immature OSNs, and a 67% return of mature OSNs (Figure 4C and Supplemental Figure 10). This incomplete
mature OSN recovery 11 weeks after ZnSO4 is consistent with the
corresponding intraindividual [11C]GV1-57 imaging signature,
which shows a 50% return in [11C]GV1-57 binding. Across
bulbec-tomy, developmental, and ZnSO4 animal models, the data
demon-strate a consistent correlation of [11C]GV1-57 binding and mature
OSN levels, as assessed by OMP immunoblotting, that is not con-sistently found for the other major OE cellular constituents, the immature OSNs and the sustentacular cells.
The wide range of OSN populations present in the ZnSO4
model allowed comparison of DVR and SUV values across OSN population levels within an individual animal. Analysis of
[11C]GV1-57 DVR versus SUV using data from a ZnSO
4-treated
[image:7.585.36.322.61.262.2]animal indicates a significant correlation of the 2 measurements (Spearman, r = 1.0, P = 0.0028) (Supplemental Figure 11), further
Figure 4. Longitudinal [11C]GV1-57 imaging monitors mature OSN regeneration. (A) Representative [11C]GV1-57 PET images
(SUV, NIH+white, 3–45 minutes) of male rats treated intra-nasally with saline or ZnSO4 and imaged 0–10.5 weeks after treatment with [11C]GV1-57 (1.04 ± 0.19 mCi). All rats were
approximately 3 months old when treated with saline or ZnSO4. (B) DVR quantification of [11C]GV1-57 uptake in saline control
and ZnSO4-treated animals, each color indicating an individual animal monitored with [11C]GV1-57 over time. n = 1
saline-treat-ed animal; n = 4 ZnSO4-treated animals. (C) Immunoblotting of immature neurons (GAP43), mature neurons (OMP), and sustentacular cells (REEP6) in septal OE tissue collected from animals 2 or 11 weeks after ZnSO4 or vehicle treatment. Red arrows indicate DVR values and the corresponding immuno-blots of OE tissue collected from the same individual animals 11 weeks after treatment. Purple arrows indicate DVR values representative of [11C]GV1-57 imaging 2 weeks after treatment
validating either measure for quantitative analysis of [11C]GV1-57
imaging across treatments, genetic models, or time.
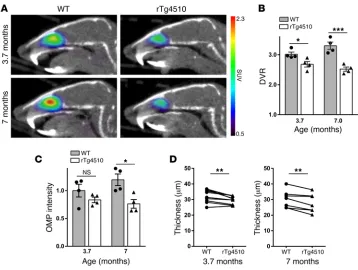
[11C]GV1-57 imaging reveals an olfactory neuron deficit in a
tauopathy model. Emboldened by the [11C]GV1-57 detection of
OSN regeneration and aging-associated neurodegeneration, we assessed the OSN population in a neurodegenerative model, the murine rTg4510 tauopathy model. This model overexpresses pathogenic tau protein in the hippocampus, cortex, and olfac-tory bulb (44) and develops a severe neurodegenerative pheno-type, particularly in the adult neurogenic dentate gyrus (DG) and the frontal cortex (44, 45), with concomitant negative effects on memory and behavior. In the DG, neurodegeneration occurs months before tau deposition (45). Given that the OE and DG exhibit adult neuron turnover, we anticipated early
neurodegen-erative changes in the OE. [11C]GV1-57 imaging was performed in
rTg4510 mice at 3.7 and 7 months of age (Figure 5A). DG neuro-degeneration, but not cortical neuroneuro-degeneration, is seen at the younger age (3.7 months), whereas severe cortex neurodegener-ation and widespread tau tangles are present at 7 months (44, 45).
At both ages, significant reductions in [11C]GV1-57 binding, 17%
(P < 0.05) at 3.7 months and 34% (P < 0.005) at 7 months, were found in the rTg4510 animals relative to age-matched controls
(Figure 5B), indicating an OSN population deficit. We hypothesize translation of this early-stage OSN deficit to human tauopathies given the similar adult neurogenic nature of human OSNs (21–23) and exist-ing biopsy data from Alzheimer’s patients (20). Verifying this novel neurodegenerative OSN pheno-type was a reduced postmortem OMP staining (36% at 7 months,
P < 0.05) (Figure 5C and
Supple-mental Figure 12) and OE thickness (8% at 3.7 months, P < 0.005; 9% at 7 months, P < 0.01) (Figure 5D), which has a linear relationship with neuron number (39). OMP levels were not significantly reduced at 3.7 months, although the percent-age decrease from WT to rTg4510 animals (17%) was equivalent to
that found with [11C]GV1-57
imag-ing, pointing to a lower variability for [11C]GV1-57 quantification.
The early-stage OSN neurode-generation detected by [11C]GV1-57
was compared with tau tangle depo-sition and brain thickness of 2-, 4-, 6-, and 8-month-old rTg4510 ani-mals (Supplemental Figure 13). Tau tangle pathology begins between 2 and 4 months of age, while reduced brain thickness occurs after [11C]GV1-57–detected OSN deficits,
between 4 and 6 months of age. Thus, [11C]GV1-57 offers a marker of neurodegeneration relatively
early during the progression of tauopathy in this transgenic model. Notably, neuron loss is a better correlate of cognitive deficits than tau burden within the same brain region (46, 47), and tau patholo-gy can be present without neuron loss (48). Therefore, [11C]GV1-57
imaging of early-stage neuron loss in human neurodegenerative disease may offer complementary diagnostic and therapeutic monitoring applications compared with existing biomarkers.
Translational potential: clinical image assessment and nonhuman primate imaging. The clinical translational potential of [11C]GV1-57
was first evaluated using the WT and rTg4510 imaging data in a sim-ulated clinical setting. Individual mouse scans were read by experi-enced radiologists not familiar with [11C]GV1-57 imaging. Following
presentation of a training slide with representative WT and rTg4510 images, the radiologists were asked to use the scan data to classify individual animals by genotype. From the 3.7-month-old animals, 83% were grouped correctly with 1 false positive, and from the 7-month-old animals, 100% were grouped correctly (Supplemental Tables 5 and 6). The assessment of GV1-57 images in a clinical set-ting highlights GV1-57’s potential for clinical, image-based detec-tion of OSN neurodegeneradetec-tion, supporting the future applicadetec-tion of [11C]GV1-57 to human imaging.
Figure 5. [11C]GV1-57 imaging of early-symptomatic mature OSN neurodegeneration in a murine tauopathy model. (A) Representative [11C]GV1-57 PET images (SUV, NIH+white, 3–45 minutes) of female rTg4510 and
WT (within colony) mice at 3.7 and 7 months of age. Mice were administered [11C]GV1-57 (0.51 ± 0.091 mCi)
and imaged for 60 minutes. (B) DVR quantification of [11C]GV1-57 uptake in WT control and rTg4510 animals.
[image:8.585.42.400.54.324.2]al information for comparison with the PET images, confirming that the superior nasal cavity is the region of saturable [18F]GV1-57
uptake (Figure 6). Together, these ex vivo and in vivo data high-light the translational potential for this new imaging tool, opening the door for exploration of OSN population flux in human develop-ment, aging, and disease.
Discussion
GV1-57 is a first-in-class mature OSN population radiotracer for accurate in vivo OSN population measurements in mice and rats. Immunohistochemical and immunoblot validation of GV1-57 imaging outcomes affirms GV1-57 as a novel imaging biomarker for alterations in the level of mature OSNs resulting from growth, neuron recovery, aging, acute injury, or disease. We propose that the sensitivity of mature OSN levels, particularly to early stages of aging and disease, is partly a result of the high adult turnover of OSNs. The OE has rates of cellular proliferation of approximate-ly 1 million new cells per day at P21 and about 70,000 new cells per day at P333 in rats (39), and the ensuing OSN turnover is sev-eral hundred- to sevsev-eral thousand-fold higher than the levels in the dentate gyrus or subventricular zone across lifespan (51, 52). This high neuron turnover yields a mature OSN population that is continuously impacted by fluctuations in neuron life cycle stages, including proliferation, differentiation, maturation, and death. Alterations in neuron health that impact the neuron life cycle stag-es will quickly emerge as an alteration of OSN population. Thus, we propose a model wherein OSN population correlates with homeostatic regulation of cerebral neuron population, and that the unique OSN properties potentially afford improved sensitivity to alterations of neuron population relative to the brain.
From a clinical perspective, the animal models used through-out our studies simulate disease states that may benefit in areas Interspecies differences are an important consideration for
the translation of any radiotracer. The radiotracer target density is of paramount consideration, as alterations in the radiotracer target density (i.e., concentration) will impact radiotracer binding, and consequently radiotracer uptake. The density of the GV1-57 target, the mature OSNs, has been mapped across lifespan in rats
and has a range of approximately 5 × 10⁴ to 10 × 104 OSNs/mm2
(37). Comparatively, the mature OSN density measured in a
lim-ited set of human tissue was approximately 3 × 10⁴ OSNs/mm2
(49). While the human OSN density appears to be lower than that
of rats, [11C]GV1-57 measures rat OSN population at younger ages
when the OSN density is likely similar to that of humans. This comparison supported the translation of GV1-57 to NHPs, wherein we completed pilot autoradiography and imaging studies.
To assess the uptake of GV1-57 within primate nasal epithe-lium, autoradiography was completed with tissue dissected from the nasal septum of a male baboon (Papio anubis). Pretreatment
with nonradiolabeled GV1-57 (10 μM) reduced the intensity of the
[11C]GV1-57 autoradiogram in the septal tissue, suggesting
satura-ble binding of GV1-57 in NHP nasal tissue (Supplemental Figure 14). In vivo assessment of GV1-57 binding in NHPs was
complet-ed through administration of [18F]GV1-57 to a rhesus macaque in
the presence or absence of nonradiolabeled GV1-57 (0.5 mg/kg). Within the superior nasal cavity, the location of OSNs within the
primate nasal cavity (50), the [18F]GV1-57 PET images indicate a
reduction in [18F]GV1-57 uptake following administration of
non-radiolabeled GV1-57 (Figure 6). This suggests maintenance of saturable binding for GV1-57 within the NHP nasal epithelium in vivo. In concert with the PET imaging, a structural magnetic res-onance image of the nasal cavity and brain was obtained using a T1-weighted magnetization-prepared rapid acquisition with gradi-ent echo (MPRAGE) sequence. The MPRAGE provided
structur-Figure 6. [18F]GV1-57 exhibits saturable nasal epithelium uptake in a rhesus macaque. Left: Coronal and axial [18F]GV1-57 PET images (SUV, NIH+white,
16–40 minutes) at the location of the superior nasal epithelium following administration of [18F]GV1-57 (4.89–5.07 mCi) with or without i.v. cotreatment
[image:9.585.65.518.60.272.2]reaction mixture was stirred in the ice-water bath until it melted, at room temperature (RT) overnight, and then at 60°C for 6 hours. The reaction was allowed to cool to RT before being added to a mixture of ethyl acetate (EtOAc, 150 ml) and deionized (DI) water (100 ml). After shaking, the water layer was collected and the organic phase was washed once with DI water (100 ml), followed by brine (75 ml). The organic phase was dried over sodium sulfate and concentrated to give the pure product, N-benzyl-2-fluoro-9H-purin-6-amine (970 mg, 92%), as a pale yellow solid. LCMS (electrospray ionization): cal-culated for [C12H10FN5+H]+: 244, found 244 [M+H]+. 1H NMR (500 MHz, DMSO-d6): 4.64 (m, 2H), 7.23 (t, 5H, J = 7.1), 7.37–7.29 (m, 4H), 8.11 (s, 1H), 8.72 (s, 1H, NH), 12.93 (s, 1H, NH). 13C NMR (126 MHz, DMSO-d6): 43.2, 126.8, 127.3, 128.3, 139.3, 139.5, 155.3, 157.8, 159.5.
Compound 3, nonradiolabeled GV1-57. Compound 2 (300 mg, 1.23
mmol, 1 Eq), potassium carbonate (852.4 mg, 6.17 mmol, 5 Eq), and methyl iodide (374 μl, 6.01 mmol, 4.89 Eq) were added to dimeth-ylacetamide (DMA, 3.5 ml), and the reaction was stirred at RT for 7 hours. Excess methyl iodide was removed by first passing N2 (gas) through the solution for 15 minutes and then placing the reaction under vacuum. The reaction was then added to EtOAc (50 ml), which was washed with DI water (100 ml). The aqueous phase was collected and washed with EtOAc (3 × 50 ml). The combined organic phases were then washed with brine (50 ml), dried over sodium sulfate, and concentrated. After manual flash column chromatography (dichloro-methane/EtOAc/methanol, 49:49:2), 215.5 mg (68%) of pure nonra-diolabeled GV1-57 was obtained as a pale yellow solid. LCMS (elec-trospray ionization): calculated for [C13H12FN5+H]+: 258, found 258 [M+H]+. 1H NMR (500 MHz, DMSO-d6): 3.67 (s, 3H), 4.63 (d, 2H, J = 6), 7.20–7.33 (m, 5H), 8.10 (s, 1H), 8.84 (s, 1H, NH). 13C NMR (100 MHz, DMSO-d6): 29.5, 43.2, 117.3, 126.8, 127.2, 128.2, 139.3, 141.8, 150.4, 150.6, 155.7, 155.9, 157.7, 159.7.
Compound 3, [11C]GV1-57. DMSO (300 μl) was added to a vial
containing compound 2 (1–1.5 mg) and potassium hydroxide (4–6 mg, powdered). The solution was transferred to a reaction vessel with a stir bar, and the reaction vessel was placed in a TRACERlabFX-M syn-thesizer reactor. The automated system was used to add [11C]methyl iodide (100–400 mCi), and the solution was stirred at 80°C for 5 minutes. Quenching solution was then added (1.7 ml 35% acetonitrile [ACN] and 65% H2O with 0.065% formic acid), and the solution (2 ml) was injected onto a Phenomenex Luna C18 semipreparative column. The product was purified via HPLC at a flow rate of 5 ml/min using isocratic conditions (35% ACN and 65% H2O with 0.065% formic acid). The desired radioactive fraction was collected, and the product was reformulated in 10% ethanol in saline (10 ml). The identity of the product was confirmed using liquid chromatography under standard gradient conditions with a coinjection of the radioactive product and a standard solution containing nonradiolabeled GV1-57.
Animals. Male Sprague-Dawley rats (Charles River Laboratories)
were pair-housed until they reached a weight of 500 g, and female mice (Jackson Laboratory or Taconic) were singly or group-housed, as received. All animals were kept on a 12 hours/12 hours light-dark cycle, switching at 7 am and pm. All treatments and imaging were per-formed according to procedures approved by the IACUC.
General rodent imaging procedure. Before imaging, animals were
anesthetized with inhalational isoflurane, and a catheter was placed in a lateral tail vein. An extension line was used to attach the catheter to a syringe with heparinized saline. Animals were then placed in 1 of
of therapeutic development, diagnosis, and treatment monitoring from an objective OSN population measurement. Traumatic brain injury results in hyposmia or anosmia in 26% to 69% of patients (53, 54) due to olfactory nerve shearing, which is simulated by anterior olfactory bulbectomy. Meanwhile, upper respiratory viral infections, which can lead to smell loss, are simulated by the ZnSO4 chemical ablation model. We hypothesize that use of bulbectomy
and ZnSO4 models in combination with GV1-57 imaging and novel
OSN regenerative therapeutics would assist development of first-in-class therapeutics for acute, trauma-induced smell loss.
Switching from acute injury to chronic models, our aged rodent imaging simulates human aging, and the tauopathy model simu-lates various neurodegenerative diseases. The OSN population deficits detected during aging and in the tauopathy model were detected during early stages of aging and disease, indicating early- stage sensitivity of the OSN population to global neuron dysreg-ulation. In the aging model, the detected OSN efflux suggests OSN neurodegeneration may correlate with the aging-associated olfactory dysfunction that predicts increased mortality rates (17, 18). Monitoring this process in humans may provide insight into individual health and help guide medical interventions target-ed at increasing healthy lifespan. The detection of early-stage OSN deficits in the tauopathy model suggests a potential use for GV1-57 OSN population monitoring in neurodegenerative disease, wherein GV1-57 may serve as an adjunct diagnostic or method for monitoring therapeutic response through measurement of OSN regeneration. Although initial NHP studies support the human translational potential of GV1-57, human studies, including charac-terization of and possible correction for partial volume effects, are needed to support application of GV1-57 to human OSN measure-ment. Since many of the use-models for GV1-57 benefit from lon-gitudinal imaging of the OSN population, or monitoring OSN pop-ulation flux, we propose the name Neuroflux for this radiotracer.
Methods
General synthetic methods. Chemical reagents were American
Chemi-cal Society–grade purity or higher, and were used as received without further purification. Reactions were performed under inert atmo-sphere of nitrogen with standard Schlenk technique in oven-dried glassware. Analytical TLC was performed on TLC silica Gel 60-F254 plates (SiliCycle Inc.) with visualization by UV irradiation at 254 nm. Manual flash column chromatography was performed with SiliaFlash P60 silica gel (SiliCycle Inc.) and analytical-grade solvents, used with-out further distillation. NMR spectra were recorded at 22°C on a Vari-an 500-MHz spectrometer (1H, 500.16 MHz, and 13C, 125.784 MHz). 1H and 13C NMR chemical shifts are reported as δ in units of parts per million using residual solvent signals for referencing. Liquid chroma-tography-mass spectrometry (LCMS) analysis of organic synthetic reactions was conducted on an Agilent 1100 series high-performance liquid chromatograph with an attached Agilent 6310 ion trap mass spectrometer with an electrospray ionization source.
Compound 2. Compound 2 was synthesized according to
for intranasal administration, while in a supine position, of either ZnSO4 (10% in saline, 100 μl per nostril, n = 7) or vehicle (saline, 100
μl per nostril, n = 4). ZnSO4 and vehicle were administered bilaterally, with injection in the right nostril occurring 15 minutes before injection of the left nostril. For the injection, anesthetized animals were placed in a supine position, with a slight tilt toward the side opposite the nos-tril being injected. PE 10 tubing attached to a syringe with the ZnSO4 or vehicle dose was then inserted 14 mm into the nostril, and the solution was quickly expunged into the nasal cavity. The head was then held at a 45° angle with the body supine for 1 to 2 seconds before the rat’s nose was held down to allow excess solution to drain from the nostril. Ani-mals were allowed to wake between right and left nasal injections to assist with clearing of the nasal passages. Using this procedure, there was no animal mortality. From 1 to 74 days after ZnSO4 treatment, ani-mals were imaged with [11C]GV1-57 (1.02 ± 0.14 mCi in 1:9 ethanol/ saline). After the final imaging session, animals were euthanized, and their OE tissue was collected for immunoblotting.
[11C]GV1-57 imaging of rat neurodevelopment. At the specified ages,
male Sprague-Dawley rats were injected i.v. with [11C]GV1-57 (0.93 ± 0.14 mCi, in 1:9 ethanol/saline) (1.3 months, n = 5; 2 months, n = 3; 3 months, n = 4; 5.5 months, n = 8; 9 months, n = 8; 12 months, n = 7; 15 months, n = 3). Some animals were additionally injected with vehicle (4 ml/kg; in 1:1:8 DMSO/Tween-20/saline) 5 minutes before radio-tracer injection. Animals were imaged for 60 minutes.
[11C]GV1-57 imaging during mouse neurodevelopment and aging. At
the specified ages, B6C3F1 or C57BL/6 female mice were injected i.v. with [11C]GV1-57 (0.54 ± 0.11 mCi, in 1:9 ethanol/saline) and imaged for 60 minutes (3 months, n = 6; 4.2 months, n = 2; 7 months, n = 3; 12 months, n = 5; 23 months, n = 3).
[11C]GV1-57 imaging of rTg4510 mice. Female rTg4510 and WT
control mice were obtained from Taconic (provided by Eli Lilly and Co., Indianapolis, Indiana, USA). Groups of 4 animals of the specified ages and genotypes were injected i.v. with [11C]GV1-57 (0.51 ± 0.091 mCi, in 1:9 ethanol/saline) and imaged for 60 minutes.
Rhesus macaque imaging and image processing procedure. A paired
baseline/blocking PET/MR study was performed on a male macaque (~11 kg) on 2 separate days. The study was approved by the IACUC at the Massachusetts General Hospital. The animal was deprived of food for 12 hours prior to the study. Anesthesia was induced with i.m. ket-amine (10 mg/kg) and xylazine (0.5 mg/kg). For maintenance of anes-thesia throughout the study, the animal was provided with 1%–1.2% isoflurane in oxygen while a dose of yobine (0.11 mg/kg, i.m.) was giv-en to reverse the effects of ketamine/xylazine before the start of the scan. Vital signs including end-tidal CO2, O2 saturation, heart rate, and respiration rate were monitored continuously (recorded every 15 min-utes) and were maintained within normal physiological ranges.
PET and MR images were acquired on a 3T Siemens TIM-Trio with a BrainPET insert (Siemens). A custom PET/MRI-compatible 8-chan-nel array coil for NHP brain imaging was used to improve image signal and quality compared with using a clinical human head coil. Dynamic PET image acquisition was initiated, followed by i.v. administration of [18F]GV1-57 (4.89–5.07 mCi) as a manual bolus over approximately 30 seconds. A baseline [18F]GV1-57 PET scan was first carried out. A sec-ond PET scan (i.e., the blocking scan) was performed, on a separate day, with coinjection of [18F]GV1-57 and nonradiolabeled GV1-57 (0.5 mg/kg) to determine saturable binding. No physiological response to 0.5 mg/kg GV1-57 was observed. Dynamic PET data were collect-2 instruments (a GammaMedica Triumph PET/CT/SPECT scanner or
a Siemens R4 PET scanner) and maintained under inhalational isoflu-rane anesthesia for [11C]GV1-57 injection, a 60-minute dynamic PET scan, and a 5-minute attenuation or CT scan. Following imaging, ani-mals were placed in their cages and monitored until they recovered from the anesthesia.
General rodent image processing procedure. All PET data were
histo-grammed using the following time slices: 8 × 15 seconds, 8 × 60 sec-onds, 10 × 120 secsec-onds, and 6 × 300 seconds. For scans completed in the Triumph scanner, CT images of the animals were taken for PET image attenuation. For animals imaged in the R4, a Cobalt (Co) 57 line source was used to create an attenuation correction map. Reconstruct-ed PET data were analyzReconstruct-ed in Amide. Rat PET data were first alignReconstruct-ed with CT data from an age-matched rat with all animals from a single experiment and/or age-group overlaid. A single VOI was then placed over the OE, centered on the region of highest uptake. A second VOI was placed over the brain for use as the reference region for Logan analysis. Mouse PET data were aligned with the corresponding indi-vidual mouse CT, or an experimentally matched CT. VOIs with consis-tent dimensions were then placed over the OE and brain of individual mice for Logan analysis. DVRs and binding potentials were calculated using a t* of 45 minutes. Voxel-wise SUV (mean radioactivity/injected dose/weight) maps were calculated, and images were generated for 3–45 minutes after [11C]GV1-57 administration.
[11C]GV1-57 saturable binding and in vivo IC
50. To analyze saturable
binding, 2-month-old Sprague-Dawley rats were injected with nonra-diolabeled GV1-57 (16 mg/kg at 4 mg/ml in 1:1:8 DMSO/Tween-20/ saline, n = 3) or vehicle (1:1:8 DMSO/Tween-20/saline, n = 3) 5 min-utes before injection of [11C]GV1-57 (0.93 ± 0.08 mCi, in 1:9 ethanol/ saline). To determine the in vivo IC50, nonradiolabeled GV1-57 (0, 0.25, 0.5, 1, 2, and 4 mg/kg, n = 1 per dose) and [11C]GV1-57 (0.51 ± 0.02 mCi) were coadministered to animals in 1 ml of 1:1:1:7 DMSO/ Tween-20/ethanol/saline.
[11C]GV1-57 imaging following anterior bulbectomy.
Three-month-old female C57BL/6 mice were deeply anesthetized with isoflurane anesthesia for either a bilateral (n = 3) or a unilateral (n = 3) olfactory bulbectomy. The mice were placed in a stereotaxic head stage and given an s.c. injection of 0.1 ml of lidocaine (2%) before the incision was made. A midline incision was made between the orbits to expose the region of the skull above the olfactory bulbs. One or two cranial windows, each approximately 1 mm in diameter, were cut with a drill over the anterior portion of the olfactory bulbs. The anterior portion of the olfactory bulb (~10% of the total bulb) was removed by slicing the neural tissue with a needle blade and extracting it through the cranial window before suturing the wounds. Animals were allowed to recover on a heating pad for 15–30 minutes and given an injection of buprenorphine (0.05–0.1 mg/kg) for pain management. Once ful-ly conscious, mice were housed individualful-ly and allowed to recover for 3 days and given buprenorphine injections every 12 hours. After recovery, mice were injected i.v. with [11C]GV1-57 (0.55 ± 0.053 mCi in 1:9 ethanol/saline) and imaged. Animals were imaged 3 days after bulbectomy, except for the bilateral animal with the highest DVR, which was imaged 2 days after bulbectomy. Following imaging, ani-mals were euthanized, and their OE tissue was collected for immuno-blotting (n = 2 per group).
ZnSO4 treatment and longitudinal imaging. Three-month-old male
Bio-Rad) at 4°C overnight followed by washing in TBST at RT (rest of protocol performed at RT). Primary and secondary antibody incuba-tion was as follows: OMP (1:80,000; 544-10001; Wako) followed by donkey anti-goat–HRP (1:10,000 in 3.5% BSA in TBST; sc2020; Santa Cruz Biotechnology Inc.); GAP43 (1:2,000; NBP1-41123; Novus Bio-logicals) followed by donkey anti-sheep–HRP (1:10,000 in 3.5% BSA in TBST; ab97125; Abcam); REEP6 (1:1,000; 12088-1-AP, Proteintech) followed by donkey anti-rabbit–HRP (1:5,000; 7074S; Cell Signaling Technology). Membranes were incubated and washed in TBST, fol-lowed by incubation with ECL prime detection substrate (RPN2232; GE Healthcare), and imaging with a Chemidoc XRS system. Band intensity and background measurements were obtained in Image Lab 5.1 (Bio-Rad) using the volume tool. Relative band intensity per micro-gram of protein was normalized to control group or the youngest age group. To calculate total cellular marker protein in each tissue sample, the relative band intensity was multiplied by the total protein extract-ed from the tissue sample.
Autoradiography: rat. Freshly dissected, whole rat OE was removed
and submerged in OCT mounting medium (25608-930; VWR) fol-lowed by snap freezing on dry ice. Frozen, embedded tissue was sliced in 10-μm coronal sections onto slides (4 sections per slide) using a cryostat (HM550; Thermo Fisher Scientific). Slides were immersed in 4% PFA in phosphate buffer (BM-698, Boston Bioproducts) contain-ing 2% EtOH for 30 minutes followed by 10 mM Tris, pH 7.5, at 4°C for 10 minutes. Sections were then submerged for 20 minutes in 10 mM Tris buffer containing nonradiolabeled GV1-57 (10, 5, 0.5, 0.1, 0
μM) and 5% DMSO. To these solutions was added [11C]GV1-57 (~200 nCi), before incubation at RT for 12 minutes. Slides were then washed in 10 mM Tris buffer for 10 minutes at RT and dried under vacuum for 30 minutes at 25°C. All slides were exposed to multisensitive phos-phor screens (PerkinElmer) for 1 hour and imaged with a Cyclone Plus Storage Phosphor system (PerkinElmer). Images were colored using the Rainbow lookup table in ImageJ (NIH) with equivalent thresholds for brightness. Intensity values for each OE slice were measured using ImageJ, background subtracted, and averaged across replicate sec-tions. All values were normalized to those of the DMSO-treated OE sections and displayed using GraphPad Prism software.
Autoradiography: Papio anubis. A freshly dissected Papio anubis
nasal cavity was placed in freshly made 4% PFA in PBS and stored at 4°C. Tissue from either side of the nasal septum was carefully detached from the septum using forceps and placed in 10 mM Tris, pH 7.5, at 4°C. The tissue was then submerged for 20 minutes in 10 mM Tris buffer containing nonradiolabeled GV1-57 (10 or 0 μM) and 5% DMSO. To these solutions was added [11C]GV1-57 (~200 nCi), before incubation at RT for 15 minutes. The septal tissue was washed quickly by submerging 5 times in 10 mM Tris buffer and then transferred to a conical vial containing fresh 10 mM Tris buffer for 10 minutes at RT. The tissue was removed, air-dried, and exposed to a multisensitive phosphor screen (PerkinElmer) for 1 hour and imaged with a Cyclone Plus Storage Phosphor system (PerkinElmer). Images were colored using the color scale option in OptiQuant software (PerkinElmer).
OE thickness measurements. Whole OE collected from mice for
IHC purposes was fixed in 4% PFA (P6148; Sigma-Aldrich) in PBS for 24 hours, cryoprotected in 30% sucrose in PBS for 48–72 hours, snap-frozen in M-1 embedding matrix (1310; Thermo Fisher Scien-tific), and stored at –80°C. Embedded OE was sliced coronally (20
μm; HM550; Thermo Fisher Scientific), with sections thaw-mount-ed and storthaw-mount-ed in list mode for 80–90 minutes. The PET images were
reconstructed using the 3D ordinary Poisson expectation maximiza-tion algorithm (32 iteramaximiza-tions) with detector efficiency, decay, dead time, attenuation, and scatter corrections applied. PET data were reconstructed with gradually increasing intervals (8 × 15 seconds, 8 × 60 seconds, 10 × 120 seconds, 10–12 × 5 minutes). The highest image resolution was on the order of 2–3 mm for BrainPET. The final image volumes were reconstructed into 76 slices with 128 × 128 pixels and a 2.5-mm isotropic voxel size. A high-resolution, T1-weighted, ana-tomical MRI scan using a multi-echo MPRAGE sequence (TR = 2,530 ms, TE1/TE2/TE3/TE4 = 1.64/3.5/5.36/7.22 ms, TI = 1,200 ms, flip angle = 7°, and 1 mm isotropic) was obtained before the injection of the radiotracer. The anatomical MRI images between the baseline and blocking scans were coregistered using a linear transformation. The transformation parameters were then applied to the simultane-ously collected dynamic PET data. Voxel-wise SUV (mean radioactiv-ity/injected dose/weight) maps were calculated for the baseline and blocking scan, and images were generated for 16–40 minutes after [18F]GV1-57 administration.
OE dissection, rodent. Animals were decapitated, and the skin and
tissue around the skull were removed using a combination of dissec-tion scissors and bone rongeurs. Forceps were used to clean the eye socket, and rongeurs used to cut both maxilla where they branch away from the nasal cavity. Rongeurs were then used to cut away the upper incisors and the very front of the nasal cavity. Rongeurs (rats) or scis-sors (mice) were used to cut away the occipital and interparietal bones, then used to cut along the lateral edges of the parietal and then frontal bones to reach the nasal cavity. Superior nasal bones were removed, then the side of the nasal cavity to expose the OE. Non-OE tissue was removed with forceps. For IHC, scissors were used to cut the intact, whole OE away from the palate. For immunoblotting of rat OE, small forceps were used to pull out the turbinate bones and associated OE. The OE located on the septum was then carefully removed and placed in an Eppendorf tube and snap-frozen on dry ice. For immunoblotting of mouse OE, whole OE was collected and snap-frozen over dry ice. For IHC, mice were perfused with 4% paraformaldehyde (PFA; P6148, Sigma-Aldrich) in PBS.
Tissue lysate preparation. Rodent OE tissue, septum only (rat) or
whole OE (mouse), was lysed at 100 mg/ml in lysis buffer containing PBS, 0.15% NP-40, and a protease inhibitor cocktail (04693159001; Roche). The tissue was homogenized for 1 minute with an electric mortar, and the homogenized tissue, on ice, was sonicated (mod-el CL-18, Fisher Scientific) at 50% power for 30 one-second pulses. Lysate was incubated with rotation at 4°C for 15 minutes and centri-fuged at 18,000 g at 4°C for 20 minutes. The supernatant was collect-ed, and total protein concentration was determined using a BCA pro-tein assay (23227, Pierce).
Immunoblotting. Samples were each diluted to a concentration
bectomy groups. For Figure 3C, the software package R was used to complete a regression analysis, which was assessed by a type III ANOVA with Satterthwaite approximation. For single intergroup comparisons, a P value less than 0.05 was considered significant; for 2 intergroup comparisons, a P value less than 0.025 was considered significant (Bonferroni correction).
Study approval. All rodent and nonhuman primate studies were
approved by the IACUC at the Massachusetts General Hospital.
Author contributions
GCV, JMH, and MWA designed the project. GCV, MMR, LC, MWA, and JMH designed experiments. GCV, MMR, LC, JE, SPH, ELR, HYW, MJO, ZA, TKM, JES, CW, and FAS performed experiments. GCV designed and synthesized the radiotracer and analyzed imaging data with input from HYW and JMH. GCV, MMR, JE, and SPH analyzed immunoblotting, autoradi-ography, and microscopy data. GCV, MMR, MWA, and JMH interpreted the data. GCV, MMR, JE, SPH, HYW, and ZA wrote the Methods and supplemental information. MJO, ZA, and TKM supplied the rTg4510 animals, and designed and led the cross-sectional tau pathology characterization of the rTg4510 brain sections. GCV, ELR, MWA, and JMH wrote the manu-script with input from all authors.
Acknowledgments
We acknowledge the Department of Energy (DOE Training Grant DE-SC0008430, awarded to J.M.H.), the Phyllis and Jerome Lyle Rappaport MGH Research Scholar Award (awarded to J.M.H) and National Institutes of Health (NIH R21 NS085711, awarded to M.W.A.) for funding this work. We also acknowl-edge the National Center for Research Resources (NCRR; P41 RR14075 to the Athinoula A. Martinos Center for Biomedical Imaging), the NIH (S10 RR015728), and the Athinoula A. Mar-tinos Center for Biomedical Imaging for resource support. WT and age-matched rTg4510 animals were generously provided by Eli Lilly through a colony housed at Taconic. Purinergic and ade-nosine agonist and antagonist functional data were generously provided by the National Institute of Mental Health’s Psychoac-tive Drug Screening Program (NIMH PDSP), contract HHSN-271-2013-00017-C. The NIMH PDSP is directed by Bryan L. Roth at the University of North Carolina at Chapel Hill and proj-ect officer Jamie Driscoll at NIMH, Bethesda, Maryland, USA. Biostatistical analysis was conducted in part with assistance from Mark Vangel at Harvard Catalyst (NIH NCRR and National Center for Advancing Translational Sciences through grant UL1 TR001102) and financial contributions from Harvard University and its affiliated academic health care centers. We thank radiol-ogists Umar Mahmood and Pedram Heidari for classification of WT and rTg4510 animal scans, and we thank Nicole Zurch-er for insightful discussion. We are grateful to Aijun Zhu, Ala-na Ross, Martin Strebl, Michael Placzek, and Diego Dos Santos Ferreira for technical assistance with rodent imaging. We thank the Martinos Center Radiopharmacy team (Garima Gautam, Nathan Schauer, Kari Phan, Ehimen Aisaborhale, Samantha To, Judit Sore) for technical assistance with radiotracer synthesis. We acknowledge histological support from the neuropathology team at Eli Lilly (UK).
ed onto microscope slides (12-550-18; Thermo Fisher Scientific). Before DAPI staining, slides were thawed, dried at RT for 15 minutes, postfixed in 4% PFA in PBS for 10 minutes, washed in PBS (2 × 10 minutes), permeabilized in PTS (PBS plus 0.5% Triton X-100) for 10 minutes at RT, and washed in PBS (3 × 10 minutes). Excess PBS was removed from slides using a Kimwipe (Kimtech Science) before addition of DAPI-containing mounting medium (150 μl per slide; P-36931, Life Technologies) and placement of coverglass. Slides were air-dried overnight at RT and sealed with clear nail polish. Using an inverted epifluorescence microscope (Axio Observer.Z1; Zeiss) and camera (Exi-Aqua; Q-Imaging), images of the OE were taken with a ×10 Plan-Apochromat lens, centered on the top or middle portion of the septal OE. Images were acquired using MetaMorph software, ver-sion 7.7.4.0. Sections from WT and rTg4510 animals were paired by OE depth and region within the septum (top or middle). OE thickness measurements were made in ImageJ, wherein paired regions (WT and rTg4510, within age) were bounded by lines and measurements were made approximately every 10 μm within the boundaries. All measure-ments within the boundaries were averaged to provide final thickness measurement. Thickness measurements were then compared based on pairings of OE depth and septal region.
Tau pathology. Formalin-fixed paraffin-embedded brains from
female rTg4510 mice at 2, 4, 6, and 8 months of age were sectioned (6 μm thickness) in the sagittal plane. IHC was performed using a phosphospecific tau antibody (PG-5, pSer409; gift from Peter Davies, Feinstein Institute for Medical Research, Manhasset, New York, USA) as previously described (56). Stained sections were digi-tized using the Scanscope AT slide scanner (Aperio) at ×20 magnifi-cation. Imagescope software (v11.1.2.780; Aperio) was used to view the digitized tissue sections.
Assessment of [11C]GV1-57 images from individual WT and rTg4510
mice. A contingency table was developed for analysis of the WT and
rTg4510 animals using animal genotype as the reference standard. Sixty-minute scans from individual animals were converted into SUV and averaged from 3–45 minutes. A training slide was devel-oped for each age group (3.7 and 7 months), showing an example WT and rTg4510 image, including details of the SUV thresholds (0–2.15 for 3.7 and 7 months). Reviewers were asked to view individual ani-mal scans in Amide, with the ability to assess scans in 3D space and adjust the SUV thresholds. Two radiologists were asked to come to a consensus agreement of each animal’s genotype. Given the small sample size (6 animals per age), the percentage of correct classifi-cations was calculated instead of a χ2 statistical analysis being com-pleted. Scans used for this analysis were taken from a single instru-ment, the Triumph scanner, which represented a majority of the scans acquired. The trained radiologists who read the scans have a combined 37 years of experience with small-animal imaging and/or clinical image assessment.
IC50 and correlation analyses. IC50 values were determined using
GraphPad Prism software with the log(inhibitor) versus response (3 parameters) nonlinear fit option. Spearman correlations were per-formed using GraphPad Prism.
Statistics. All data are presented as the mean ± SEM and were
![Figure 2. [11C]GV1-57 binds mature OSNs. (A) Representative [C]GV1-57 PET images (SUV,](https://thumb-us.123doks.com/thumbv2/123dok_us/8135992.798280/5.585.34.354.55.501/figure-binds-mature-osns-representative-pet-images-suv.webp)
![Figure 6. [18F]GV1-57 exhibits saturable nasal epithelium uptake in a rhesus macaque. Left: Coronal and axial [18F]GV1-57 PET images (SUV, NIH+white, 16–40 minutes) at the location of the superior nasal epithelium following administration of [18F]GV1-57 (4](https://thumb-us.123doks.com/thumbv2/123dok_us/8135992.798280/9.585.65.518.60.272/exhibits-saturable-epithelium-coronal-location-epithelium-following-administration.webp)
