© 2017, IRJET | Impact Factor value: 5.181 | ISO 9001:2008 Certified Journal | Page 1641
Study and CFD Analysis on different test plate specimens with different
nozzles for thermal striping Phenomenon in LMFBR Reactors
Yerranagu Ashok reddy
1, K.Jayasimha Reddy
21
P.G Student, Mechanical Engineering, G. Pulla Reddy Engineering College (Autonomous), Kurnool, AP, India
2Assistant Professor, Mechanical Engineering, G. Pulla Reddy Engineering College (Autonomous),
Kurnool, AP, India
---***---Abstract - Thermal stripping is a phenomenon is defined as
the thermal fatigue occurred due to the flow of hot and cold streams at different temperature with a temperature difference of about 100*c mixing in a fluid domain, result in an arbitrary change of temperature field of the fluid domain with respect to time. This random temperature fluctuation is termed as Thermal Striping which leads to random temperature fluctuations in the interface between the non-isothermal streams arising out of jet instability Thermal stripping is analysis is carried out by both experimentally and by using CFD analysis, for experimentation an experimental set up is fabricated and the results from experimentation is taken by data logger software, results from the experiment recorded and these are the input values taken for CFD analysis, importing recorded valves in CFD we get output results.This both experimental valves and CFD analysis results are compared and finally power spectral analysis is carried out for three metals for utilization of this metals for future use in fast breeder reactors as inner core, The condition for satisfying the utilization of metals as inner core without thermal striping phenomenon is that the metals should not exceeds the frequency(0.1-10)Hz
KeyWords: Thermal stripping phenomenon, Experimental
Analysis, CFD analysis, Power spectral density
1. INTRODUCTION
1.1.1Thermal stripping phenomenon
The Fast Breeder Reactor (FBR) is known for its ability to produce more fissile material than it consumes. In the reactor, heat generated in the core from nuclear fission is carried by primary sodium and is transferred to the secondary sodium in the Intermediate Heat Exchanger. Finally, the secondary sodium exchanges heat to water in the steam generator leading to the production of superheated steam to generate power (Chetaletal., 2006). Numerical sub-assemblies of various types constitute the reactor core. The central portion of the core consists of Fuel sub-assemblies. This zone is surrounded by Blanket, Reflector, Storage and Shielding subassemblies. A major fraction of the energy is released in the fuel zone and hence the sodium jets coming out of the fuel core will be at higher temperature. On the other hand, the coolant passing through the blanket takes away less amount of heat because of low heat generation in the blanket zone. Both the cold and hot streams exit from the
reactor zone as high- velocity jets. The improper mixing of the jet issued from these sub-assemblies results in jets temperature fluctuations in the fluid. This may lead to the damage of above core structural components. This phenomenon is known as thermal striping.
[image:1.595.317.549.318.524.2]1.1.2Mechanism of Thermal stripping phenomenon
Fig. 1.1: Mechanism of thermal striping phenomena
© 2017, IRJET | Impact Factor value: 5.181 | ISO 9001:2008 Certified Journal | Page 1642 Thermal striping phenomenon will be simulated
by experimentally and in CFD analysis process, for experimentation an experimental set up is fabricated and the results from an experimentation is taken by data logger software by connecting to lap, results from the experiment recorded and this is the input values taken for CFD analysis, importing recorded valves in CFD we get output results.This both experimental valves and CFD analysis results are compared and finally power spectral analysis is carried out for three metals for utilization of this metals for future use in fast breeder reactors as inner core, The condition for satisfying the utilization of metals as inner core is that the metals should not exceed the frequency(0.1-10)Hz, the frequency of oscillations while doing operation should be in between (0.1-10)Hz. if the frequency is satisfied then that metals stated as that metal is capable for future use as inner core metal fast breeder reactor
1.1.3 Analysis of thermal stripping phenomenon
Thermal stripping is random temperature fluctuation produced by the incomplete mixing of fluid streams at differing temperatures. Structures exposed to such temperature fluctuations may suffer thermal fatigue damage. For an engineering component containing a defect and situated in such a flow, the stress intensity factor (SIF) and strain energy density factor associated with the defect, will fluctuate in response to the imposed component surface temperature fluctuations
Thermal striping fatigue damage has the potential to Occur in a number of areas where there is good heat transfer between fluid and component. It can arise in certain liquid metal-cooled fast breeder reactor structures, notably those situated above the core, because of the large temperature differences (up to about 100 ◦C) which exist between liquid sodium emerging from both the core and the breeder sub-assemblies. Other areas of potential occurrence include piping systems in pressurized and boiling water reactors where hot and cold flows meet. Thermal stratification can occur in horizontal pipes and high-cycle temperature fluctuations can be observed at the interface between the flows. This may result in thermal fatigue cracking on the inside of the pipe at the interface of the fluids. ‘T junctions’ in piping systems is another area of potential thermal striping fatigue damage.
In the first phase, Thermal hydraulics analysis, in which the fluid temperature oscillation is predicted and frequency of fluctuation is found. The second phase is thermo-structural analysis, in which the structural response is predicted by taking the fluid temperature frequency of oscillations from the thermal hydraulic analysis.
1.1.4 Problem description
To predict thermal striping phenomena on core cover plate of a control plug and converting that to a basic and
[image:2.595.310.578.162.300.2]simplified model i.e., parallel water jet model in which rectangular plate simulates the core cover plate of the control plug and two water jet nozzle simulates the coolant coming out of subassemblies (SA) and also to examine the effect of length, velocity, gap between the nozzle and outlet height on thermal striping.
Fig. 1.2: Thermal striping phenomena in the vicinity of core cover plate
Show the pattern of fluctuations at different locations of pool type reactor in thermal striping phenomenon and shows different places of thermal striping
OBJECTIVES
To predict fluctuation at the bottom of test plate specimen in mixing zone region.
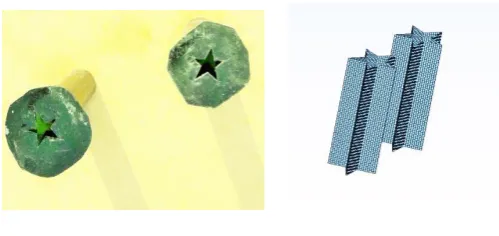
To study the effect of different nozzle ends (Trapezoidal and star).
To study the capacity of metals(copper, steel, brass) as inner core in reactors for future use by spectral density analysis
Modeling /Simulation for the system.
2. Experimental analysis
TOP VIEW SIDE VIEW
[image:2.595.308.558.583.701.2]© 2017, IRJET | Impact Factor value: 5.181 | ISO 9001:2008 Certified Journal | Page 1643
[image:3.595.35.284.85.222.2]
TOP VIEW SIDE VIEW
Fig. 2.1.2.Trapezoidal nozzle
Above Two nozzles are used in this project
This are the two pairs of nozzles are made of steel sheets of carbon alloy as per our dimensional requirement, these two nozzles are placed at the bottom of parallel water jet box, one nozzle is used as cold stream fluid flow and the another nozzle is used for hot stream fluid flow, each cycle of experiment One pair of nozzles are taken for the selected test plate specimen
Three types of test plate specimen are taken for this project they are
1. Copper 2. Steel 3. Brass
Fig. 2.1.3. COPPER
[image:3.595.309.568.90.200.2][image:3.595.30.568.249.779.2]
Fig. 2.1.4. Steel test plate
Fig. 2.1.5.Brass test plate
As per the thermal conductivity and availability of metals, these three metals are taken for experiment
PROPERTY COPPER STEEL BRASS
Thermal
conductivity,w/Mk 379.0 128.1 67.5
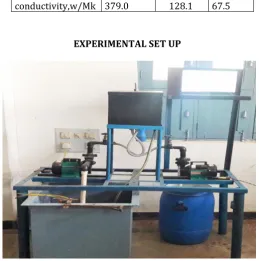
EXPERIMENTAL SET UP
Fig. 2.1.6. ENTIRE SET UP OF EXPERIMENT
Main parts in this entire set up are:
Parallel water jet box
Pumps
Control valves
Hot water tank and cold water tank
Data logger
[image:3.595.306.566.315.577.2]© 2017, IRJET | Impact Factor value: 5.181 | ISO 9001:2008 Certified Journal | Page 1644 Thermal striping phenomenon is carried out inside the
parallel water jet box with dimensions 300x200x300mm on the test plate by mixing two non-isothermal jets coming out of the parallel nozzle. M-seal sealant and Araldite epoxy resin are used to avoid the leakages within the box. The centrifugal pump having the capacity of 0.5HP each is used to pump hot and cold water from their respective tank. The hot water tank is having the capacity of 200 liters and is well stirred to gain uniform temperature. The temperature drop is found to be 15 min / °C. The maximum experiment duration is 2 minutes so that the tank is well enough to maintain the required temperature during the experiment. The cold water tank with the capacity of 100 liters is used and water is filled till the cooling system copper tube coils is immersed completely in water to avoid temperature drop ice flakes are used to maintain it to the required temperature. The length of the test plate is varied by using screw mechanism. The thermocouple is placed in the test plate by making a hole. The Test plate is adjusted to bring the thermocouple exactly at the middle of the two nozzles. The Thermocouple is fixed to the data logger and then by using data logger software configuration is set and the input is detected and time of recording is set in the scan button and quick graphs are obtained and finally, it is exported to the excel spread sheet format. Those output time and graphs are the outputs for the CFD Analysis
[image:4.595.309.567.86.580.2]INPUT EXCEL GRAPHS FOR CFD ANALYSIS:
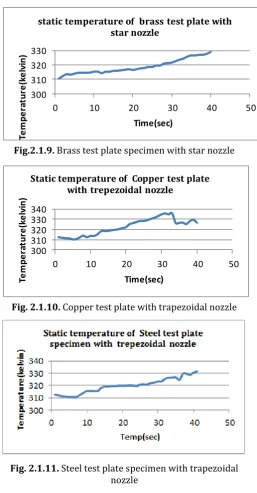
Fig. 2.1.7. Copper test plate with star nozzle
Fig. 2.1.8. Steel test plate specimen with star nozzle
300 310 320 330
0 10 20 30 40 50
Te m p e ra tu re (k e lv in ) Time(sec)
static temperature of brass test plate with star nozzle
Fig.2.1.9. Brass test plate specimen with star nozzle
300 310 320 330 340
0 10 20 30 40 50
Te m p e ra tu re (k e lv in ) Time(sec)
[image:4.595.36.565.349.721.2]Static temperature of Copper test plate with trepezoidal nozzle
Fig. 2.1.10. Copper test plate with trapezoidal nozzle
Fig. 2.1.11. Steel test plate specimen with trapezoidal nozzle
[image:4.595.41.298.427.722.2]© 2017, IRJET | Impact Factor value: 5.181 | ISO 9001:2008 Certified Journal | Page 1645
Experimental procedure
The thermal striping experiments are conducted in the following sequence.
1. Initially, the required nozzles velocity is fixed by measuring the flow rate. The control valve is fixed in this position for a particular velocity.
2. Water is heated in hot water tank up to 950C. The
water is stirred periodically to achieve the uniform heating. The temperature of the water is continuously monitored using a thermocouple as the temperature of the steam coming is very high to measure with the thermometer.
3. Water is cooled in cold water tank up to 50C and ice
flakes are to maintain it to the required temperature. The water is stirred periodically to achieve the uniform cooling. The temperature of water in continuously monitored using a thermometer.
4. After attaining the required temperature i.e., hot water 95ºC and cold water 5 ºC, the heating and cooling are stopped and pumps are switched on.
5. Water jets coming out of the nozzles are allowed to hit on the test plate and wait till the test plate is completely immersed in the water.
6. After 1 minutes temperature data of thermocouple is recorded using data logger and stored in computer excel sheet.
7. The above procedure is repeated for different nozzles (star and trapezoidal).
8. Changing one parameter at a time and keeping other parameters constant, above procedure is repeated.
3. CFD analysis
Computational fluid flow analysis will be completed By following 3 types of the process they are
a. Creating the geometry model/Mesh b. Defining the physics of model c. Visualizing the results
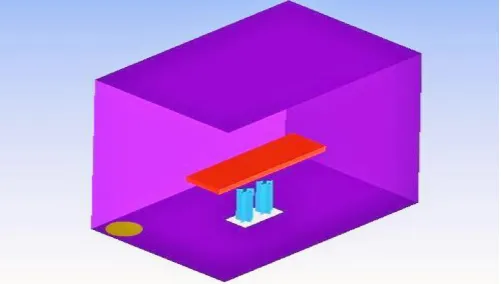
[image:5.595.309.572.91.228.2](a)Creating the geometry model
Fig 3.1.1 Geometry model of star nozzle with test plate in Ansys
Fig. 3.1.2 Arrangement of Assembly of star nozzle with test plate specimen
Different Parts assembled in above figure are
i. Nozzle
ii. Test plate specimen iii. Parallel water jet box
For this assembly of star nozzle, we are using different test plates specimens like
Copper Steel
brass
3.1 CFD analysis on Copper test plate specimen
with Star nozzle
The above- meshed geometry is imported into CFD and input values are given for analysis
[image:5.595.309.560.274.416.2]© 2017, IRJET | Impact Factor value: 5.181 | ISO 9001:2008 Certified Journal | Page 1646 300
320 340 360
0 10 20 30 40 50
Tem
p
er
atu
re(k
el
vi
n
)
Time(sec)
Static temperature of copper test plate specimen with star nozzle
Fig.3.1.3: Input valves for CFD Analysis of copper test
plate specimen with star nozzleResults from CFD analysis for copper test plate with star nozzle
Fig.3.1.4 Static temperature at the bottom of copper test plate specimen (309-352) Kelvin
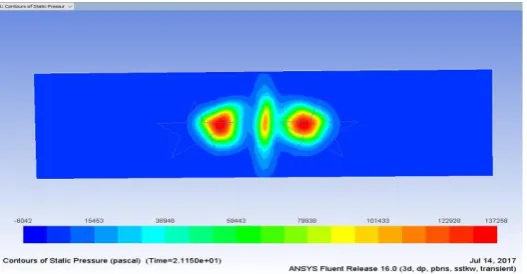
Fig.3.1.5 Static pressure at the bottom of copper test plate specimen (44935-105095) Pascal’s
Fig.31.6 Fluid flowing with velocity inside water jet box copper test plate specimen with star nozzle (5-12)
m/s
Above analysis values are stated below for Copper test plate specimen with star nozzle
AT Max static temp = 352 Kelvin
Max static pressure = 105095 Pascal’s Max velocity of flow of water = 15 m/s
Above Max static temp, Max static pressure, Max
velocity is converted into Power Spectral density,
Power spectral density is nothing but which is calculated by Max static temp, Max static
pressure, Max velocity of flow of fluid inside water jet box
Power spectral density factor is defined as the range of frequency oscillations under which thermal striping occur is found to be (0.1 – 10) Hz
The frequency(0.1-10) Hz is taken by drawing graph with power density and frequency range(01-10)Hz
If the resulted frequency is other than (0.1-10)Hz then it is said that the test plate specimen avoided from thermal stripping phenomenon
Maximum frequency from the graph is taking as power spectral density factor
Here for copper test plate specimen CFD analysis valves are taken and tested for power spectral density factor
© 2017, IRJET | Impact Factor value: 5.181 | ISO 9001:2008 Certified Journal | Page 1647 Fig 3.1.7 Power density factor for copper test plate
specimen
OUTPUT MAXIMUM FREQUENCY IS 0.0028 HZ
This frequency is other than (0.1-10)Hz
This copper test plate is recommended for the using as inner core metal but the life of this copper is very less due to weak mechanical properties
3.2 CFD analysis on Copper test plate specimen
with Star nozzle
Fig3.1.8 Steel test plate specimen with star nozzle
Fig.3.1.9 Bottom Static temperature of a steel Test plate specimen with star nozzle(310-332) kelvin
Fig.3.1.10 Bottom Static pressure of a steel Test plate with star (36978-101488) Kelvin
Fig3.1.11 Fluid flowing with velocity inside water jet box for steel test plate specimen with
star nozzle (4- 15) m/s
Above analysis, values are stated below for Steel test plate specimen with star nozzle
AT Max static temp = 352 Kelvin Max static pressure = 105095 Pascal’s
Max velocity of flow of water = 15 m/s Above Max static temp, Max static pressure, Max velocity is converted into Power Spectral density and the graph is drawn
Fig.3.1.12 Steel plate specimen power spectral density OUTPUT MAXIMUM FREQUENCY IS 0.0025 HZ
This frequency is other than (0.1-10)Hz
[image:7.595.310.574.88.225.2]© 2017, IRJET | Impact Factor value: 5.181 | ISO 9001:2008 Certified Journal | Page 1648
3.3 CFD analysis on steel test plate specimen
with Star nozzle
Fig.3.1.13 Brass test plate specimen with star nozzle
Fig.3.1.14 Bottom Static temperature of a copper Test plate with star nozzle(305-351) Kelvin
Fig.3.1.15 Bottom Static pressure of a copper Test plate with star nozzle (44984-105104) Pascal
Fig.3.1.16 Fluid flowing with velocity inside water jet box for steel test plate specimen with star nozzle
11) m/s
Above analysis, values are stated below for Brass test plate specimen with star nozzle
AT Max static temp = 352 Kelvin Max static pressure = 105095 Pascal’s Max velocity of flow of water = 15 m/s
Above Max static temp, Max static pressure, Max velocity is converted into Power Spectral density and the graph is drawn
Fig.3.1.17 Brass test plate power spectral density
OUTPUT MAXIMUM FREQUENCY IS 0.0026 Hz
This frequency is other than (0.1-10)Hz
© 2017, IRJET | Impact Factor value: 5.181 | ISO 9001:2008 Certified Journal | Page 1649
3.4 CFD analysis on Brass test plate specimen
with Star nozzle
300 310 320 330 340
0 10 20 30 40 50
Te
m
p
e
ra
tu
re
(k
e
lv
in
)
Time(sec)
Static temperature of Copper test plate with trepezoidal nozzle
Fig3.1.18 Copper test plate with trapezoidal nozzle
Fig.3.1.19 Bottom Static temperature of a Copper Test plate with trapezoidal nozzle(309-351) kelvin
Fig.3.1.20 Bottom Static pressure of a Copper Test plate with trapezoidal nozzle (38144-109010)
Pascal’s
Fig.3.1.21 Fluid flowing with velocity inside water jet box for copper test plate specimen with Trapezoidal nozzle (3-13) m/s
Above analysis, values are stated below for Copper test plate specimen with star nozzle
AT Max static temp = 352 Kelvin
Max static pressure = 105095 Pascal’s Max velocity of flow of water = 15 m/s
Above Max static temp, Max static pressure, Max velocity is converted into Power Spectral density and the graph is drawn
Fig.3.1.22 Copper plate specimen power spectral density
OUTPUT MAXIMUM FREQUENCY IS 0.0001 Hz
This frequency is other than (0.1-10)Hz
© 2017, IRJET | Impact Factor value: 5.181 | ISO 9001:2008 Certified Journal | Page 1650
3.5 CFD analysis on Copper test plate specimen
with Trapezoidal nozzle
Fig.3.1.23 Steel test plate specimen with trapezoidal nozzle
Fig.3.1.24 Bottom Static temperature of a Steel Test plate with trapezoidal nozzle(303-353) Kelvin
Fig3.1.25 Bottom Static pressure of a Steel Test Plate with trapezoidal nozzle (37710-1086259)
Pascal’s
Fig3.1.26 Fluid flowing with velocity inside water jet box for Steel test plate specimen with Trapezoidal
nozzle (3-14) m/s
Above analysis, values are stated below for Copper test plate specimen with star nozzle
AT Max static temp = 352 Kelvin
Max static pressure = 105095 Pascal’s Max velocity of flow of water = 15 m/s
Above Max static temp, Max static pressure, Max velocity is converted into Power Spectral density and the graph is drawn
Fig.3.1.27 Steel plate specimen power spectral density
OUTPUT MAXIMUM FREQUENCY IS 0.0025 HZ
This frequency is other than (0.1-10)Hz
© 2017, IRJET | Impact Factor value: 5.181 | ISO 9001:2008 Certified Journal | Page 1651
3.6 CFD analysis on Steel test plate specimen
with Trapezoidal nozzle
Fig3.1.28 Brass test plate specimen with trapezoidal nozzle
Fig3.1.29 Bottom Static temperature of a brass Test plate with trapezoidal nozzle(301-347) kelvin
Fig3.1.30 Bottom Static pressure of a brass Test plate with trapezoidal nozzle(3741-102816) Pascal
Fig.3.1.31 Fluid flowing with velocity inside water jet box for Brass test plate specimen with trapezoidal
nozzle (5-13)m/s
Above analysis, values are stated below for Copper test plate specimen with star nozzle
AT Max static temp = 347 Kelvin Max static pressure = 102816 Pascal’s
Max velocity of flow of water = 13 m/s Above Max static temp, Max static pressure, Max velocity is converted into Power Spectral density and the graph is drawn
Fig3.1.32 Brass plate specimen power spectral density
OUTPUT MAXIMUM FREQUENCY IS 0.0001 HZ
This frequency is other than (0.1-10)Hz
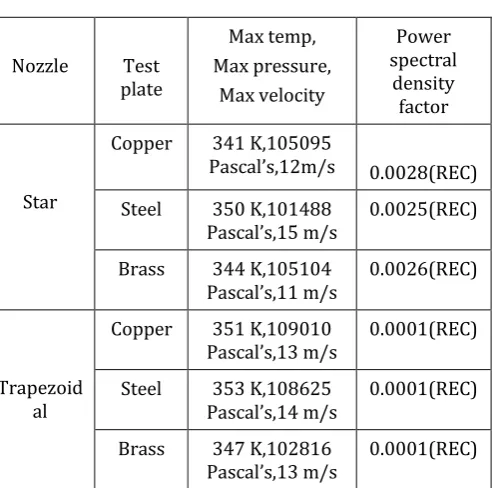
© 2017, IRJET | Impact Factor value: 5.181 | ISO 9001:2008 Certified Journal | Page 1652 Nozzle Test
plate Max temp, Max pressure, Max velocity Power spectral density factor Star
Copper 341 K,105095
Pascal’s,12m/s 0.0028(REC)
Steel 350 K,101488
Pascal’s,15 m/s 0.0025(REC) Brass 344 K,105104
Pascal’s,11 m/s 0.0026(REC)
Trapezoid al
Copper 351 K,109010
Pascal’s,13 m/s 0.0001(REC) Steel 353 K,108625
Pascal’s,14 m/s 0.0001(REC) Brass 347 K,102816
[image:12.595.42.289.81.325.2]Pascal’s,13 m/s 0.0001(REC)
Table 3.2.1 Comparison of power spectral density factor for different nozzles with different test plate specimens
*(REC)=RECOMMENDED FOR USING TEST PLATE SPECIMEN AS INNER CORE MATERIAL IN LMFBR REACTORS
4. CONCLUSION
The major results are summarized as follows
1. Copper test plate specimen with star nozzle at Maximum static temperature
AT
Max static temp = 352 Kelvin Max static pressure = 105095 Pascal’s Max velocity flow of water = 15 m/s For this given input values in CFD analysis we got Power spectral density= 0.0001(Recommended)
2. Steel test plate specimen with star nozzle at Maximum
static temperature
AT
Max static temp = 350 Kelvin Max static pressure = 101488 Pascal’s Max velocity flow of water = 15 m/s For this given input values in CFD analysis we got Power spectral density factor = 0.0001 (REC)
3. Brass test plate with star nozzle at Maximum static temperature
AT
Max static temp = 344 Kelvin Max static pressure = 105104 Pascal’s Max velocity flow of water = 11 m/s For this given Input values in CFD analysis we got Power spectral density value = 0.0001 (REC)
4. Copper test plate specimen with Trapezoidal nozzle at Maximum static temperature
AT
Max static temp = 352Kelvin
Max static pressure = 105095 Pascal’s Max velocity flow of water = 15 m/s
For this given input values in CFD analysis we go Power spectral density value = 0.0028(REC)
5. Steel test plate specimen with trapezoidal nozzle at Maximum static temperature
AT
Max static temp = 351 Kelvin Max static pressure = 109010 Pascal’s Max velocity flow of water = 13m/s
For this given input values in CFD analysis we got Power spectral density value = 0.0025 (REC)
6. Steel test plate specimen with trapezoidal nozzle at Maximum static temperature
AT
Max static temp = 353 Kelvin Max static pressure = 1086259 Pascal’s Max velocity flow of water = 14 m/s For this given input values in CFD analysis we got Power spectral density value = 0.0026(REC)
*(REC)=RECOMMENDED FOR USING TEST PLATE
SPECIMEN AS INNER CORE MATERIAL
© 2017, IRJET | Impact Factor value: 5.181 | ISO 9001:2008 Certified Journal | Page 1653 5. REFERENCES
[1] Momin Mazaruddin, k.jayasimha “Effect of Triangular and Hexagonal Nozzle Ends in the Analysis of Thermal Striping Phenomenon Occurring in Liquid Metal Cooled Fast Breeder Thermal Reactors”
[2] C.Jeevan Kumar, Dr. B.Veerabhadra reddy “Effect of circular and Elliptical Nozzle Ends in the Analysis of Thermal Striping Phenomenon Occurring in Liquid Metal Cooled Fast Breeder Thermal Reactors”
[3] Chellapandi, P., Chetal, S.C., Raj, B., 2009, “Thermal striping limits for components of sodium cooled fast spectrum reactors,” Nuclear Engineering and Design, vol. 239 (12), pp. 2754-2765.
[4] Chellapandi, P., Velusamy, K., Biswas, A., Rama, R., Bhoje, S B., Vaidyanathan, G., Chetal, S C., 2002, “Thermal hydraulics and thermomechanical analysis of thermal striping in a mixing tee-junction of secondary sodium circuit of Phenix reactor, validation of fast reactor thermomechanical and thermohydraulic codes,” IAEA, Vienna (Austria), IAEA-TECDOC-1318.
[5] Choi, S.K., Wi, M.H., W D Jeon, and S O Kim, 2005, “Computational study of thermal striping in an upper plenum of KALIMER,” J. Nucl. Science and Tech., vol. 152(11), pp. 223-238.
[6] Jones, I.S., Lewis, M.W.J., 1994.” A frequency response method for calculating stress intensity factors due to thermal striping loads”. Fatigue & Fracture of Engineering Materials & Structures, vol. 17(6), pp. 709-720.
[7] Jung, J., Yoo, G J., 2004, “Analysis of unsteady turbulent triple jet flow with temperature difference,” J. Nucl. Science and Tech, vol. 41(9), pp. 931-942.
[8] Kimura, N., Nishimura, M., Kamide, H., 2002, “Study of convective mixing for thermal striping phenomena. Experimental analyses on mixing process in parallel triple jet and comparisons,” Int. J. JSME, Series B, vol. 45(3), pp. 592-599.
[9] Nishimura, M., Tokuhiro, A., Kimura, N., Kamide, H., 2000 “Numerical study on mixing of oscillating quasi- planar jets with LRSFM equation models,” J. Nucl. Eng. and Design, vol. 202(11), pp. 77-95.