© 2016, IRJET | Impact Factor value: 4.45 | ISO 9001:2008 Certified Journal
| Page 1
Classification and Characterization of Solid Waste – Case Study of
Egerton University and its Environs, Kenya
Nyoti Stephen G. Mugo
1, Nyaanga D.M.
2, Owido S. F. O
3, Owino George O.
4and Muniu John M.
51
Department of Industrial and Energy Engineering, Egerton University, P.O.BOX 536-20115, Egerton. Kenya. Email
[email protected]
2
Professor, Department of Agricultural Engineering, Egerton University e-mail [email protected]
3Professor, Department of Crops, Horticulture and Soil, Egerton University e-mail [email protected]
4Doctor,
(Ph.D) Industrial and Energy Engineering, Egerton University e-mail [email protected]
5
Department of Electrical and Control Engineering, Egerton University e-mail [email protected]
---***---Abstract -
The classification and characterization of solidwaste is important in order to plan for long term and design solid waste management of efficient and economical systems. Such systems includes the selection and operation of equipment for treatment and handling of waste, types of disposal facilities that will allow energy generation and resource recovery. The major waste management problems identified from Egerton University and its environs were poorly designed collection bins, inappropriate bin locations, inadequate labour for collection and transportation of waste lack of appropriate waste treatment and disposal facilities. Wastes were classified into four different categories as per their sources which were domestic/ residential, agricultural, institutional/industrial and commercial. Wastes were characterized based on Moisture Content (MC), ash content, Volatile Matter (VM), fixed carbon, density and calorific value. The MC was obtained by weighing a container when empty and with waste sample, placing it in a drier for 12 hours at 102oC and reweighing it when cold. The VM was determined by
putting a sample into weighed crucible, placing it into a furnace at 950oC for 10 minutes and recording the weight
when cold. The mean values of various parameters were: moisture content 37%, ash content 12%, volatile matter 42%, fixed carbon 9%, density 232kg/m3, and calorific values
10MJ/kg. Since the waste had high calorific values and volatile matter, then it could be used for waste to energy methods.
Key Words: Ash content, Calorific value, Characterization, Classification, Density, Moisture content, Solid waste and Volatile matter.
1.
INTRODUCTION
Solid waste include but not limited to polythene papers, use plastics, rubber, old automobile tyres, old dresses, cotton pieces, skin pieces, leather, charcoal, old newspapers, junk mail, duplicating papers, charts, today’s meal scraps, rotten fish, vegetable peelings, rice husk, wheat husk, maize cobs, sawdust, animal manure, grass clippings, street sweepings,
rotten seeds grains, dust, broken furniture, sewage sludge and abandoned materials. The composition of waste is influenced by external factors such as geographical location, the population’s lifestyle, energy sources and weather as reported by Katiyar et al. 2013 [1], Arsad et al. 2006 [2] and Zekkos et al. 2010 [3]. Solid waste management activities include; waste segregation, collection, transportation, treatment and disposal. Waste management standards is still poor and outdated in many developing countries, with poor waste generation rates documentation and its composition, inefficient storage and collection systems, disposal of wastes with toxic and hazardous (Ayub et al., 2013 [4]). The various waste disposal methods used are open dumping, recycling, landfilling, composting, and incinerating. Waste recycling which includes photocopying papers, plastics, can, glass, aluminum and other metals is cheap and saves resources, money, energy and reduces emissions (Omari, 2015 [5], Henry et al., 2006 [6]). Some of the medical wastes find their way into open dump sites which may results to scavengers retrieving items and reusing, leading to serious health implications due to the transmission of infectious disease. However, if waste contains large fraction of plastics, polythene papers which are non-decomposable and medical waste which are hazardous then, incineration is better disposal method as reported by Chang et al. 2008 [7] and Ansah, (2014) [8] .
© 2016, IRJET | Impact Factor value: 4.45 | ISO 9001:2008 Certified Journal
| Page 2
Waste characterization is a major factor in the wastemanagement system. It is considered as a basis for the design of efficient, cost effective and environmentally compatible waste equipment. The percentage components in waste to be combusted must be determined on the basis of waste characterization analysis (Beck, 2005 [12]; Chang et al., 2008 [7]; Alhassan and Tanko, 2012 [13]). The primary purposes for waste characterization are: data becoming basis for planning economic analysis, design and subsequent management and operation of a disposal system or material energy resource recovery facilities; rehabilitation or retrofit of facilities; plant optimization and emission monitoring as noted by Oumarou et al. (2012) [14]. The waste composition must be known in order to select the most economical collection means, plan for suitable sanitary landfill sites, design and operate an efficient incineration plant, design compositing plant or grinding plant, forecast accurately the cost and efficiency of operation when choosing a particular method of disposal and finally forecast future demand (Aguilar-Virgen et al., 2010 [15]).
This study focused on the classification and characterization of solid waste in Egerton University and its environs within 2015-2016 period, for the purpose of choosing the best and appropriate waste treatment and disposal options. The solid waste is classified into two major groups which are the sources-based and types. The waste were classified into four different groups according to the waste sources-based which included domestic/residential, agriculture, institution/industrial and commercial. The waste type-based classification consider the physical, chemical, and biological characteristics of wastes. This included garbage, ashes/residues, combustible/non-combustible, bulky wastes, street wastes and biodegradable/non-biodegradable wastes. The parameters considered for waste characterization included moisture content, ash content, volatile matter, fixed carbon, density and calorific values determine in order to understand the elemental components of sample.
2.
MATERIALS AND METHODS
2.1
Study Area and Materials Preparations
The waste sampling and experiments were carried out from the month of May to August, 2015 at Egerton University and its environs. The average ambient temperatures ranged between 19-24°C. The research was done at Egerton University in the Department of Agricultural Soils and Animal Science Nutritional Laboratories. Solid waste samples were collected from the University dumping site (student cafeterias, departments of crops, Horticulture and Soil, Animal Health, Human Anatomy, Medical) and neighbouring residential estates (Njokerio, Ngondu, and Green Valley). The solid waste samples were obtained from collection bins. Waste samples were prepared by drying for three days, chopped into small pieces and packed separately as per their types. The samples were reduced further to less than 1mm size to form a homogenous material in order to increases surface area which would allow easier heat penetration. Theywere then packed, labelled and stored in sealable polythene bags to prevent any changes in their physical and chemical properties.
2.2
Classification of solid waste
Solid wastes are the organic and inorganic waste materials which includes both heterogeneous wastes from the urban and rural community as well as a more homogeneous accumulation. Wastes are classified on the basis of source of generation and type. The solid wastes sources and types as well as composition and the rate at which they are generated/disposed is essential for the design and operation of the functional elements associated with waste management system.
The study used the source-based classification which included the domestic/residential, agricultural, institutional and commercial wastes. Domestic/residential wastes are from household, dwellings, apartments and consists of leftover food, vegetable peels, old clothes and ashes. Agricultural waste consists of spoiled food grains and vegetables, agricultural remains and litters generated from fields, orchards, vineyards and farms. Institutional wastes mainly consists of photocopying papers, polythene papers, and plastic generated from administrative and public buildings such as research institutes, hospitals, offices, schools, colleges, universities and other educational centers. Commercial wastes consisting of leftover food, glasses, metals, ashes, polythene papers and plastics generated from stores, restaurants, markets, hotels, motels, shops and supermarkets stores, offices, hotels, shops, lodges, restaurants, business centers, warehouses, markets, slaughter houses and other commercial establishments. The wastes were manually separated out and placed into polythene bag corresponding to their categories or types. The weight of each of these sorted wastes was obtained and their average taken. These waste had the potential for recycling if they were sorted out from source as done in developed nations.
2.3
Characterization of solid waste
The percentage of the components in the wastes were determined on the basis of characterization. The wastes were characterized into two major groups which were physical and combustion characterization. The results of waste characterization were represented in the Table 3.1.
2.3.1
Physical characterization of solid waste
© 2016, IRJET | Impact Factor value: 4.45 | ISO 9001:2008 Certified Journal
| Page 3
a)
Moisture contents
In the wet-weight method of measurement, the MC in a sample was expressed as a percentage of the weight of the material when wet whereas in the dry-weight method, it was expressed as a percentage of the weight of the material when dry. The study used the dry-weight method. The moisture content was determined according to ASTM E871-82 [16] standard. An empty container was preheated for twenty minutes and then fifty grams of waste sample was quickly put into the container. The sample was placed in an oven at temperature 102°C for twelve hours and then cooled to room temperature and reweighed. The difference in weight represents the moisture content of the sample expressed in percentage. These MC in the samples were calculated using equation 3.1
(3.1)
Where, M = moisture content in percentage (%), S = weight of sampled waste in grams, B = weight of sampled waste after heating in grams.
b)
Density
The density of a sample was carried out as follows: the weight of an empty container of known volume V1 was taken
and recorded as W1. The waste sample was placed into the
container until it overflowed. The contents in the container was settled by dropping it three times from a height of 20cm and the volume topped up with the remainder of the sample. If insufficient material which could not fill-up the container then, the unoccupied container volume V2 would be
measured. The weight of the container and its contents was taken and recorded as W2. For the filled-up container, the
density in kg/ m3, was calculated using equation 3.2
(3.2)
For a partially-filled container, the density in kg/ m3, was
calculated using equation 3.3
(3.3)
2.3.2
Combustion solid waste characterization
The combustion characterization was done in order to estimate the heating value of solid waste. It was done to determine parameters like volatile matter, ash content, fixed carbon and calorific value as shown in the Table 3.1.
a)
Volatile matter
The volatile matter was determined according to ASTM E872-82 Standard [17]. A twenty grams of sampled waste
was weighed and recorded before placing it in a weighed crucible. The crucible was covered to avoid contact with air during devolatilization. The crucible and sample was then placed in the muffle furnace chamber, power switched on and its temperature maintained at 950°C for ten minutes. The crucible was then removed and cooled to a room temperature. The crucible weight was recorded without disturbing the cover. Volatile matter calculation was determined using equation 3.4.
(3.4)
Where, V = volatile matter in percentage,
A = weight of sampled wastes before heating in grams, B = weight of waste after heating in grams,
M = moisture contents determined from equation 3.1.
b)
Ash content
Ash content of solid waste is the non-combustible residue left after waste is burnt. The ash content was determine using
E1534-93 standard
[18]. A twenty grams of sampled waste was placed into a weighed and uncovered crucible, then placed into the muffle furnace. The power was switched on and the temperature maintained at 725°C for one hour. The crucible and its content was removed from the furnace and weight recorded after it cooled. Ash content was determined using equation 3.5.(3.5)
Where, AS = ash content percentage,
A = weight of container and ash residue grams. B = weight of empty container grams,
C = weight of sampled waste used (with moisture content)
c)
Fixed carbon
The fixed carbon of a fuel is the percentage of carbon available for char combustion. Fixed carbon gives an indication of the proportion of char that remains after the devitalization phase. The fixed carbon was calculated by subtracting the sum of moisture, ash and volatile matter from 100 percent. It contains the errors and scatter of the other three measurements and is regarded as an approximate figure. Fixed carbon content was calculated using equation 3.6.
(3.6)
Where FC = fixed carbon %, M = total moisture %
V = volatile matter %, AS = ash content %.
d)
Calorific value
© 2016, IRJET | Impact Factor value: 4.45 | ISO 9001:2008 Certified Journal
| Page 4
determined using standard Auto bomb calorimeter type E2KCombustion Calorimeter System. The waste samples were dried and ground into small particles which were later sieved and compressed to form pallets. A reaction vessel containing the samples and excess pure pressurized oxygen at 30bars was immersed in a water bath at ambient conditions of 22oC. The firing circuit was tested and the
calorimeter was adjusted by weighing sufficient water into the calorimeter vessel to submerge the bomb completely. The energy released by the complete combustion of the reactants within the vessel was absorbed by water bath, and caused the water jacket temperature to rise. A pure compound of a known heating value like benzoic acid was burned in order to obtain a thermal response, or water equivalence, of the apparatus to a particular heat release. In this experiment, the water equivalence W was determined using the tablet of benzoic acid. The CV of the waste were calculated according to ASTM D240-02 Standard [19] and the value of W was determined from the equation 3.7.
(3.7)
Where; POC = Calorific value of reference substance;
MC = weight of the reference substance
RY = correction of formation of sulphuric acid;
Rz = sum of all the extraneous quantities of heat.
Using a constant-volume oxygen bomb calorimeter, heating value of solid sample was calculated using equation 3.8.
(3.8)
Where W = water equivalent, kJ/oC; ΔT = temperature rise oC
D1 = correction heat of formation of nitric acid;
D2 = correction heat of formation of sulfuric acid
D3 = combustion of gelatin capsule used with liquid testing
D4 = heat combustion of firing wire; m = weight of sample, g
HV = heating value of fuel in kJ/kg
3.
RESULTS AND DISCUSSION
This section includes the results of waste classification, characterization which included moisture contents, density, volatile matters, ash contents, fixed carbon and calorific value. The graphs were generated from summary results of the statistical data. Waste characterization experiments were repeated three times and graphs were discussed from the means, standard deviation and the Least Significantly Different (LSD).
3.1 Solid Waste Classification and Characterization
The waste were classified into four different groups which were domestic/ residential, agricultural, institutional/ industrial and commercial. Wastes characterization are
important in evaluating alternative equipment needs, systems, management program and plans especially with respect to the implementation of waste disposal, energy and resource recovery options. Table 4.1 shows the classification and characterization of solid waste. If waste sorting was done at the source and recycling carried out, then some of the incineration problems would be solved. Karak et al.
[image:4.595.312.568.298.483.2](2011) [20] reported that recycling paper, plastics, glass and metal could reduce the cost of incineration and emission control. The study also revealed that scavengers hamper the collection process from the waste bins by salvaging for recyclables and scattering the waste creating unaesthetic environment. The scavengers include human being and the animals like dogs, donkeys and vultures. It was also observed that some residents poured waste water into collection bins making it hard for the incineration processes.
Fig 3.1: Mixed wastes deposited in the collection bins
Table 3.1: Classification and characterization properties
Waste
Types MC % AC % VM % FC %
Densit y kg/m3
CV MJ/k g Domestic /
Residential
waste 55.69 12.33 26.66 5.32 307.64 4.26 Agricultura
l waste 39.44 15.59 36.46 8.51 251.83 7.67 Institutiona
l/
industrial waste
9.02 7.88 68.16 14.94 85.52 16.87
Mixed solid
waste 34.72 11.94 43.76 9.58 228.58 10.27 Commercia
l waste 46.51 14.37 32.75 6.37 284.34 12.65 Average
[image:4.595.305.584.520.756.2]© 2016, IRJET | Impact Factor value: 4.45 | ISO 9001:2008 Certified Journal
| Page 5
[image:5.595.316.564.374.550.2]3.1.1
Moisture Content
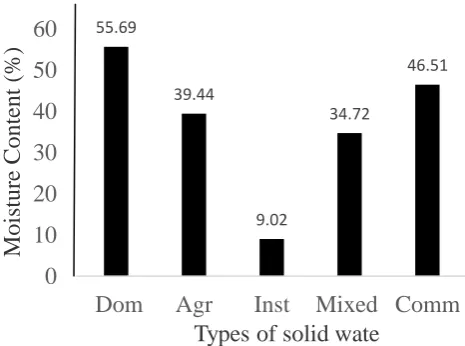
Figure 3.2 shows the effect of Moisture Content (MC) for different types of solid wastes. The MC is used to determine the quality for different types of waste as a fuel. Domestic/ residential waste yielded the highest MC of 55.69% by weight followed by commercial which gave 46.51%, agricultural gave 39.44% and mixed waste gave 34.72%. Institutional waste, since they contained high percentage of polythene papers and plastics and do not absorbed water from atmosphere making it to dry faster under the sun, yielded the lowest MC of 9.02%. The result of MC for commercial waste agreed with the findings by Das and Bhattacharyya, (2013) [21] who reported that municipal solid waste at Kolkata, India in 2010 gave MC of 46% by weight. The results also agreed with the findings by Chang et al. (2008) [7] who reported that MC for solid waste from Taiwan ranged from 37.6 to 65.9%. The results fulfilled the required values for fuel incineration without auxiliary, which should not exceed MC of 50% as reported by Medina et al.,
(2013) [22]. The results differed slightly with the findings by Katiyar et al. (2013) [1] who noted that MC of municipal waste varied from 24.3 to 42.2% in Bhopal, India. The results also differed slightly with the findings by Yildiz et al. (2012) [23] who noted that the urban waste for developed countries gave MC values ranging from 15 to 40%. The results differed with the findings of Omari, (2015) [5] who noted that the MC for Arusha municipal waste ranges from 55.7 to 64.03% by weight. The results also differed with the findings by Alhassan and Tanko, (2012) [13] where they reported that the MC for municipal waste from Nigeria gave 10.25%. Therefore, to produce fuel with good properties and to ensure the sustainability of combustion, the waste had to be dried in oven as reported by Chen et al. (2014) [24]. The moisture content was calculated using equation 3.1
55.69
39.44
9.02
34.72
46.51
0
10
20
30
40
50
60
Dom
Agr
Inst
Mixed Comm
Moi
sture
C
ontent (
%
)
Types of solid wate
Fig 3.2: Moisture content for different types of wastes
3.1.2
Density of wastes
Figure 3.3 shows the density of different types of solid waste. Density is necessary for proper waste management
practices such as collection, storage, transportation and for designing the disposal facilities. Density varies with waste compaction, composition and decomposition. The domestic/ residential waste yielded the highest density of 307.64kg/m3, since it contained ash residues from jikos,
cooked food and vegetable peelings, agricultural waste gave 238.49kg/m3 and mixed waste (228.58kg/m3). The
institutional waste yielded the lowest density of 85.52kg/m3
while the commercial yielded a density of 284.38kg/m3. The
commercial waste results agreed with findings by Sivapalan
et al. (2002) [25] who noted that the municipal solid waste in Kuala Lumpur gave the density ranging from 120 to 330 kg/m3. The results also agreed with the findings by
Ogwueleka, (2009) [26] who reported that the density for municipal waste generated in some cities in Nigeria ranged from 280 to 340kg/m3. The results differed with the
findings by Katiyar et al. (2013) [1] who reported that municipal solid waste of Bhopal gave an average density of 314.9 kg/m3. The result also differed with the findings done
by Fobil et al. (2005) [27] who noted that municipal solid waste in the city of Accra gave the density ranging from 410 to 540 kg/m3. The waste density was calculated using
equation 3.2 and 3.3.
307.64
251.83
85.52
228.58
284.34
0
50
100
150
200
250
300
350
Dom
Agr
Inst
Mixed Comm
D
en
si
ty
(kg
/m
3
)
Types of Solid Wastes
Fig 3.3: Density for different types of solid waste3.1.3
Volatile Matters
[image:5.595.47.280.523.696.2]© 2016, IRJET | Impact Factor value: 4.45 | ISO 9001:2008 Certified Journal
| Page 6
charge. Loading an incinerator with high VM wastes, meantthat the heating values would exceed the designed thermal capacity of the plant. Also, high combustion temperatures due to high VM would damage the refractory lining, resulting into excessive emissions. Manyele and Kagonji, (2012) [28] noted that wastes with high VM would release more volatile gases at the primary chamber than wastes with low VM. The volatile matter was calculated using equation 3.5.
26.66
36.46
68.16
43.76
32.75
0
10
20
30
40
50
60
70
80
Dom
Agr
Inst
Mixed Comm
V
ol
ati
le M
att
er
(%)
[image:6.595.312.566.55.272.2]Types of Solid Wastes
Fig 3.4
: Volatile matters for different types waste
3.1.4
Ash Content
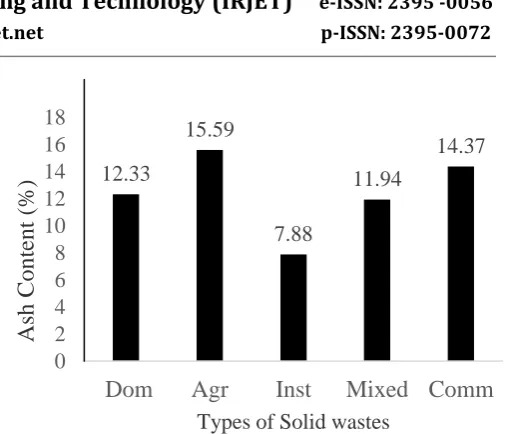
Figure 3.5 shows the Ash Contents (AC) of different types of waste. Agricultural yielded the highest AC of 15.59% by weight due cow dung followed by the domestic/residential which gave 12.33% and the mixed waste gave 11.94%. However, the institutional waste yielded the lowest AC of 7.88%. The commercial waste gave AC of 14.37% which agreed with the findings by Chang et al., (2008) [7] who reported that the AC from municipal solid waste in Taiwan ranged from 4.4% to 15.7%. The results also agreed with the findings by Katiyar et al., [1] who reported that the AC from municipal waste in Bhopal, India ranged from 9.7% to 22.93% by weight. Since the AC values were lower than 50%, which was considered optimal, then it would be possible to use incineration techniques without auxiliary fuels as waste final treatment as reported by De-Medina at el., (2013) [29]. The ash content was calculated using equation 3.5.
12.33
15.59
7.88
11.94
14.37
0
2
4
6
8
10
12
14
16
18
Dom
Agr
Inst
Mixed Comm
Ash C
on
tent
(
%)
Types of Solid wastes
Fig 3.5
: Ash content for different types of waste
[image:6.595.44.270.205.402.2]
3.1.5
Fixed Carbon
Figure 3.6 show Fixed Carbon (FC) from different types of waste. The institution/ industrial waste yielded the highest FC of 14.94%, followed by mixed waste which gave 9.58%, agricultural waste 8.51%, and the domestic/ residential waste 5.32% by weight. The commercial waste yielded the FC of 6.37% which agreed with the findings of Omari, (2015) [5] who reported that the FC from municipal waste in Arusha, Tanzania ranged from 1.72% to 7.02% by weight. The institutional waste results agreed with the findings by Oumarou et al., (2012) [14] where they reported that the municipal wastes in Northern cities of Nigeria had an average FC ranging from 10 to 16.62% by weight. The results differed with the findings of Katiyar et al., (2013) [1] who noted that the municipal wastes in Bhopal, India had an average FC of 9.5 % by weight. The fixed carbon was calculated using equation 3.6.
5.32
8.51
14.94
9.58
6.37
0
2
4
6
8
10
12
14
16
Dom
Agr
Inst
Mixed
Comm
F
ix
ed C
ar
bo
n (%)
Types of Solid Wastes
Fig 3.6
:
Fixed carbon of different types of solid waste3.1.6
Calorific value
[image:6.595.314.564.525.694.2]© 2016, IRJET | Impact Factor value: 4.45 | ISO 9001:2008 Certified Journal
| Page 7
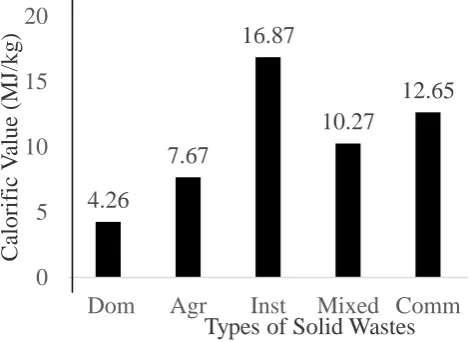
moisture, carbon and hydrogen contents in the waste andrepresents the amount of chemical energy in a given waste components as reported by Bujak, (2010) [30] and Kathiravale et al., (2003) [31]. The institutional waste yielded the highest Calorific Value (CV) of 16.87MJ/kg followed by mixed waste giving 10.27MJ/kg and agricultural waste gave 7.67MJ/kg. However, the domestic/residential waste yielded the lowest CV of 4.26MJ/kg. The commercial waste yielded CV of 12.65 MJ/kg which agreed with the findings by Khamala and Alex, (2013) [32] who reported that the CV for municipal solid waste from Nairobi, Kenya gave 12.48 MJ/kg. The result also agreed with the findings by Omari, (2015) [5] who reported that the CV for municipal wastes from Arusha, Tanzania gave 12.42MJ/kg. The results differed with the findings by Das and Bhattacharyya, (2013) [19] where they reported that the CV for municipal waste at Kolkata, India gave 5.03MJ/kg in the year 2010. The results also differed with the findings by Omari et al.,(2014)[33] who reported that the CV for municipal wastes of Arusha, Tanzania yielded 12MJ/kg. Oumarou et al., (2012) [14] recommended that the energy recovery would be possible with an addition supplementary fuel to the waste where CV had fallen below 9.5MJ/kg. The CV was calculated using equation 3.7 and 3.8.
4.26
7.67
16.87
10.27
12.65
0
5
10
15
20
Dom
Agr
Inst
Mixed Comm
C
alorific
V
alue (
MJ
/kg
)
[image:7.595.44.279.396.567.2]Types of Solid Wastes
Fig 3.7
: Calorific value of different types of waste
4. CONCLUSIONS
The solid waste classification and characterization of are major factors considered in the design of an efficient, cost effective and environmentally compatible waste management system. Inappropriate bin locations and poorly designed small-scale incinerators, lack of waste treatment and disposal facilities were identified as major problems. The wastes were classified into four main types which were domestic/residential, agricultural, institutional/industrial and commercial. The percentages of combusted components in the waste must be determined on basis of characterization analysis. The wastes were characterized into moisture contents, ash contents, volatile matters, fixed carbon, density
and calorific values and yielded mean values of 37.08%, 12.42%, 41.56%, 8.94%, 231.58kg/m3 and 10.34MJ/kg,
respectively. Since domestic/residential waste was organic and could retain water it yielded the highest MC of 55.69%, followed by commercial giving 46.51%, agricultural 39.44% and mixed waste gave 34.72%. Institutional/industrial waste yielded the lowest MC of 9.02% since it contained high percentages of polythene papers, plastics and rubbers which could not retain water. Agricultural yielded the highest ash content of 15.59% since it contained animal residues like cow dung, followed commercial (14.37%), domestic/residential (12.33%) mixed (11.94%) and institutional (7.88%). Institutional waste yielded the highest volatile matters of 68.12%, followed by mixed (43.73%), agriculture (36.46%), domestic/residential (26.66%) and commercial (32.75%). Institutional yielded the highest fixed carbon of 14.94%, followed by mixed (9.58%), agricultural (8.51%), commercial (6.37%) and domestic (5.32%). The average density of different types of waste was 231.58 kg/m3. Domestic waste yielded the highest density of 307.64
kg/m3 while the institutional gave the lowest density of
85kg/m3. The average calorific value of the waste in Egerton
University and its environs was determined at 10.34 MJ/kg. The calorific value varied from 4.26 MJ/kg for domestic to a maximum of 16.86 MJ/kg for institutional wastes. The calorific value may not be fixed due to the variations in the waste composition, as is the case with the fossil fuels. Since the waste had high calorific values and volatile matter, then it could be used for waste to energy methods though more research needed to be carried out during the wet spell.
REFERENCES
[1] R. Katiyar, S. Suresh and A. Sharma, “Characterisation of
municipal solid waste generated by the city of Bhopal, India,” International Journal of ChemTech Research vol.5, (2), 2013, pp. 623-628.
[2] A. Arsad, H. Sulaiman and A. Rahmat, “Combustion
behaviour of poultry and plastics waste in as bench scale combustor,” University Technology Malaysia, 2006.
[3] D. Zekkos, E. Kavazanjian, J. Bray, N. Matasovic and M.
Riemer, “Physical characterization of MSW for geotechnical purposes,” Journal of Geotechnical and Geoenvironmental Engineering,vol. 136, (9), 2010, pp 1231-1241.
[4] K. Ayuba, L. Manaf, A. Sabrina and S. Azmin, “Current
status of municipal solid waste management practise in FCT Abuja,” Research Journal of Environmental and Earth Sciences vol. 5, (6), 2013, pp. 295-304.
[5] A. Omari, “Characterization of Municipal solid waste for
energy recovery. A case study of Arusha, Tanzania,” Journal of Multidisciplinary Engineering Science and Technology. vol. 2 (1), 2015, pp. 230-237.
[6] R. Henry, Z. Yongsheng, and D. Jun, “Municipal solid
waste management challenges in developing countries-Kenyan case study,” Waste Management, vol. 26, 2006, pp. 92-100.
[7] C. Chang, C. Wang, D. Mui, M. Cheng and H. Chiang,
© 2016, IRJET | Impact Factor value: 4.45 | ISO 9001:2008 Certified Journal
| Page 8
waste incinerator in Taiwan,” Journal of HazardousMaterials, vol. 165, 2008, pp. 766-773.
[8] B. Ansah, “Characterization of municipal solid waste in
three selected communities in the Tarkwa Township of Nsuaem Municipality in Ghana,” University of Science and Technology. MSc thesis, 2014.
[9] B. Manohara and S. Belagali, “Characterization of
essential nutrients and heavy metals during municipal solid waste composting,” International Journal of Innovative Research in Science, Engineering and Technology Vol. 3, (2), 2014, pp. 9664-9672
[10] S. Paolo, “The effect of separate collection of municipal
solid waste on the lower calorific value of the residual waste,” Waste management and Research, vol. 28, (8), 2010, pp. 754-758.
[11] N. Dixon and U. Langer, “Development of a MSW
classification system for the evaluation of mechanical properties,” Waste Manage, vol.26, (3), 2006, pp. 220-232.
[12] R. Beck, “Georgia Statewide waste characterization
study,” Georgia Department of Community Affairs, U.S.A. 2005.
[13] H. Alhassan and A. Tanko, “Characterization of solid
waste Incinerator bottom ash and the potential for its use,” International Journal of Engineering Research and Applications (IJERA) vol. 2, (4), 2012, pp. 516-522.
[14] M. Oumarou, M. Dauda, A. Abdulrahim and A. Abubakar,
“Characterization and generation of municipal solid waste in North Central Nigeria,” International Journal of Modern Engineering Research, Vol. 2, (5), 2012, pp: 3669-3672.
[15] Q. Aguilar-Virgen, C. Vega, P. Taboada-Gonzalez and S.
Ojeda-Benitez, “Municipal solid waste generation and characterization in Ensenada, Mexico,” The Open Waste Management Journal, vol. 3, 2010, pp. 140-145.
[16] ASTM, ASTM E871-82 Standard, “ASTM E871-82 Standard Test Method for Moisture Analysis of Particulate Wood Fuels, 2013.
[17] ASTM, ASTM E872-82 Standard, “ASTM E872-82
Standard test method for volatile matter in the analysis of particulate wood fuels,” 2013.
[18] ASTM, E1534-93 Standard, “ASTM E1534-93 Standard
Test Method for Determination of Ash Content of Particulate Wood Fuels,” 2013.
[19] ASTM, D240-02 Standard, “ASTM D240-02 Standard test
method for heat of combustion of liquid hydrocarbon fuels by bomb calorimeter,” 2012.
[20] T. Karak, R. Bhagat and P. Bhattacharyya, “Municipal
solid waste generation, composition, and management,” Taylor & Francis, London, 2011.
[21] S. Das and B. Bhattacharyya, “Municipal solid waste
characteristics and management in Kolkata, India,” International Journal of Emerging Technology and Advanced Engineering, vol. 3, (2), 2013, pp. 147-152.
[22] L. Medina, E. Castillo and R. Romero, “Physical and
chemical characteristics of municipal solid waste in a rural locality,” International Journal of Business, Humanities & Technology vol. 3, (8), 2013, pp. 117-122.
[23] S. Yildiz, C. Yaman, G. Demir, K. Ozcan, A. Coban, K. Sezer
and S. Gorene, “Characterization of municipal solid waste in Istanbul, Turkey,” Environmental Progress & Sustainable Energy, vol.32, (3), 2012, pp. 734-739.
[24] W. Chen, J. Han, L. Qin, M. Furuuchi and H. Mitsuhiko,
“Emission characteristics of PAHs during coal and sewage sludge co-combustion in a drop tube furnace,” Journal of Aerosol and Air Quality Research, vol.14, 2014, pp. 1160–1167.
[25] K. Sivapalan, N. Muhd, S. Abd-Halim, S. Kamaruzazaman,
and A. Rakmi, “Comprehensive characterization of the municipal solid waste generated in Kuala Lumpur,” Symposium on Environmental & Natural Resources, 2002.
[26] T. Ogwueleka, “Municipal solid waste characteristics and
management in Nigeria,” Journey of Environment and Health Science Engineering, vol. 6, (3), 2009, pp. 173-180.
[27] J. Fobil, D. Carboo and N. Armah, “Evaluation of
municipal solid wastes for utilisation in energy production in developing countries,” Environmental technology and management Journal, vol 5, (1), 2005.
[28] S. Manyele and I. Kagonji, “Assessment of incineration
process performance in a district hospital using statistical analysis,” Scientific Engineering Research Journal vol. 4, 2012, pp. 421-434.
[29] L. De Medina, E. Castillo and R. Romero, “Physical and
chemical characteristics of municipal solid waste in a rural locality,” International Journal of Business, Humanities and Technology, vol. 3, (8), 2013, pp. 117-122.
[30] J. Bujak, “Experimental study of the lowerh value of
medical waste,” Polish J. of Environ. Stud. vol. 19, (6), 2010, pp. 1151-1158.
[31] S. Kathiravale, M. Muhd, K. Sopian, A. Samsuddin and R.
Rahman, “Modeling the heating value of municipal solid waste,” Fuel, vol. 82, 2003, pp. 1119-1125.
[32] E. Khamala and A. Alex “Municipal solid waste
composition characteristics relevant to waste to energy disposal method for Nairobi city,” Global Journal of Engineering, Design & Technology, vol. 2, 2013, pp.1-6.
[33] A. Omari, M. Said, K. Njau, G. John, and P. Mtui, “Energy
recovery routes from municipal solid waste - Case study of Arusha-Tanzania,” Journal of Energy Technologies and Policy, vol.4, (5), 2014, pp. 1-7.