UNIVERSITY OF MICHIGAN
Working Paper
Local Fiscal Multiplier on R&D and Science Spending:
Evidence from the American Recovery and Reinvestment
Act
Yulia Chhabra
Stephen M. Ross School of Business University of Michigan
Margaret C. Levenstein
Stephen M. Ross School of Business University of Michigan
Jason Owen-Smith
Institute of Social Research University of Michigan
Ross School of Business Working Paper
Working Paper No. 1383
June 2018
This paper can be downloaded without charge from the Social Sciences Research Network Electronic Paper Collection:
Local Fiscal Multiplier on R&D and Science Spending:
Evidence from the American Recovery and Reinvestment Act
∗June 20, 2018
Yulia Chhabra
†Margaret C. Levenstein
‡Jason Owen-Smith
§ABSTRACT
We use the American Recovery and Reinvestment Act (ARRA), a large stimulus package
passed into law to combat the Great Recession, to estimate the effect of R&D and science
spending on local employment. Unlike most fiscal stimuli, the R&D and science portion of
ARRA did not target counties with poor economic conditions but rather was awarded
follow-ing a peer review process, or based on innovative potential and research infrastructure. We find that, over the program’s five-year disbursement period, each one million USD in R&D and
sci-ence spending was associated with twenty-seven additional jobs. The estimated job-year cost
is about $15,000.
JEL Codes: E24, E62, E65, H59, I28, O38.
Keywords: federal spending, fiscal multiplier, R&D, science, the American Recovery and
Reinvestment Act.
∗This paper is based on one of the essays of the first author’s doctoral dissertation. We thank Ach Adhvaryu,
Chris Boehm, Rahul Chhabra, Kyle Handley, Scott Masten, Giacomo Meille, Dhiran Patki, Matthew Shapiro, Ariel Shwayder, Jagadeesh Sivadasan, Xu Zhang, and the participants of Business Economics Lunch, Macroe-conomics Seminar, Industrial Organization Lunch, and the INK Group at the Institute for Social Research at the University of Michigan for their helpful comments and suggestions. All errors remain ours.
†Department of Business Economics, Ross School of Business, University of Michigan; email:
muzyrya@umich.edu.
‡Department of Business Economics, Ross School of Business, Institute for Social Research, University of
Michigan; email: maggiel@umich.edu.
What is the effect of federal R&D and science1spending on local employment? This paper
analyzes the 2009 ARRA stimulus spending on R&D and science to estimate the effect of
fiscal spending on employment [Keynes, 1936] and the effect of R&D and science on economic growth [Schumpeter, 1942]. We provide new insights to these old questions by finding large
employment effect of R&D and science spending.
Science is generally perceived as a long-term endeavor, a foundation for applied research,
valuable to the nation in the long run but hardly relevant for a short-term economic
develop-ment. The main contribution of R&D and science to the economy lies in the areas of
innova-tion, technological growth, and entrepreneurship. Investments in science take time to come to
fruition and the outcomes take on various forms of codified knowledge (scientific publications,
patents, algorithms, methods), new products and services services, as well as highly trained
individuals. In addition to the long-term scientific contributions to the economy, R&D and sci-ence also affect short-term economic development through job creation. This paper focuses on
this short-term effect, and approaches the scientific process as daily productive work, not too
different from routine office work [Weinberg et al., 2014].
The existing economic literature does not provide a jobs multiplier specific to R&D and
science spending. If the earnings and consumption of researchers are similar to those of workers
in other industries, why would the jobs multiplier be different? In a standard Keynesian model,
it does not matter where new income enters the economy. If we abstract away from the
long-term benefits of new knowledge, digging ditches and building rockets should have similar
short-term effects on job creation. If anything, there has been a presumption that “brick and mortar” infrastructure spending has greater employment effects, and that science is likely to give rise to
creative destruction of jobs.2
Presuming that R&D spending exerts little or no short term stimulus effect can lead to
under-investment in these important activities. Recent evidence suggests that the composition
of government spending may matter for the size of the multiplier. Federal spending on
non-durable goods, including services, has been found to generate a larger GDP multiplier than
spending on durable goods [Boehm, 2016]. Feyrer and Sacerdote [2011] find considerable
variation in the size of the multiplier for different types of spending, ranging from negative
multipliers for education and public security to positive multipliers on low-income support, transportation, and energy. Chodorow-Reich et al. [2012] estimate the multiplier specifically
for Medicaid outlays. Leduc and Wilson [2013] examine the multiplier on highway
spend-ing. We contribute to this literature by providing an estimate of the multiplier on R&D and
science spending. The capital-to-labor ratio, earnings level, employee consumption patterns,
complementarity with other sources of funding, uncertainty, and flexible capacity (i.e., lower
adjustment costs) in R&D and science may all contribute to the differences between the
multi-1Hereafter “R&D and science” and “research” are used interchangeably.
2The larger multiplier on “brick and mortar” spending is also a reflection of presumptions about differences
plier on R&D and science and an aggregate multiplier on all government spending.
We treat the measurement of a fiscal multiplier on R&D and science spending as an
em-pirical question. While discrepancies among multiplier estimates in the literature may reflect differences in macroeconomic conditions, the form of the stimulus (e.g., tax cuts, direct
spend-ing, or transfers), data sources, or the estimation approach, we investigate the possibility that
differences in the spending purpose directly affect the multiplier.
We abstract away from the general equilibrium effects of fiscal stimulus and estimate a
lo-cal multiplier. Note that a lolo-cal multiplier is a different indicator than the national multiplier
in a Keynesian model. The national multiplier represents the value (in dollars of GDP or
num-ber of jobs) created after the government adds a dollar of stimulus to a closed economy. The
national multiplier is higher when interest rates are low [Woodford, 2011], higher during
reces-sions [Auerbach and Gorodnichenko, 2012], and lower for temporary increases in government spending [Baxter and King, 1993]. The local multiplier measures the change in the output or
employment after adding a dollar of government spending to a smaller open economy, such as
state or county,relative to other open economies within a fiscal union [Nakamura and
Steins-son, 2014]. Unlike the national multiplier, the local multiplier estimated here is not sensitive
to macroeconomic changes, like changes in the interest rate, that are common to all economies
in a fiscal union. It is still affected by labor underutilization during recessions, as that varies
across counties.
The variation used to estimate local multipliers comes from county- or state-level
differ-ences. Local fiscal multipliers, especially at the county level, may be estimated more precisely than a national multiplier because of a larger sample size. They, however, are sensitive to
at-tenuation bias from measurement error in the location of spending. This paper uses new, more
carefully constructed measures of the location of ARRA spending in order to reduce attenuation
bias. Local multipliers are also sensitive to spillover effects from cross-county or cross-state
mobility: they are increased by labor mobility if spending attracts in-migration to counties that
receive more spending and they are decreased by mobility in consumption if employees spend
their additional income in neighboring counties or states.
We examine changes in employment in response to federal spending on R&D and science in
the context of the American Recovery and Reinvestment Act (ARRA). The ARRA was signed into law in February 2009. Its goal was to provide a large federal stimulus to reduce the toll
of recession on the American economy. The large size and the speed of disbursement were
two important aspects of ARRA. It generated a quantitatively significant, largely unanticipated
shock to government spending.3 As we discuss further below, R&D spending was particularly
unanticipated, making it especially approapriate for estimating causal effects.
While most ARRA spending targeted areas hit hard by the recession, the geographic
allo-cation of R&D and science spending was intended to be exogenous to economic conditions.
3Hourihan [2015] provides an overview of ARRA research spending in the context of total federal spending
The allocation was based on a peer review process or the availability of resources to carry out
research projects. For example, when the stimulus bill was passed, National Science
Foun-dation (NSF) program officers funded deserving proposals they had not previously had the resources to fund. Approximately 80% of stimulus-backed awards went to projects submitted
prior to ARRA. The National Institutes of Health (NIH), on the other hand, issued a call for
new proposals to be funded under ARRA [Harmon, 2010]. Even there, the recipients had to be
institutions that were prepared to submit a credible NIH proposal under a very tight deadline,
so the geographic allocation primarily reflected local scientific capability.
Even though these grants were allocated based on scientific merit or capability, they were
not assigned randomly. This presents a challenge in measuring the effect of ARRA research
spending on local employment. The counties receiving ARRA research awards may be
differ-ent from other counties in ways that influence employmdiffer-ent trends. In addition to controlling for factors affecting employment and modeling a change in employment trend for each county, we
employ a two-stage strategy to reduce endogeneity problems. First, we estimate the probability
of selection into receiving ARRA research funds and construct an inverse Mills ratio term to
capture it. A county’s research intensity is the main predictor of selection into receiving ARRA
research award and award’s size. We use two dummy variables as excluded covariates of
re-search intensity: whether a county has a rere-search university and whether there is at least one
person employed in R&D and science services in the county prior to the recession. We
esti-mate a cross-county IV regression on a subsample of counties with R&D and science awards
to estimate the effect of ARRA research awards on the change in employment. We use the inverse Mills ratio from the selection equation and two new instruments: the natural logarithm
of doctoral degrees issued in a county in 2010 and the number of individuals employed in R&D
and science per capita in 2007, in the cross-county IV regressions.
We find that during ARRA disbursement period, which lasted from 2009 to 2013, 27 jobs
were added in response to one million USD in ARRA stimulus on R&D and science.
Tradition-ally, the multiplier is presented in a form of a job-year cost. Converting our baseline result into
job-year cost is not straightforward because the disbursement of ARRA funds took place over
five years, the average length of a project exceeded two years, and the data on yearly payments
are not available at the county-level. Taking all these into account leads to an estimated $15,000 USD per job-year, one of the lowest estimates in the recent literature on fiscal multipliers.
By providing an estimate of the fiscal multiplier on R&D and science spending, we
con-tribute to the economics literature in two ways. First, we concon-tribute to the literature on fiscal
multipliers. We provide the first estimate of the multiplier on R&D and science spending.
We also contribute to the literature on the effect of R&D and science on local economy.
Haus-man [2012] measures the effect of university innovation on long-term economic growth of local
economies. She finds that an additional $10 million of the Department of Defense (DOD)
fund-ing or $7 million of NIH fundfund-ing before 1980 generated an additional job per county-industry
universities in response to federal research funds. We study federal spending on R&D and
sci-ence in general, not just spending on universities or in university counties, and focus on the
short-term effects on local employment during and after the Great Recession, and find much larger effects.
Empirical Model
Our goal is to evaluate the effect of ARRA R&D and science spending on the change in local
employment at the county level. We start with a simple model which estimates the average
number of jobs created in a US county over ARRA disbursement period in response to a million
USD in research spending. In our baseline specification, we use the change in employment
from 2009 to 2013, a time period over which ARRA funds were disbursed to recipients in full, to capture all the spending shocks that accrued due to ARRA. The equation below captures this
framework:
Empc,2013−Empc,2009 1
5Σ2013n=2009Popc,n
=αs+β
ARRA Resc
1
5Σ2013n=2009Popc,n
+XcΓ+εc,
whereEmpc,t is employment in county cin yeart, Popc,t is population in countycin yeart,
ARRA Resc is total ARRA spending on research in county c in 2009-2013, Xc is a vector of
control variables,αsis a state-level shock, andεcis an error term.
This specification follows estimation strategies in earlier literature on cross-sectional fiscal
multipliers [Chodorow-Reich et al., 2012; Wilson, 2012]. The minor difference is that we
are estimating county-level multiplier. State-level multipliers are more common in the earlier
studies.
The counties which received research awards under ARRA are, on average, larger than all
other counties.4 To account for that, we scale the outcome variable and all ARRA variables by the population averaged over disbursement period following the standard practice in the
litera-ture. We scale employment-based control variables by the population averaged over respective
time periods.
We estimate the effect of ARRA research spending on employment at the county level.
Because US counties are open economies, we have to account for spillover effects from
dif-ferent sources: worker spending outside a county, cross-county mobility for job opportunities,
and mis-measurement of money flows from primary contractors to subcontractors and vendors.
There is an important difference between attenuation due to open economy and due to
mis-measurement or misreporting of the geography of spending. The spillovers from cross-county spending and labor mobility are inherent in the level of analysis. We test whether factor
mobil-ity is driving the estimates, but it doesn’t necessarily make the estimates wrong. The location of
spending, on the other hand, is a measurement issue, and we address that by providing a precise
4Table 3 shows summary statistics for counties which received ARRA spending on R&D and Science in
match between ARRA spending and geographic location of all recipients, including vendors
and subcontractors.
The spillover effects of the worker spending in other counties and mis-measurement of money flows cause the attenuation of estimates. The worker cross-county mobility leads to the
overestimation of the effect. We control for spillover effects in two ways: track subcontractor
and vendor transactions to their zipcodes5and control for ARRA research spending in adjacent
counties. It is also possible that some counties received more ARRA stimulus in general due
to seniority and political weight of their representatives. We proxy this “clout” with ARRA
spending on all other issues.
We control for a number of factors which are correlated with the pace of economic
re-covery. We include the change in employment from 2007 to 2009 because counties that lost
fewer jobs during recession might have less room to add new jobs during recovery. The post-recession employment changes might differ between urban and rural counties or depend on the
fraction of manufacturing jobs in a county. For this reason, we add an indicator for
metropoli-tan county and per capita count of individuals employed in manufacturing before recession.
We also include state fixed effects to account for differences in post-recession recovery across
states. Even after controlling for different characteristics of a county that are relevant to the
changes in employment, we cannot exclude the possibility of county-specific trends. To
alle-viate this issue, we use prior data to model county-specific trends in employment changes over
five-year periods on a rolling basis. We then extrapolate out of sample to predict the change in
employment from 2009 to 2013 for each county.
We rely on a number of ARRA features to reduce concerns about strategic hiring and
re-allocation of funds. The stimulus was largely unanticipated by the final recipients. This is
especially true for research spending. It does not fall under the areas traditionally subsidized
during recessions and was not expected to be a part of ARRA until the last moment. This
situation is somewhat unique as anti-recessionary spending is often anticipated.
We address the possibility of substitution between ARRA research awards and other sources
of R&D and science funding. There is no evidence of substitution between ongoing federal
spending on R&D and science and ARRA research awards. The federal government gave out
ARRA stimulus in addition to the federal R&D and science awards. The latter were trending flat over the past decade. Figure 1 from Hourihan [2015], shows ARRA R&D spending as a
“bump” on top of a flat trend in federal stimulus for R&D.6 While somewhat less likely, it is
possible that some recipients, mostly large universities, are not budget constrained and there is a
substitution between ARRA research funds and institutions’ own resources. However,
universi-ties’ own institutional spending on R&D continued to increase over this time period according
to the Higher Education Research and Development (HERD) survey. Recent economics
lit-5While it is possible that some of the recipients are importers, we are not able to track ARRA funds to foreign
countries. We take export-import structure of a county as given and estimate the effect of ARRA on the number of jobs created locally. We do not include foreign jobs created as a result of ARRA into our multiplier.
erature provides evidence that federal aid caused universities to increase their investment in
research and human capital [Dinerstein et al., 2014]. The same study acknowledges a slight
reduction in endowment spending for private universities and state appropriations for public universities. These findings can be interpreted as a substitution effect but it is not sizable.
Yet, there are challenges in measuring the effect of ARRA research spending on local
em-ployment. The awards are not assigned randomly. There is a possibility that the counties
re-ceiving ARRA research awards are different from other counties. We use a Heckman-type
cor-rection to account for non-random selection of counties into receiving ARRA research awards.
We estimate the probability of a county receiving an ARRA research award using all control
variables and two good predictors of a county receiving ARRA research stimulus. They are a
dummy for a research university in a county and a dummy for having any people employed in
R&D and science services in a county before the recession. We estimate the following selection equation using probit:
Sc=1[ARRA Resc>0]
Sc=δs+δ1Res U nic+δ2Res Countyc,2007+XcΨ+υc,
whereRes U nic is the dummy variable for a county with research university,Res Countyc,2007
is the dummy for a county with employment in R&D and science services in 2007, δs is a
state-level shock, andυcis an error term.
We construct an inverse Mills ratio, ˆλc, using predicted values from the estimated probit
model. The inverse Mills ratio corrects the bias from non-random selection of counties into
re-ceiving ARRA research stimulus in a sample of counties with non-zero ARRA research awards.
We need to account for the endogeneity of ARRA research stimulus. This endogeneity is, in principle, less serious than for other types of federal spending, such as spending on
unemploy-ment or housing. Research awards are not assigned based on the socio-economic conditions of
a county. Recipients received ARRA funds based on peer review, innovative potential, or
exist-ing infrastructure for scientific and technological discovery. Even though research awards are
not based on socio-economic conditions of a county, they cannot be considered independent
of them. The data show that counties with large research awards are more populous, urban,
affluent, and have more complex industrial structure. One possibility is that counties with large
research awards grow faster than counties with small awards. Another possibility is that
coun-ties with large research awards can smooth recessions better and have little room to add new jobs during the recovery.
We employ an instrumental variable strategy to account for resulting endogeneity. We use
two different predictors of ARRA research stimulus, a natural logarithm of doctoral degrees
awarded at the universities in a county in 2010 and the number of people employed in R&D
and science services per capita before recession, as instruments. We also include the inverse
awards:
ARRA Resc
1
5Σ2013n=2009Popc,n
=φs+φ1ln(Doc Degreesc,2010) +φ2
Res Empc,2007 Popc,2007 +φ3
ˆ
λc+XcΩ+ξc,
where φs is state-level shock,Res Empc,2007 is the number of individuals employed in R&D
and scientific services in countycin 2007,Doc Degreesc,2010is the number of doctoral degrees awarded in countycin 2010, andξc is the error term.
Our baseline estimate comes from the following cross-county instrumental variable
regres-sion on a sub-sample of counties with ARRA research awards:
Empc,2013−Empc,2009 1
5Σ
2013
n=2009Popc,n
=κs+βIV
ARRA Resc
1
5Σ
2013
n=2009Popc,n
+XcΘ+ηc,
whereκs is state-level shock, andηcis the error term.
Data
Total ARRA spending was an estimated $831 billion7, including contract, grant, and loan
awards, expansion of entitlement programs, such as food stamps and unemployment insurance,
direct grants to states, Medicaid match program, tax benefits and federal government consump-tion and investment. We will focus on ARRA transfers to individuals, businesses, and local
institutions. The total amount of ARRA contract, grant, and loan awards reported by recipients
is approximately $278 billion, or about one-third of all ARRA spending.8 This number does
not include other components of ARRA.
Our main data source is the Cumulative National Summary of ARRA recipient reports.9
The data contains reports from local governments, private entities, and individuals on the
amount of stimulus received under ARRA.
The data on the Cumulative National Summary of Recipient Level Reports has a multi-level
structure. Figure 3 in the Appendix B provides an example to illustrate the hierarchy of ARRA award recipients in the data.
We observe the flow of funds from primary contractor to subcontractors and vendors. Most
recipients disclose a place of performance (POP) with a five-digit zip code. We supplement
zip codes from vendors’ DUNS using Dun & Bradstreet Unique Partner Identification Key.
We then map zip codes to US counties using US Census Zip Code Tabulation Area, look-up
feature of Melissa Data, and HUD USPS zip code crosswalk files. Zip codes that cover two
7Original estimate was $787 billion. It was later adjusted up, to $831 billion [Congressional Budget Office,
2012].
8Author calculations based on the recipient reports in the Cumulative National Summary.
9We downloaded the last version of these reports from the Federal Procurement Data System on October 26,
or more counties were assigned weights based on the county population share in the zip code
using HUD USPS zip code crosswalk file. Table 10 in Appendix A presents the results of
matching recipients’ POPs to US counties. We match $270,334 million of ARRA awards from the Cumulative National Summary to a POP in a US county. Because ARRA reports allow us
to trace both disbursement to a primary recipient as well as subcontracts we are able to trace
spending with a high degree of local specificity. In other words, these data provide new and
heretofore unused information about the national geography of R&D stimulus spending and
thus support the local, county-level, models we estimate.
County level spending data are matched to public information about employment. We use
data on total county employment and county employment in the private sector from the Bureau
of Labor Statistics (BLS) Quarterly Census of Employment and Wages (QCEW).10 We use
annual average employment because we do not know specific dates of ARRA spending shocks to county employment. We use data on total employment in a county to account for both direct
and indirect job creation following ARRA stimulus and avoid the issue of overestimating the
number of jobs if employees are switching jobs to fill in the positions funded by ARRA in the
same county [Jones and Rothschild, Jones and Rothschild].
We use the QCEW for a control variable, the number of manufacturing jobs per capita in
a county before the recession. For the number of people employed in R&D and science, we
use data on county-level employment in scientific research and development services (NAICS
(2012) code 5417) from the US Census County Business Patterns.
The literature in economics does not provide an established definition of research spending. We thus calculate two alternate measures of R&D spending that rely on the missions of federal
agencies that made grants and the purposes reported specifically for ARRA spending.
Calcu-lating those measures relies on two data sources, the Catalog of Federal Domestic Assistance
(CFDA) and “Where Does the Money Go?” map from the Recovery.gov website, to define
ARRA funds which contribute to R&D and science.
For every US county, we track research spending under ARRA to the zipcodes within its
borders and also to the adjacent counties. We determine adjacent counties using US Census
data on county adjacency from 2010.
All employment and ARRA spending variables are scaled by county population from the US Census Annual Estimates of the Resident Population by County.
To control for the type of county, we identify metro counties using Rural-urban
Contin-uum Codes (2013) published by the US Department of Agriculture and counties with research
10The Cumulative National Summary of ARRA recipient reports contains information on the number of jobs
universities using the Carnegie Classification (2010) and the Post-secondary University
Sur-vey (2013) published by the US Department of Education. We obtain the number of doctorate
degrees awarded in a county from the Carnegie Classification (2010).
Definition of Research Spending
We employ two definitions of R&D and science spending. Our main definition is based on the
CFDA numbers: we identified 24 numbers describing scientific and research activities funded
under ARRA. We list these numbers and allocated funds in Table 11 in Appendix C.
The secondary definition comes from “Where does the money go?” section of the
Recov-ery.gov website. The section depicted a map with locations of ARRA recipients. The users
could search an award based on different characteristics, including its purpose. All funds la-beled “for R&D and Science” enter our secondary definition.
The data on the type of funds released on the Recovery.gov website were matched to the
outlays data from the Cumulative National Summary.11
We use two definitions to recover missing values. We classify transactions with missing
CFDA numbers based on the Recovery.gov data. Similarly, the transactions that were not
matched to the data from “Where Does the Money Go?” feature are classified as R&D and
science based on their CFDA number. The comparison of two definitions is in Table 12 in
Appendix C. Because our coding of CFDA numbers allows us to identify not only spending
by traditional science agencies (e.g. the National Institute of Health and National Science Foundation) as well as programs within other agencies that are focused on R&D, the estimate
of research spending using that definition is higher than that reported by the Recovery.gov.
Descriptive Analysis
Tables 1 and 2 show the breakdown of ARRA spending by year. Table 1 breaks ARRA awards
by the year in which they were assigned to recipient, while Table 2 shows the year of the
final report filed by recipients indicating work completion. We can see that the majority of awards were assigned in 2009 and completed in 2013. The pattern is similar for research
and non-research awards with one caveat. While the percentage of awards assigned early, in
2009, is similar - 59% of research awards and 62% of non-research awards, research projects
took longer to complete. Sixty percent of recipients of research awards filed final report in
the last year (2013) as compared to 44% of recipients of non-research awards. The average
11Data on the purpose of funds is only available for primary contractors and subcontractors. We assume the
same purpose for their vendors. Data on the purpose of funds does not have id variableaward key. We used
time between receiving an award and filing a final report is 772 days for non-research projects
and 890 days for research projects.12 This finding is consistent with the notion that R&D
and science projects are more long-term and uncertain, but may also have to do with standard university reporting practices for grant awards.
Tables 13 and 14 in Appendix D contain the data on the counties with the largest amounts
in research awards under ARRA. Table 13 shows that the counties with the largest aggregate
amounts are located on the coasts or in large metropolitan areas. Among the top 15 counties,
five are in California, each grossing at least 400 million USD in total ARRA funds on research,
two are in Massachusetts, and one in New York. Cook County in Illinois, Harris and Dallas
Counties in Texas, Wayne County in Michigan, Philadelphia County in Pennsylvania, Wake
County in North Carolina, and Milwaukee County in Wisconsin are homes to large cities with
complex industrial structures.
It is important to remember that counties with the largest aggregate amounts of research
awards are not necessarily the most research-intensive. After scaling ARRA awards by
popu-lation the coastal areas and counties with large cities are no longer prominent.
Figure 1 displays the per capita county-level distribution of research spending under ARRA.
A little over half of all the counties received some research funds between 2009 and 2013.
However, the distribution of awards, even when examined per capita, is skewed. About
one-third of all counties received more than 5 USD per capita over five years. 382 counties received
more than 50 USD per capita, 244 more than 100 USD per capita, and 34 counties more than
500 USD per capita.
The list of counties with the largest amounts in research awards is different if compiled on
per capita basis. Suffolk county in Massachusetts is the only county from Table 13 to appear
in Table 14, which displays the top 15 counties on per capita basis. Suffolk County is a part of
the greater Boston metropolitan area and is home to numerous research institutions.
Some of the counties enter Table 14 due to low population numbers. If the denominator in
the per capita definition of research awards is small, even 10 million USD in federal awards
over five years will place a county at the top of the list, as evidenced by Esmeralda County
in Nevada. Two Nevada counties as well as two remote boroughs in Alaska, Morrow County
in Oregon, and Pontotoc County in Mississippi are low population counties which received federal funds for Renewable Energy Research and Development. Orange County in North
Carolina, Washtenaw County in Michigan, Tompkins County in New York, and Suffolk County
in Massachusetts are homes to large research universities. Delphi Corp, a recipient of a large
grant in Conservation R&D, has one of its main offices in Kokomo, Howard County. Los
Alamos County is on the list due to the grants of the Los Alamos National Laboratory from the
National Science Foundation (NSF) and the Department of Energy (DOE). Anderson County
in Tennessee is a home of the Oak Ridge National Laboratory. Marinette County in Wisconsin
12Author calculations. We do not observe the date of the final report, only its year and quarter. We assign the
is on the list mainly because of the two large contracts of Marinette Marine Corp. with the NSF
and the National Oceanic and Atmospheric Administration (NOAA).
Table 3 compares counties with research spending and counties with spending on all other purposes. Between 2009 and 2013, every county received some ARRA awards for purposes
other than research. About half of all counties received ARRA stimulus for R&D and science
in the same time period. The counties with research awards are more populous, urban, twice as
likely to have a research university, and have more individuals employed in scientific research
and development services. More doctoral degrees are awarded in the counties with ARRA
research awards. They are similar to all other counties in the share of individuals employed in
manufacturing and the increase in the unemployment rate during the Great Recession.
Tables 15 and 16 in Appendix D examine the geographical dispersion of ARRA awards.
Table 15 includes all awards. Table 16 excludes awards with only one recipient.13 We separate awards with many recipients because subcontractors and vendors change the geography of
spending. They are often overlooked at a less granular analyses of fiscal spending, resulting
in attenuated estimates. Both tables show the same pattern: primary contractors on research
awards are more likely than primary contractors on non-research awards to have subcontractors
and vendors outside their zip code, county, and state. However, the relative amounts they are
sending to other zip codes and counties are smaller than corresponding amounts sent by primary
contractors on all other awards. Primary contractors on research send, on average, 12% of the
total award amount outside their zip code, including 10% of the total amount going outside
the county. Corresponding percentages for primary contractors on non-research awards are 17 and 13. The pattern reverses at the state level. Primary contractors on research awards send,
on average, 8% of total award amounts outside their state, while primary contractors on
non-research awards do so with only 3% of award amounts. This pattern is inconclusive about the
“stickiness” of research awards in comparison to all other awards. However, it is evident that
research contractors have more remote subcontractors and vendors. This finding is expected as
research contracts require specialized materials, processes, and services.
Table 4 shows summary statistics for the 3,102 counties in the sample. The top panel
shows details on outcome variables, total employment and private sector employment, denoted
as changes per capita. On average, total county employment per capita rose by about 0.8% between 2009 and 2013. During the same time period, average private sector employment
increased by about 1%.
The next panel shows the details on ARRA spending variables. A little over half of all
counties received some federal funds on research under ARRA. The average amount was $34
per capita over five years, from 2009 to 2013. In contrast, every US county received some
ARRA funds for purposes other than research and the average amount is more than twenty
times higher, $824 per capita, over the same period.
13 By default, these awards have all transactions and 100% amount in the same zip code, county, and state.
We use two instruments, an indicator that a county has a research university and an
in-dicator that a county has at least one person employed in R&D and science in 2007, in the
selection equation. We use three instruments, different from the first two, in the first stage of IV regression. They are the number of individuals employed in R&D per capita in 2007, the
natural logarithm of doctoral degrees awarded in 2010, and the inverse Mills ratio. According
to the Carnegie Classification (2010), 205, or 6.5% of, US counties have a research university.
According to the County Business Patterns, only 11.3% of US counties have at least one
indi-vidual employed in R&D in 2007. On average, a county had 304 indiindi-viduals employed in R&D
for every million residents. In contrast, there were, on average, 46,257 individuals employed
in manufacturing per million residents in the same year. The numbers for the doctoral degrees
are similarly skewed. On average, there were 19 doctoral degrees awarded in a US county in
2010, but the 90thpercentile is zero.
The bottom panel contains information on employment change during the recession. On
av-erage, between 2007 and 2009, total employment in a county fell by 1.5%. The corresponding
number for private sector employment is 1.6%.
Baseline Results
Heckman Correction
Table 5 presents the estimates from the probit regression14used to correct for selection of
coun-ties into receiving ARRA research awards. The outcome variable is a dummy for a county with
non-zero ARRA spending on research. Column 1 shows the results of the baseline regression.
Column 2 presents the same regression as in Column 1 using the secondary definition of
re-search spending. Column 3 gives results for the same regression as in Column 1 substituting
total employment with private sector employment.
The counties with ARRA research awards are different from the rest of the country. They are more urban, more likely to have a research university and individuals employed in R&D and
science, and are more likely to be surrounded by the counties that also received ARRA research
stimulus. According to the baseline specification, at least one R&D job in a county in 2007
increases the probability of receiving ARRA research awards by 33%. A research university in
a county increases the probability of receiving ARRA research awards by 55%. Urban counties
are, on average, 24% more likely to receive ARRA research awards. One thousand USD in
ARRA research awards per capita received by adjacent counties increases the probability of
the focal county getting ARRA research funds by 39%, suggesting that this spending, like
other R&D measures, is subject to agglomeration effects. One standard deviation increase in employment in manufacturing per capita increases the probability of receiving ARRA research
funds by 4%.
Negative coefficients on the change in employment during recession suggest that
coun-ties that were later awarded ARRA stimulus on research fared better during the recession.
The consequences of that are not clear. The counties with ARRA research awards may have slower growth rates because there is less room for new jobs during the recovery, or higher
post-recession growth rates because they, in general, have better socio-economic profiles, or a mix
of both.
We use the estimates from the Heckman correction regression to construct the inverse Mills
ratio. We include it in the first stage regression on a subsample of counties with ARRA research
awards. It corrects for the selection of counties into receiving ARRA stimulus for R&D and
science by controlling the part of the error term for which selection into getting funded affects
the funding amount.
First Stage
Table 6 provides first-stage results of the IV regression. In all specifications, the instruments
are good predictors of the endogeneous variable, ARRA spending on research. The baseline
specification shows that conditional on receiving ARRA stimulus, one extra person employed
in R&D and science before the recession, increases research spending under ARRA by 15,300
USD. Likewise, a one percent increase in awarded doctorates in a county increases ARRA
re-search spending by 19 USD per capita. These magnitudes are large. From descriptive statistics,
we know that less than one-tenth of all counties received more than 100 USD in ARRA
spend-ing on research per capita. However, the number of counties where any doctorate degrees were awarded in 2010 is small - 312. The number of counties with more than a thousand people
employed in R&D and science services in 2007 is even smaller: 89.
The inverse Mills ratio from the selection model is positively signed but not statistically
sig-nificant in all three specifications. It suggests that unobserved factors that make counties more
likely to get ARRA stimulus on research are also associated with larger amounts in stimulus
per capita but the relationship is not statistically significant.
The robust first-stage F-statistic in the baseline specification is 17. The same statistic in the
regression which uses our second definition of R&D and science spending is 20. The F-statistic
in private employment regression is 29.
Main Results
Table 7 presents an endogeneous OLS regression in Column 1 and second-stage results of
the IV regressions in Columns 2-4. The outcome variable in each regression is the change in
employment in a county from 2009 to 2013 per capita. The OLS estimate of the jobs multiplier
is 14 with a p-value below 0.01. The coefficient on the IV estimate is much higher, 27, with
a p-value below 0.01. Between 2009 and 2013, on average, a county added 27 new jobs in
we use the secondary definition of ARRA research spending. The majority of jobs, 23 out of
27, were in the private sector.
The OLS estimate is much smaller than the IV estimate suggesting a negative correlation between the change in employment and unobserved characteristics of counties with high
re-search spending. This finding is consistent with the notion that these counties had less room to
add new jobs during the recovery.
The effect of an increase in research spending per capita in adjacent counties is positive and
statistically significant in IV specifications. The coefficients range from 15 to 19. The OLS
coefficient equals 5 and is not statistically significant. This result rules out negative spillover
effects of research spending. The IV specifications suggest that there are positive spillover
effects - a county adds jobs in response to research spending in adjacent counties. There is one
caveat with interpreting magnitudes of coefficients on research spending in adjacent counties. While the outcome variable and spending variable are in per capita units, the former is measured
for one county and the latter - for a group of counties. For counties with ARRA research
awards, the average denominator (population) in 2009-2013 is around 175,000. For a group
of adjacent counties, the average denominator (population) is around 882,000. Depending on
the specification, the coefficients in IV regressions imply that 2.9 to 3.8 jobs were added in a
county in response to one million USD in research spending in adjacent counties. Overall, our
baseline estimate imply that one million USD in R&D stimulus spending generated 27 jobs in
the county that received the award and 3 jobs in counties adjacent to it.
The coefficients on all other ARRA spending are negative and significant. They display a well-known selection effect: federal stimulus goes disproportionately to the counties with
worse economic conditions. The initial economic conditions in these counties mask
improve-ments from the federal stimulus. This variable is included as a control and we are not
instru-menting for it.
Among other control variables, a dummy for urban counties is consistently positive and
significant across all specifications, the number employed in manufacturing before recession is
positive and statistically significant in IV specifications, and the change in employment due to
recession changes sign based on specification and is not statistically significant. The
county-specific trend in employment change is positive but not statistically significant across all spec-ifications.
Robustness Checks
In Table 17, we evaluate the robustness of baseline results. One possible concern is that the
baseline results are driven by counties with research universities or coastal counties with
de-veloped research infrastructure, such as California and Massachusetts. In the first column, we
report baseline estimates after dropping counties in Massachusetts and California. The
spending over the five year period. It remains statistically significant with p-value less than
0.01. The second column shows results for counties without research universities.15 This time
the change is more pronounced. The coefficient reduces by one third, from 27 to 18 jobs, but is still significant. This finding suggests that the results are disproportionately driven by counties
with research universities. It is hardly surprising as ARRA research stimulus is complimentary
to the infrastructure for R&D and science.
We also check for the possibility that our main result may be driven by spurious correlation.
To do that we estimate the baseline regression omitting the main variable of interest, ARRA
research spending, and the county-specific change in employment trend16 using OLS:
Empc,t−Empc,2009 1
5Σ
t
n=2009Popc,n
=κ˜s+X∗cΘ˜ +η˜c,
whereX∗c is a vector of control variables without the change in employment trend, ˜κs is
state-level shock, and ˜ηcis an error term.
We predict the change in employment using control variables for several time periods before
the recession17 (2009-2002, 2009-2003, 2009-2004 etc.) and for several time periods after the
recession (2009-2010, 2009-2011, etc). In the absence of spurious correlation, the effect of
ARRA research spending is included in the residuals of post-recession regressions but should
not be present in the residuals of pre-recession regressions. We construct predicted ARRA
research spending using a linear combination of instruments from the first-stage regression (the
number of persons employed in R&D per capita in 2007, the natural logarithm of doctoral degrees awarded in a county in 2010, and the inverse Mills ratio from the selection equation).
We regress the residuals from the employment regressions on predicted ARRA spending on
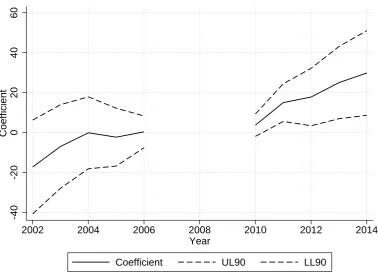
research. The results are in Figure 2. The estimated coefficient is around zero for pre-recession
periods indicating that conditional on control variables there is no spurious correlation between
the change in employment and instrumental variables. Positive and significant coefficients in
the post-recession period are picking up the correlation between the effect of ARRA spending
included in the residual and instrumental variables.
15We cannot use dummy for research university in the selection equation because by construction none of the
counties in this specification have research university.
16We use the data on the change in employment before 2009 to construct county-specific change in employment
trend. The same data are used to construct the outcome variable in robustness regressions.
17We omit 2009-2007 and 2009-2008 because the change in employment between 2007 and 2009 is included
Discussion
Job-Years
We assess the magnitude of our main result by calculating the yearly cost of a job. In the
data, we do not observe yearly payments to recipients but we can examine the relationship between ARRA awards and the change in employment over different lengths of time. Table
8 shows the coefficients from the regression of the change in employment on total ARRA
research spending. One million USD in ARRA stimulus on research added 4 jobs from 2009
to 2010, 16 jobs from 2009 to 2011, 19 jobs from 2009 to 2012, and 27 jobs from 2009 to
2013. If we assume that all new jobs lasted for the whole year and no new jobs were created
in response to ARRA after 2013, then the total number of job-years created in response to one
million USD in ARRA research spending is the sum of the coefficients from four regressions
in Table 8. We get a total of 66 job-years with a standard error of 13.18 We interpret this
result with caution because an overidentification test fails for regressions on the change in
employment in 2009-2010 and 2009-2011. A similar result using OLS is 30 job-years with a standard error of 2 (Table 9). These estimates convert to approximately 15,000 USD per
job-year using our baseline specification and 33,000 USD per job-job-year using the more conservative
endogenous OLS regression. Regardless of any longer term economic benefits that accrue
to R&D supported by ARRA spending, these investments resulted in significant employment
stimulus effects.
State-level Results
In order to compare our findings to other published models, we attempt to estimate baseline results at the state level. We have to make changes to the main specification to obtain
state-level estimates. First, we are no longer applying the Heckman correction because there is no
selection into receiving ARRA spending on research at the state level. Every state was awarded
some R&D and science funding between 2009 and 2013. We can no longer include control
for ARRA research spending in adjacent counties. Instead of a dummy variable controlling for
metro counties, we add a state-level measure of urbanization, defined as the number of metro
counties in a state.
The instrumental variable strategy has to be modified as well. The number of doctoral
students aggregated at a state level is no longer a good predictor of ARRA R&D and science spending. Therefore, we no longer include it as an instrument. Without the inverse Mills
ratio from the selection model and the number of doctoral students as instruments, we are left
with Employed in R&D and science per capita (2007) as the only instrument in our baseline
specification. Due to small sample size, we use conventional standard errors.
18We calculate the standard error on the job-year cost estimates using Delta method. We assume asymptotic
We present the state level results in Table 18 in Appendix F. We are not able to obtain a
precise estimate of the effect of ARRA R&D and science spending. The coefficient on the
main variable of interest is large, larger than comparable magnitudes at the county level, but so are standard errors. The robust first stage F-statistic for the main regression is 12.82.
Table 18 provides no evidence of negative spillover effects within a state. If
research-intensive counties were to “steal” already employed people from other counties in a state, the
coefficient estimate in the state-level regression should be smaller than the respective estimate
at the county-level.
The magnitude of the coefficient suggests that the variation in the effect of ARRA spending
across states within a region is larger than the variation across counties within a state.
Comparison to the Estimates in the Literature
We compare our baseline estimate to the results in recent studies using similar methodology.19
We find that our multiplier is large in comparison to the results in other studies.20
Wilson [2012] applies cross-state IV methodology to analyze the effect of ARRA grants
on total non-farm employment. The estimated effect suggests a cost of $125,000 per job-year
in the first year of disbursement. It is higher than our estimate of $15,000 per job-year, or
our state-level results, which are not measured precisely. Shorter time-horizon, the analysis at
the county level, the possibility of jobs created by ARRA lasting past the first year, as well
as the possibility of the R&D and science spending having a higher multiplier can explain the
differences between our estimate and a smaller estimate in Wilson [2012].
Chodorow-Reich et al. [2012] apply similar methodology to estimate the effect of ARRA
Medicaid reimbursements at a state level. They use past Medicaid spending per capita as an
instrument for ARRA stimulus and find a cost of $26,000 per job-year. Conley and Dupor
[2013] find a much smaller multiplier, $202,000 per job-year, using ARRA obligations. Leduc
and Wilson [2013] estimate employment regression21 as part of their study of the flypaper
effect. They estimate a cost of job-year as $62,500 for highway grants over a three year period
(2008-2011).
These papers estimate effects within the first two years of ARRA, at the state level and
using the data on the federal grants to states with a breakdown by agency. Our baseline estimate comes from county-level data from the direct recipients of ARRA contracts and grants. The
data are broken down by CFDA numbers, a more granular measure than the breakdown by
funding department, over five years of full ARRA disbursement.
19We are not comparing our estimates to the results from macroeconomic models, such as Blinder and Zandi
[2010] and reports by the CEA and CBO. The direct comparison of local and national multipliers requires a number of assumptions which do not hold in our case.
20Chodorow-Reich [2017] contains a review of the recent literature on geographic cross-sectional fiscal
spend-ing multipliers.
Feyrer and Sacerdote [2011] use ARRA recipient-level reports on all types of spending
at the county level in the first twenty months of ARRA disbursement and estimate a cost of
$400,000 per job year. They locate about $85 billion in spending at the county level, while we locate about $270 billion. They also estimate state-level effect of approximately $111,000 per
job year.22 Similarly to Feyrer and Sacerdote [2011], our state-level estimates are higher than
the county-level estimates. They attribute it to the positive spillover effects on employment. A
non-ARRA paper estimating multiplier at the county level is Serrato and Wingender [2016].
They document a cost of $30,000 per job year.
A direct comparison of our study to recent literature is complicated by the differences in
methodology, data sources for employment and ARRA spending, and the time period during
which the stimulus was disbursed to recipients. It is, however, evident that our estimate of the
R&D and science multiplier is larger than the estimates of the common multiplier or multipliers on other types of spending in the recent literature. In other words, our findings at the county
level imply both that R&D spending has significant stimulus effects and that those effects are
larger than those that have been reported for many other types of federal stimulus.
Conclusion
We examine the impact of ARRA R&D and science spending on local employment.
Cross-county IV regressions indicate that ARRA spending on R&D and science has substantively
large, positive, statistically significant effects on employment at the county level. We find that between 2009 and 2013, the full ARRA disbursement period, 27 jobs were added in response
to one million in spending on research. The majority of jobs, 23 out of 27, were in private
sector. Additional analysis provides an estimate of the cost per year. We find that 66
job-years were created from one million USD in ARRA research funds which converts to the cost
of about $15,000 per job-year. Split sample regressions suggest that the effect is larger for
counties with research universities.
Overall, the effect of ARRA spending on R&D and science estimated in our paper is larger
than comparable results for federal stimulus in general as well as federal stimulus on health
or infrastructure. In addition to any longer term returns realized to discovery and training conducted in the course of ARRA funding R&D, there are substantial short term employment
returns to public investments in science and research.
22We take the estimate in Column 1 of Table 3 because the specification is closest available comparison to our
Bibliography
Auerbach, A. J. and Y. Gorodnichenko (2012). Measuring the output responses to fiscal policy.American
Economic Journal: Economic Policy 4(2), 1–27.
Baxter, M. and R. G. King (1993). Fiscal policy in general equilibrium.The American Economic Review,
315–334.
Blinder, A. S. and M. M. Zandi (2010). How the great recession was brought to an end.
Boehm, C. E. (2016). Government spending and durable goods. Working paper.
Chodorow-Reich, G. (2017). Geographic cross-sectional fiscal spending multipliers: What have we
learned? National Bureau of Economic Research.
Chodorow-Reich, G., L. Feiveson, Z. Liscow, and W. G. Woolston (2012). Does state fiscal relief during recessions increase employment? Evidence from the American Recovery and Reinvestment Act.
American Economic Journal: Economic Policy 4(3), 118–45.
Clark, C. S. (2015, Sep). Historic effort to track stimulus spending wraps up. Government Executive.
Congressional Budget Office (2012, February). Estimated impact of the American Recovery and
Rein-vestment Act on employment and economic output from October 2011 through December 2011. Con-gressional Budget Office.
Conley, T. G. and B. Dupor (2013). The American Recovery and Reinvestment Act: Solely a government
jobs program? Journal of monetary Economics 60(5), 535–549.
Dinerstein, M. F., C. M. Hoxby, J. Meer, and P. Villanueva (2014). Did the fiscal stimulus work for
universities? InHow the Financial Crisis and Great Recession Affected Higher Education, pp. 263–
320. University of Chicago Press.
Feyrer, J. and B. Sacerdote (2011). Did the stimulus stimulate? Real time estimates of the effects of the
American Recovery and Reinvestment Act.National Bureau of Economic Research.
Harmon, K. (2010, Feb). Is the Recovery Act stimulating science and the economy? Scientific American.
Hausman, N. (2012). University innovation, local economic growth, and entrepreneurship.
Hourihan, M. (2015). Historical trends in federal R&D. Washington DC: The American Association for
the Advancement of Science.(AAAS Report XXXIX, Research and Development FY 2014), 23–28. Jones, G. and D. M. Rothschild. Did stimulus dollars hire the unemployed? Answers to questions about
the American Recovery and Reinvestment Act.Working paper.
Keynes, J. M. (1936).General theory of employment, interest and money. Macmillan.
Leduc, S. and D. Wilson (2013). Are state governments roadblocks to federal stimulus? Evidence from
highway grants in the 2009 Recovery Act.Federal Reserve Bank of San Francisco Working Paper 16.
Nakamura, E. and J. Steinsson (2014). Fiscal stimulus in a monetary union: Evidence from US regions.
American Economic Review 104(3), 753–92.
Schumpeter, J. A. (1942). Capitalism, socialism and democracy. Harper and Brothers.
Serrato, J. C. S. and P. Wingender (2016). Estimating local fiscal multipliers. National Bureau of
Weinberg, B. A., J. Owen-Smith, R. F. Rosen, L. Schwarz, B. M. Allen, R. E. Weiss, and J. Lane (2014).
Science funding and short-term economic activity. Science 344(6179), 41–43.
Wilson, D. J. (2012). Fiscal spending jobs multipliers: Evidence from the 2009 American Recovery and
Reinvestment Act. American Economic Journal: Economic Policy 4(3), 251–82.
Woodford, M. (2011). Simple analytics of the government expenditure multiplier. American Economic
Figures and Tables
Figure 1: County-level Science and R&D Spening per capita under ARRA (2009-2013)
(500 USD; +) (100 USD, 500 USD] (50 USD, 100 USD] (5 USD, 50 USD] (0 USD, 5 USD] 0 USD
Notes:The map depicts county-level per capita spending on research under ARRA in continental US in 2009-2013.
Figure 2: Robustness Check, Spurious Correlation
-40
-20
0
20
40
60
Coefficient
2002 2004 2006 2008 2010 2012 2014
Year
Coefficient UL90 LL90
Notes:The graph examines the possibility of spurious correlation in the main result. We estimate the regression of the residuals from the baseline specification after omitting ARRA research spending on the predicted values of ARRA research spending. The predicted ARRA research spending is constructed using the instruments from the first stage. The year on the horizontal axis indicates thetin the outcome variableEmpc1 ,t−Empc,2009
5Σ
t n=2009Popc,n
in the post-recession baseline regressions andEmpc1 ,2009−Empc,t
5Σ
t n=2009Popc,n
in the pre-recession baseline regressions used to construct
Table 1: ARRA Awards Assigned by Year
2009 2010 2011 2012 2013
ARRA R&D and science spending (mill USD) 14,438 9,107 610 275 221
All other ARRA spending (mill USD) 146,262 68,472 19,487 2,174 1,281
Notes:The data in the table comes from the Cumulative National Summary of ARRA Recipient Reports. The total amount constitutes about one-third of the total ARRA package. The data in the table is split by the year in which ARRA award was assigned. ARRA spending on research is defined using selected CFDA numbers. The discrepancy between Tables 1 and 2 comes from missing values inaward datevariable.
Table 2: ARRA Awards Completion by Year
2009 2010 2011 2012 2013
ARRA R&D and science spending (mill USD) 78 1,048 3,648 5,687 15,922
All other ARRA spending (mill USD) 3,874 20,660 59,855 54,535 110,398
Table 3: Summary Statistics for Counties with ARRA Research Awards vs. All Counties
ARRA, R&D and Science All Counties
mean mean
Employment (2013) 74,257 41,058
Population (2013) 177,643 100,782
Change in Unemployment Rate
(2007-2009) 4.45 4.19
County with Research University 0.13 0.07
County with Employed in R&D (2007) 0.21 0.11
Metro County 0.55 0.37
Employed in Manufacturing
per cap (2007) 0.051 0.046
Employed in R&D per cap (2007) 0.001 0.000
Doctoral Degrees in a County (2010) 37 19
Observations 1584 3102
Notes:The table contains summary statistics separately for counties with non-zero ARRA spending on research in comparison to all other counties. The unit of analysis is a county. ARRA spending on research is defined using selected CFDA numbers.
Table 4: County Summary Statistics (2009-2013)
count mean sd min max
Outcome Variables
Annual Change in Total Employment
per cap, 2009-2013 3102 0.00763 0.0340 -0.320 0.576
Annual Change in Private Sector Employment
per cap, 2009-2013 3102 0.01023 0.0336 -0.302 0.570
ARRA Spending Variables
ARRA Research Spending (mill per cap) 3102 0.00003 0.0003 0.000 0.013
ARRA Research Spending in Adjacent Counties
(mill per cap) 3102 0.00005 0.0001 0.000 0.002
All Other ARRA Spending (mill per cap) 3102 0.00082 0.0017 0.000 0.047
Instrumental Variable
Employed in R&D per cap (2007) 3102 0.00030 0.0022 0.000 0.082
County with Employed in R&D (2007) 3102 0.11348 0.3172 0.000 1.000
Doctorate Degrees in a County (2010) 3102 19 109 0.000 2361
County with Research University 3102 0.06544 0.2473 0.000 1.000
Inverse Mills Ratio 1584 0.56940 0.4283 0.000 1.846
Control Variables
Metro County 3102 0.37105 0.4832 0.000 1.000
Change in Total Employment
per cap, 2007-2009 3102 -0.01511 0.0216 -0.180 0.220
Change in Private Sector Employment
per cap, 2007-2009 3102 -0.01599 0.0230 -0.279 0.241
Employed in Manufacturing per cap (2007) 3102 0.04626 0.0436 0.000 0.479
Notes:The table contains summary statistics for baseline regression. The unit of analysis is a county. The sample size is all US counties for all variables, except inverse Mills ratio. The sample size for inverse Mills ratio is all counties with non-zero ARRA research awards. The time period for outcome variables and ARRA spending variables is 2009-2013. All outcome variables and ARRA spending variables are scaled by county population averaged over the same time period. All ARRA spending variables are in millions of USD. ARRA spending on research is defined using selected CFDA numbers.
County with Research University is an indicator which equals one if a county has R1, R2, or R3 University by the definition in Carnegie Classification (2010). The inverse Mills ratio is constructed using predicted values from the probit regression of the probability of getting ARRA research awards on control variables and two instruments: County with Research University and County with Employed in R&D.
Metro County is an indicator variable which takes the value of one if a county is a Metropolitan County by the definition in 2013 Rural-urban Continuum Codes.
The change in the total number of employed in a county between 2007 and 2009 and the change in the number of employed in the private sector in a county between 2007 and 2009 are scaled by the average population in a county during this period.
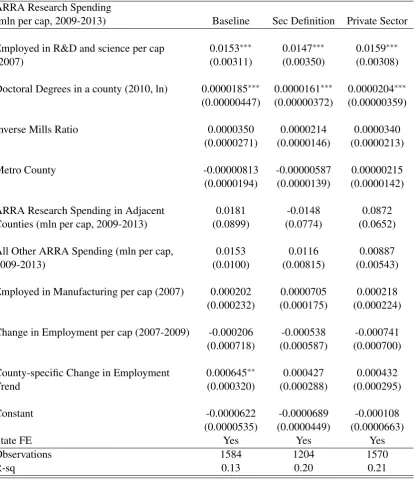
Table 5: Heckman Correction Results
County with ARRA Research Spending in 2009-2013
Baseline dy/dx
Sec Definition dy/dx
Private Sector dy/dx
County with Employed in R&D and 0.334∗∗∗ 0.286∗∗∗ 0.331∗∗∗
Science (2007) (0.0441) (0.0328) (0.0441)
County with Research University 0.547∗∗∗ 0.543∗∗∗ 0.546∗∗∗
(0.132) (0.0857) (0.132)
Metro County 0.240∗∗∗ 0.241∗∗∗ 0.236∗∗∗
(0.0159) (0.0138) (0.0160)
ARRA Research Spending in Adjacent 391.8∗∗ 257.0∗∗ 402.9∗∗
Counties (mln per cap, 2009-2013) (159.9) (119.3) (164.4)
All Other ARRA Spending (mln per 4.185 3.398 3.143
cap, 2009-2013) (4.154) (3.159) (4.063)
Employed in Manufacturing per cap 0.937∗∗∗ 0.706∗∗∗ 0.842∗∗∗
(2007) (0.207) (0.180) (0.208)
Change in Employment per cap -1.083∗∗∗ -0.882∗∗ -1.562∗∗∗
(2007-2009) (0.419) (0.372) (0.446)
County-specific Change in 0.359∗∗∗ 0.293∗∗ 0.507∗∗∗
Employment Trend (0.127) (0.114) (0.141)
State FE Yes Yes Yes
Observations 3102 3102 3056
Notes:The table contains Heckman correction for the selection of counties into receiving ARRA research awards. The first column shows baseline regression. ARRA spending on research is defined using selected CFDA numbers. The second column shows the same regression using secondary definition of research spending based on “Where does the money go?” section of the Recovery.gov website. The third column shows regression using private sector employment, instead of total employment, in the county-specific change in employment trend and the change in employment per cap (2007-2009).
In all regressions, a county is the unit of analysis. The sample includes all US counties. The outcome variable is a dummy variable for a county with non-zero ARRA spending on research in 2009-2013.
ARRA spending on research in adjacent counties and all other ARRA spending are included as controls. The variables are in millions of USD over 2009-2013, divided by the population in a given county averaged over the same period of time.
County with Research University is an indicator which equals one if a county has R1, R2, or R3 University by the definition in Carnegie Classification (2010). Metro County is an indicator variable which takes the value of one if a county is a Metropolitan County by the definition in 2013 Rural-urban Continuum Codes. We control for the number of people employed in manufacturing per capita in a county in 2007. We also include the change in the total number of employed workers in a county between 2007 and 2009 divided by the average population in a county during this period.
Each regression includes state fixed effects and a county-specific change in employment trend. The trend is a linear extrapolation of the predicted values from the regression of the change in employment on time. All regressions are calculated separately for each county from 2000 to 2009 in rolling five-year intervals.