5th International Scientific and Business Conference—Future Engineering 2019 ISBN: 978-1-60595-632-9
Regeneration of Spent Caustic and Acidic
Cleaning Baths Using a Pilot Membrane
System
Anna Kowalik-Klimczak
1, Maciej Życki
1and Paulina Rajewska
1ABSTRACT
In this work, the concept based on using pressure driven membrane processes was developed to effectively recover alkaline and acidic cleaning baths that wash out of technological lines in dairy plants. As a result, the influence of both microfiltration (MF) and the integrated system of micro- and ultrafiltration (MF/UF) process parameters were assessed on the efficiency of the regeneration of alkaline cleaning baths. It was found that MF process allows reducing the level of contaminants in alkaline cleaning baths, yet the integrated MF/UF system is more efficient in the removal of high molecular organic compounds. In turn, during the regeneration of acidic cleaning baths, the influence of process parameters of ultrafiltration (UF) and integrated ultra- and nanofiltration systems (UF/NF) on the on their effectiveness was examined. As a result, it was confirmed that integrated UF/NF system is crucial to regenerate acidic cleaning baths.
Keywords: caustic and acidic cleaning baths, regeneration, microfiltration, ultrafiltration, nanofiltration.
INTRODUCTION
The European Commission recently adopted an ambitious Circular Economy Package, which includes revised legislative proposals on waste to stimulate Europe’s transition towards a circular economy which will boost global competitiveness, foster sustainable economic growth, and generate new jobs. _____________
1Łukasiewicz Research Network—Institute for Sustainable Technologies, 6/10 K.
over the course of its mandate, the Commission intends to support a series of actions on water reuse, including a legislative proposal on minimum requirements for the reuse of wastewater. The proposed actions will contribute to “closing the loop” of product life cycles, through greater recycling and re-use, and bring benefits for both the environment and the economy [1]. In Poland, the industrial wastewater discharged into the sewerage system or into environment or recycled to the production process must meet the criteria specified in the relevant legal acts, including the following: on the conditions for the wastewater introduction into sewerage equipment [2], on the wastewater discharged into water or soil [3], and on the quality of water intended for human consumption (in case of water recovered for its use in food production) [4].
The food industry consumes large amounts of water, which is involved in many processes and unit operations, including production and cleaning purposes [5]. In particular, the dairy industry is one of the most polluting food industries considering the generated effluent [6]. Around 12 billion tons of milk is produced annually in our country, which leads to the production of around 92 000 m3 of wastewater per day. Depending on the technology used and the production of the assortment, the unit water consumption is from 3 L up to 20 L on 1 L processed milk [7,8].
Proper reconditioning (treatment of water intended to be reused) and reuse of wastewater in the food industry is a promising alternative to current practices of discharging these streams in places where they can negatively affect the environment [9,10].
cleaning cost decreases. It is possible to use membrane filtration to recycle of the cleaning solutions. In the literature, there are only a limited number of studies on the recovery of detergents or detergent compounds for recycling in CIP processes [17-19]. Microfiltration (MF) can be used to remove solids in suspension as a pre-treatment method, while ultrafiltration (UF) can be proposed as a method for the removal of surfactants from aqueous solutions with critical micelle concentration (CMC). However, when the concentration is as low as the monomer concentration, nanofiltration (NF) is an effective removal process [18].
In order to recover acidic solutions from the dairy industry cleaning process, a number of experiments were carried out by Novalic et al. [19]. Two acidic solutions with different COD were passed through NF membranes. The highest permeate flux and the lowest COD (in the feed solution) were obtained for the solution that had been applied after the alkaline step in the cleaning process. This was because the degree of contamination in the spent acidic solution was much lower. While, Merin et al. [20] shown that when MF and NF permeates of reused solutions were put to a cleaning test using UF membranes fouled with whey proteins, but they achieved better cleaning efficiency compared to newly prepared NaOH solutions. The life span of these solutions at the dairy plant is arbitrarily fixed with no scientific basis [20]. The recycling of caustic solutions has an enormous economic impact, since the consumption of caustic soda in the dairy industry is twice that of nitric acid. However, the recovery of acidic solutions is also considered in order to minimize the discharge of nitrates into the environment. This leads to the saving water, chemicals, and energy, and avoids the disposal of cleaning agents into the environment.
The aim of the present work was to study the possibility of the application of membrane filtration processes for effective regeneration of caustic and acidic streams from CIP processes of technological lines of dairy plants.
EXPERIMENTAL
Pilot Membrane Installation
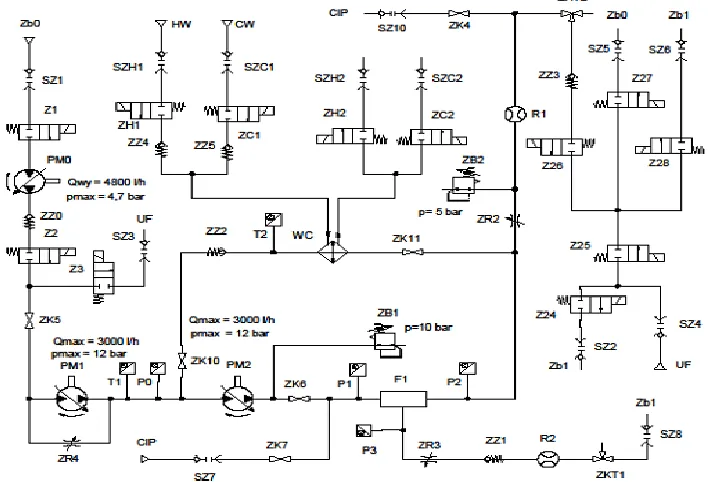
[image:4.612.122.476.344.585.2]In the first stage of the study, the caustic and acidic wastewaters contaminated with macromolecular organic compound were treated with one-stage membrane filtration. Each of membrane filtration processes were performed in batch mode, which is a transient state process because of the change of volume in liquid phase (VRF—volume reduction factor) and the change in the concentration of each of the components in feed solution. In the feed tank, 100L of model wastewater was placed, which was then pumped from the tank to the membrane module at a constant pressure that was adequate for the membrane technique that was used. After passing through the filtration module, the feed was separated into two different streams: stream of purified filtrate (permeate), and the stream of concentrate (retentate). Filtrate stream was collected in a separate tank and a retentate stream was recycled to the feed tank. As a result, the concentration of compounds which were stopped by the membrane was gradually increasing. Microfiltration (MF) was performed using pilot membrane installation (Fig. 1) under the pressure between 0.5 and 2.0 bar, and the retentate flow was changing between 100 and 400 L/h.
Figure 1. The scheme of the pilot microfiltration installation.
F1 – membrane module; P0, P1, P2, P3 – manometer; PM0, PM 1 – feed pump; PM2 – circulation pump; T1, T2 – electronic thermometer; R1, R2 – flowmeter; WC – heat exchanger; ZB1, ZB2 –
emergency valve; ZH2, ZC2, ZC1, ZH1, Z1, Z2, Z3, Z27, Z25, Z26, Z28, Z24 – solenoid valve; ZH2, ZC2, ZC1, ZH1, Z1, Z2, Z3, Z27, Z25, Z26, Z28, Z24 ZK4 ZK5 ZK6, ZK7, ZK10, ZR2,
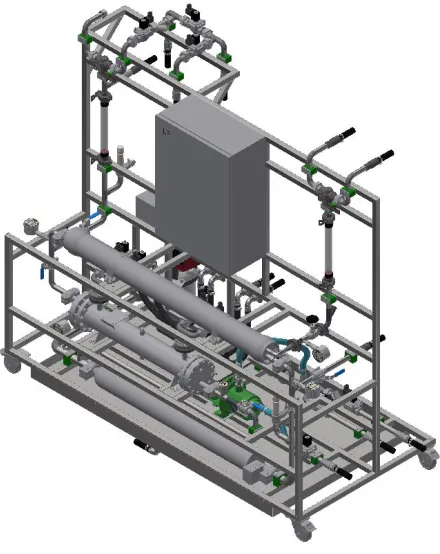
In turn, ultrafiltration (UF) was performed using the pilot membrane installation, which is shown on a 3D visualization (Fig. 2) under the pressure between 4.0-8.0 bar, and the retentate flow changing between 100-250 L/h. The process of MF and UF was performed until 80 L of the permeate was received.
Figure 2. 3D visualization of pilot ultrafiltration installation.
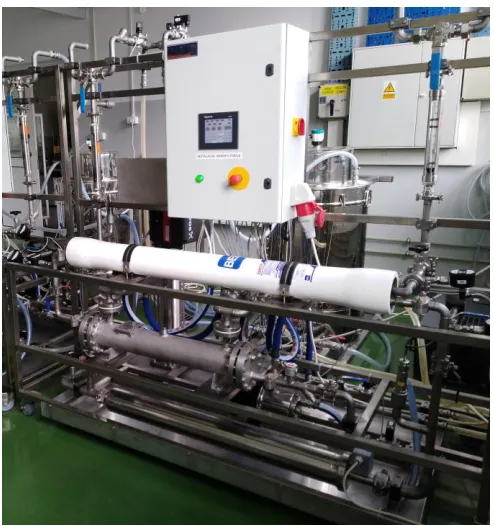
Figure 3. Photo of pilot nanofiltration installation.
[image:6.612.174.421.82.345.2]The spiral wound membrane modules were used in this study. The characterization of used membranes is shown in Table I.
TABLE I. CHARACTERISTICS OF TESTED MEMBRANES DURING MF, UF AND NF PROCESSES.
Parameters MF membrane UF membrane NF membrane
Manufacturer TriSep Microdyn-Nadir TriSep
Model TM10-QXF UP150 TS80
Polymer PVDF PES PA
Active area, [m2] 5.8 6.0 8.2
Pore size, [µm] 0.2 - -
Cut-off, [kDa] - 150 -
Max. pressure, [bar] 4 10 41
Max. temperature, [ºC] 45 45 45
pH range 1-12 2-11 1-12
The basic physical and chemical properties each of streams (feed, permeate and retentate) was investigated after finish each membrane process. The value of pH was measured using a Seven Multi Mettler Toledo device. Turbidity was determined using a HACH measurement device. Samples of feed, permeate, and retentate were analysed in terms of total nitrogen (TNb), total phosphorous (TP), chemical oxygen demand (COD), and total organic carbon (TOC), using HACH cuvette tests for a UV-VIS DR 6000 spectrophotometer. The obtained results of physical and chemical properties analysis was used to determine the retention of components that shows the efficiency of wastewater regeneration. During each of the processes, the permeate flux and volume reduction factor was analysed, which are the basic parameters that shows the efficiency of filtration processes. The equations that were used to determine parameters which were used to control the processes are shown in Table II.
TABLE II. PARAMETERS CONTROLLED DURING REGENERATION OF WASTEWATER BY PILOT MEMBRANE INSTALLATION.
Parameter Equation
Retention (Ri)
Permeate flux (JP)
Volume reduction factor (VRF)
CN - concentration of component in feed [mg/L], CR - concentration of component in retentate
[mg/L], CP - concentration of component in permeate [mg/L], Am – membrane area [m2], t - time
needed to receive a defined volume of permeate [h], VN – volume of feed [L], VR – volume of
retentate [L], VP – volume of permeate [L].
RESULTS AND DISCUSSION
Regeneration of caustic cleaning baths using MF and MF/UF
circulation pump and a constant value of retentate flow (400 L/h), it was found that using higher transmembrane pressure caused an improvement of the efficiency of regeneration caustic wastewaters generated during CIP cycles (Fig. 4b). However, it was observed that the drop of permeate flux in relation to the time of volume produced a reduction factor that depends on MF process parameters (Fig. 4). Considering the efficiency of the regeneration of caustic wastewaters, it is favourable to perform MF at a transmembrane pressure of 2.0 bar and an intensity of retentate flow at 400 L/h (Fig. 4b). Application these parameters during MF cause reduces fouling (deposition of components of filtration medium at the surface and inner structure of polymeric membranes).
(a)
0 2 4 6 8 10 12 14 16 18
0.0 1.0 2.0 3.0 4.0 5.0 6.0
JP
[L
/(
m
2h)
]
VRF [-]
100 L/h 250 L/h 400 L/H
(b)
0 10 20 30 40 50 60 70
0.0 1.0 2.0 3.0 4.0 5.0 6.0
JP
[L
/(
m
2h)
]
VRF [-]
[image:8.612.172.430.242.640.2]0.5 bar 1.0 bar 2.0 bar
Figure 4. Permeate flux (JP) vs. volume reduction factor (VRF) during MF of the caustic cleaning
bath: (a) the process carried out at constant transmembrane pressure (TMP = 2.0 bar); (b) the
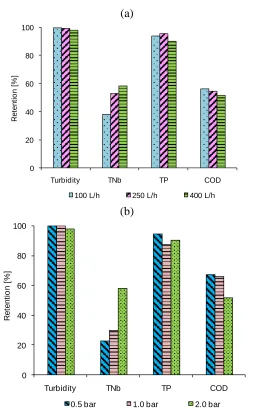
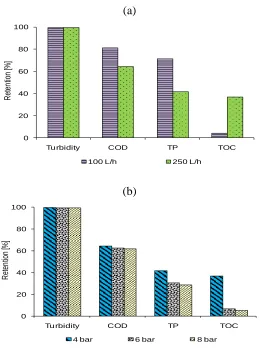
MF was able to remove turbidity completely, while fractioning and concentrating components of the filtration medium at the same time. That was shown by different levels of the retention of total nitrogen (TNb), total phosphorous (TP), and COD, which was independent of the used process parameters (Fig. 5).
(a)
0 20 40 60 80 100
Turbidity TNb TP COD
R
e
te
n
ti
o
n
[%
]
100 L/h 250 L/h 400 L/h
(b)
0 20 40 60 80 100
Turbidity TNb TP COD
R
e
te
n
ti
o
n
[
%
]
[image:9.612.185.439.176.585.2]0.5 bar 1.0 bar 2.0 bar
Figure 5. Retention of caustic cleaning baths parameters after MF: (a) process performed at constant transmembrane pressure (TMP = 2.0 bar); (b) process performed at constant retentate
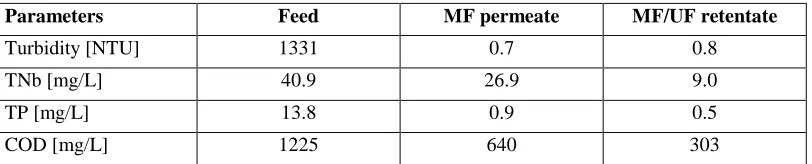
A comparison of basic psychical and chemical parameters for each of the streams (feed, permeate, retentate) of regenerated wastewater is shown in Table III. Treating alkaline wastewater that was contaminated by macromolecular organic compounds using MF caused a reduce level of contamination (Table 3). This also concerned both turbidity (from 1331 NTU to 0.7 NTU) and level of TP (from 14 mg/L to below 1 mg/L) and COD (from 1225 mg/L to 640 mg/L). In turn, the concentration of TNb was decreased slightly (from 41 mg/L to 27 mg/L). Application of the integrated MF/UF system allowed decreasing the concentration of TNb to a value of 9.0 mg/L and COD to value of 303 mg/L.
TABLE III. PHYSICAL AND CHEMICAL PARAMETERS VALUES OF CAUSTIC CLEANING SOLUTION REGENERATED BY MF* AND INTEGRATED MF/UF** SYSTEM.
Parameters Feed MF permeate MF/UF retentate
Turbidity [NTU] 1331 0.7 0.8
TNb [mg/L] 40.9 26.9 9.0
TP [mg/L] 13.8 0.9 0.5
COD [mg/L] 1225 640 303
*TMPMF = 2.0 bar, QR = 250 L/h; **TMPUF = 4.0 bar, QR = 250 L/h
Regeneration of acidic cleaning baths using UF and UF/NF
TABLE IV. THE EFFECT OF PROCESS PARAMETERS ON EFFICIENCY OF REGENERATION OF ACIDIC CLEANING BATHS DURING UF. Transmembrane pressure
(TMP) [bar]
Retentate flow (QR)
[L/h]
Permeate flux (JP)
[L/(m2h)]
4.0 100 16.7
4.0 250 41.7
6.0 100 16.7
6.0 250 41.7
8.0 100 16.7
8.0 250 41.7
In turn, analysing the level of the retention of compounds in the filtration medium show that using high transmembrane pressure caused a drop in the efficiency of wastewater regeneration (Fig. 6b).
(a)
0 20 40 60 80 100
Turbidity COD TP TOC
R
et
en
tio
n
[%
]
100 L/h 250 L/h
(b)
0 20 40 60 80 100
Tu rbidity COD TP TOC
R
et
en
tio
n
[%
]
4 bar 6 bar 8 bar
Figure 6. Retention of acidic cleaning baths parameters after UF: (a) process performed at constant transmembrane pressure (TMP = 4.0 bar); (b) process performed at constant retentate
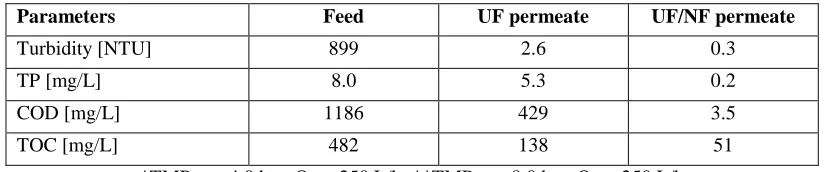
[image:11.612.186.447.291.639.2]Physical and chemical properties of regenerated wastewater contaminated with macromolecular organic compounds are shown in Table V. Treating acidic wastewater with UF process was able to decrease turbidity (from 899 NTU to 2.6 NTU) and limited the reduction of TP (from 8 mg/L to 5 mg/L), COD (from 1186 mg/L to 429 mg/L), and TOC (from 482 mg/L to 138 mg/L). Integration of UF and NF gives more satisfying results (Table 5). Treating acidic wastewater using integration of UF/NF was able to remove of TP to 0.2 mg/L, COD to 3.5 mg/L, and TOC to 51 g/L.
TABLE V. PHYSICAL AND CHEMICAL PARAMETERS VALUES OF ACIDIC CLEANING SOLUTION REGENERATED BY UF* AND INTEGRATED UF/NF** SYSTEM.
Parameters Feed UF permeate UF/NF permeate
Turbidity [NTU] 899 2.6 0.3
TP [mg/L] 8.0 5.3 0.2
COD [mg/L] 1186 429 3.5
TOC [mg/L] 482 138 51
*TMPUF = 4.0 bar, QR = 250 L/h; **TMPNF = 8.0 bar, QR = 250 L/h
CONCLUSIONS
The aim of study was to evaluate the abilities of using membrane processes for effective regeneration of acidic and caustic wastewaters generated during washing technological lines in the dairy industry. Results of research based on model solutions show that caustic cleaning solution can be treated by using integration of MF/UF processes. In turn, to regenerate acidic cleaning solutions, it is necessary to use an integration of UF/NF processes.
REFERENCES
1. European Commision, Communication from the Commission to the European Parliament,
the Council, the European Economic and Social Committee and the Committee of the Regions, Closing the loop—An EU action plan for the Circular Economy, COM(2015) 614, Brussels, 2.12.2015.
2. Rozporządzenie Ministra Budownictwa z dnia 14 lipca 2006 r. w sprawie sposobu realizacji
obowiązków dostawców ścieków przemysłowych oraz warunków wprowadzania ścieków do urządzeń kanalizacyjnych (Dz.U. 2006 nr 136 poz. 964).
3. Rozporządzenie Ministra Środowiska z dnia 18 listopada 2014 r. w sprawie warunków jakie
należy spełnić przy wprowadzaniu ścieków do wód lub do ziemi, oraz w sprawie substancji szczególnie szkodliwych dla środowiska wodnego (Dz.U. 2014 poz. 1800).
4. Rozporządzenie Ministra Zdrowia z dnia 13 listopada 2015 r. w sprawie jakości wody
5. Linclau, E., J. Ceulemans, K. De Sitter, and P. Cauwenberg. 2016. “Water and detergent
recovery from rinsing water in an industrial environment”, Water Resources and Industry,
14:3-10.
6. Alkay, E. and G.N. Demirer. 2015. “Water recycling and reuse in soft drink/beverage
industry: A case study for sustainable industrial water management in Turkey”, Resources,
Conservation and Recycling, 104:172-180.
7. Struk-Sokołowska, J. 2011. “pływ ścieków mleczarskich na frakcje ChZT ścieków
komunalnych”, Inżynieria Ekologiczna, 24:130-144.
8. Dąbrowski, W. 2011. “Określenie zmian stężenia zanieczyszczeń w profilu oczyszczalni
ścieków mleczarskich na przykładzie S.M. Mlekovita w Wysokiem Mazowieckiem”,
Inżynieria Ekologiczna, 24:236-242.
9. Khor, C., D.C.Y. Foo, M.M. El-Halwagi, R.R. Tan, and N. Shah. 2011. “A superstructure
optimization approach for membrane separation-based water regeneration networks
synthesis with detailed nonlinear mechanistic reverse osmosis model”, Industrial &
Engineering Chemistry Research, 50:13444-13456.
10. Janiszewska, J. and P. Rajewska. 2017. “The possibility for the use of ultrafiltration for the
treatment of potato processing water”, Journal of Machine Construction and Maintenance,
4:131-139.
11. Paugam, L., D. Delaunay, W.N. Diagne, and M. Rabiller-Baudry. 2013. “Cleaning of skim
milk PES ultrafiltration membrane: On the real effect of nitricacid step”, Journal of
Membrane Science, 428:275-280.
12. Kowalik-Klimczak, A. and E. Stanisławek. 2018. “Reclamation of water from dairy
wastewater using polymeric nanofiltration membranes”, Desalination and Water Treatment,
128:364-371.
13. Luo, J., L. Ding, B. Qi, Y.M. Jaffrin, and Y. Wan. 2011. “A two-stage ultrafiltration and
nanofiltration process for recycling dairy wastewater”, Bioresource Technology,
102:7437-7442.
14. Navarro-Guerrero, A.E., A.G. Rios-Castillo, C. Ripolles Avila, A.S. Hascoet, X. Felipe, J.J.
Rodriguez Jerez. 2019. “Development of a dairy fouling model to assess the efficacy of
cleaning procedures using alkaline and enzymatic products”, Lebensmittel-Wissenschaft &
Technologie, 106:44-49.
15. Meneses, E.Y. and A.R. Flores. 2016. “Feasibility, safety, and economic implications of
whey-recovered water in cleaning-in-place systems: A case study on water conservation for
the dairy industry”, Journal of Dairy Science, 99:3396–3407.
16. Thomas, A. and C.T. Sathian. 2017. “Cleaning-in-Place (CIP) System in Dairy
Plant-Review”, Journal of Environmental Science, Toxicology and Food Technology, 8/6:41-44.
17. Kowalik-Klimczak, A. 2017. “The possibilities of using membrane filtration in the dairy
industry”, Journal of Machine Construction and Maintenance, 2(105):99-108.
18. Suárez, L., A.M. Díez, R. García, and A.F. Riera. 2012. “Membrane technology for the
recovery of detergent compounds: A review”, Journal of Industrial and Engineering
Chemistry, 18:1859-1873.
19. Novalic, S., A. Dąbrowski, and K.D. Kulbe. 1998. “Nanofiltration of caustic and acidic
cleaning solutions with high COD: Part 2. Recycling of HNO3”, Journal of Food
Engineering, 38:133-140.
20. Merin, U., E. Boyaval, and G. Daufin. 2002. “Cleaning-in-Place in the dairy industry: