2018 International Conference on Computer Science and Software Engineering (CSSE 2018) ISBN: 978-1-60595-555-1
A Highly Automatic Petrogeochemistry
Diagram Plotting and Analysis System
Based on MVVM
Mingguang Diao, Danning Zhao, Tao Xue, Wenji Li
and Nawei Zheng
1
ABSTRACT
A new software, GeoDrop based on the Petrogeochemistry experts’s practical working methods, is developed to implement Petrogeochemistry diagrams’ plotting and analysis automaticly. System takes the Petrogeochemistry parameters and diagrams as the process objects. The method is to intersect Petrogeochemistry and computer software technology. By analyzing the characteristics of two-variable and three-variable diagrams, it divides data calculation into three types, including major and trace elements’ related parameters calculation, major and trace elements’ standard mineral calculation, and isotope calculation. For plotting, system can be used for volcanic rocks, intrusive rocks, sedimentary rocks and so on. For extension, system also supports customized diagram types. All these above functions in GeoDrop can help users implement data processing, analysis and automatic plotting quickly.
INTRODUCTION
For the Petrogeochemical researchers, diagram is the most common and effective tool when they do some investigation on geochemical data. Now, as the research achievements continue to emerge in the Petrogeochemical field and the
Mingguang Diao1, Danning Zhao1, Tao Xue1, Wenji Li2, Nawei Zheng1
1
School of Information Engineering, China University of Geosciences, Beijing 100083, China
2
diagrams continue to update. All these above situations make it hard to satisfy the current needs just depend on hand-plotting. So it asks for a higher demand to keep the accuracy in the process of Petrogeochemical study, which means a big challenge for us. Based on these, lots of geochemical data processing software have emerged during this period, for example, NewPet [1], MinPet [2], Isoplot [3], GCDKit [4], and PetroGraph [5], all these softwares extract, separate and combine information from the original Petrogeochemical data. Then they quantify, analyze, plot and explain, which means they make the hand-plotting into computerization and help users to analyze the data into diagrams quickly. But, all these software also have their own problems. For instance, Newpet and MinPet run under DOS, respectively, these operating systems are now out of date. When loaded them into modern MS Windows systems, they can’t work well [5-6]. Isoplot only supports the isotope diagrams [3]. GCDkit is expandable only by means of plug-ins, and users must program any changes using the R language, which is difficult to use [6]. Although PetroGraph is significantly improved and easily edited, it’s still unable to add new diagram types [7]. For Chinese researchers, the most often used tools are Geokit [8], GCDPlot [6] or GeoPlot [7]. But all these software cannot make form directly, all need to rely on Microsoft Excel [5], so they will be unavailable when the version of Office does update.
GeoDrop is developed based on synthesizing all above softwares’ advantages and improving their weaknesses. The advantages of GeoDrop includes: making diagrams’ plotting high automatically, and supporting users to customize diagram as needed. On the basis of the diagram data processing and analysis flow, this article will focus on the main functions, which include sample-data management, parameter calculation, diagrams automatic plotting and outputs, and the diagrams extension.
DIAGRAM DATA PROCESSING AND ANALYSIS FLOW
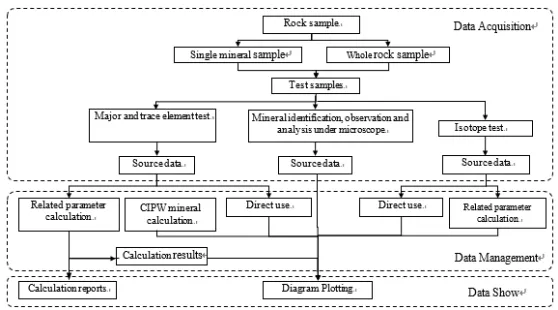
Figure 1. The petrogeochemistry data processing flow.
As shown in Figure 1, the first part is data acquisition, which means collecting rock samples and analyzing them, that is, detecting, identifying, separating and collecting elements of samples, and then obtaining source data. The second part is data analysis, which refers to processing, analyzing, plotting and interpreting data received from the first part. The last part is a data show that displays the results in the form of a calculation report or chart.
GEODROP OVERVIEW
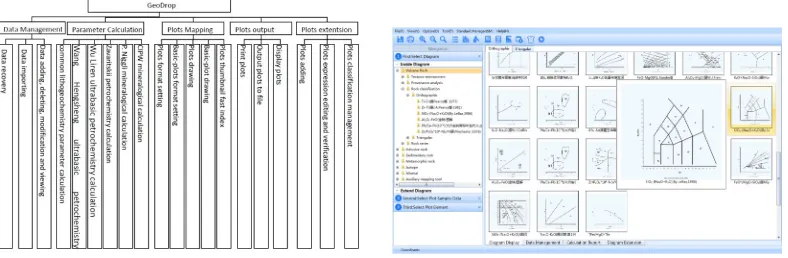
The category of system functions depend on the actual needs and the classification of petrogeochemistry data. The system consists of data management, parameter calculation, diagrams automatic plotting and outputs, and diagrams extension, as Figure 2 shows. It collects 230 diagrams, which are divided into 7 broad groups and 28 smaller groups [11], and 4 tool diagrams. The system is constructed by the software development method basing on the component. Its interface consists of operation navigation area, thumbnail indexing area, menu bar, status bar, and label. To provide an easy way for finding diagrams, the system adopts two kinds of fast indexing: tree view indexing and thumbnail indexing.
In the aspect of diagram plotting, the system adopts the guide method for sample importing, targeted diagram selection, sample selection, sample classification formatting, automatic parameter selection and calculation, graphic to guide the user to map the diagram. The main interface of this system is illustrated in Figure 3.
Figure 2. System function tree. Figure 3. System main interface.
Sample-Data Management
This module consists of major and trace elements management, mineral management, isotopic elements management, and includes the functions like adding data, deleting data, modifying data, querying data and calculating field formula. The system supports the data input and output from Excel. On the basis of the data preprocessing of major and trace elements analysis result table, isotopic elements analysis result table, fluid inclusion analysis result table, the system adopts table, group and sample to process data. In addition to the basic information of samples, each sample record can incorporate a major and trace elements record or an actual mineral record or an isotopic element record. Since elements such as Sr, Ni, Zr, Cr, Ba are able to be recorded in a form of oxide in the course of recording major and trace elements [12], the system provides an interface for recording the related oxides.
Obtained from Figure 4, system will generate three-level data structures: table, group and sample Users can view basic information about the sample you choose and modify. In the Sample data management area, you can click the buttons to import and export, add, modify, and delete.
Users are able to add, modify, delete information of the chose sample and implement data’s Oxygen transformation in the major and trace elements management interface. All functions of mineral data management interface and the Isotopic data management interface are the same as the the major and trace elements management interface.
Parameter Calculation
(alkalic rate, felsic index, mafic index, magnesium iron ratio, oxidizability, and oxidation ratio), Rittman index, P. Niggli numerical method, Zavaritskii petrochemistry calculation, Wang Hengsheng and Wu Liren Ultrabasic rocks' petrochemistry calculation.
Figure 4. Sample-Data management. . Figure 5. Parameters calculation.
Users can select a sample data to do the parameters calculation in the sample data list. After selecting the sample, check the parameters calculation method you want, and then, click the button “Report” to achieve results reports in Excel format. If you want to check the CIPW method, you need to set the parameters as needed on pop up window.
Diagrams Automatic Plotting and Outputs
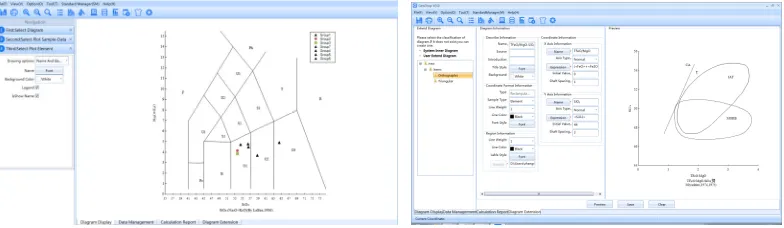
GeoDrop implements the highly automatic plotting for drawing diagrams, which means users just need to follow the wizard, including select diagram, plot sample-data, and plot element, at last save and output it in common picture format, so that it can be pasted in document and achieve the union of text and figure. All the built-in 230 diagrams in the system are divided into two classifications, orthographic and triangular. Basing on the 230 diagrams, the system has designed 5 kinds of plotting method [13]. The plotting using bi-coordinate-axis system is illustrated in Figure6.
The first step is to select the diagram for automatic plotting, as Figure 3, and then double-click the thumbnail to open the plotting interface. The second step is to select the sample data that needs to plot, set the plotting format, and click the button “Plot”. The last step is to set the axis format of base map, including axis, curve and area format, diagram name and background color, gridlines format.
According to Figure 7, In the process of completing diagram information, users just need to browse and choose the diagram xml file or customized one. To custom one needs four steps: first step, to complete the diagram basic information; second step, to complete coordinate axis information; third step, to complete coordinate axis format information; fourth step, to complete regional and ional label information. After completing the diagram information and import xml file, users can preview the customized diagram and save it in the system database to use next time directly.
[image:6.612.104.496.188.302.2]
Figure 6. Plotting using bi-coordinate-axis system. Figure 7. Diagram Extension interface.
CONCLUSIONS
GeoDrop is a user-friendly program, which is developed by the C# language and runs under the platform of Windows7 or above. Relative to the current mainstream Petrogeochemistry diagram processing software, it has three advantages as follows:
Independence, which means it does not rely on the third-party software. GeoDrop does not need to relay on Excel when do the sample data management and diagrams plotting. For this reason, no matter how the version of MS Office updates, it has no effect on GeoDrop. But, users also can use the import and export functions of GeoDrop to operate data in Excel format. So, GeoDrop is independent, and also can be compatible with other software at the same time.
Highly automated, which means users can implement plotting diagram following the wizard step by step. By understanding the basic diagrams processing flow when Petrogeochemical experts do research, in GeoDrop, we break the whole process into three steps: select diagram, select plot sample-data, and select plot element. In each step, users just need to do some simply options or settings that can implement the Petrogeochemical data’s diagram plotting.
The all above advantages will make GeoDrop have a high usability in the Petrogeochemistry field.
ACKNOWGEMENT
Funded by China Geological Survey Project “Technological Innovation and Demonstration of Old Mine Remoulding” (1212011220737).
REFERENCES
1. Clarke, D., 1993. NEWPET Software Program. Department of Earth Sciences, Memorial University of Newfoundland, St. Johns, Newfoundland, Canada.
2. Richard, L.R., 1997. MinPet. Software Program. MinPet Geological Software, Gatineau, Canada. 3. Ludwing K R, 2001. Users Manual for Isoplot/Ex rev. 2.49: A Geochronological toolkit for
Microsoft Excel , Berkeley Geochronology Center Special Publication No. 1a, 1~55.
4. Janousek, V., Farrow, C.M., Erban, V, 2006. Interpretation of Whole rock Geochemical Data in Igneous Geochemistry Introducing Geochemical Data Toolkit (GCDkit), Journal of Petrology, 1255~1259.
5. M. Petrelli, G. Poli, D. Perugini, A. Peccerillo, 2005. PetroGraph: A new software to visualize, model, and presentgeochemical data in igneous petrology, Geochemistry Geophysics Geosystems.
6. Xiaorui Wang, Weifeng Ma, Shan Gao, Lin Ke, 2008. GCDPlot: An extensible microsoft excel VBA program for geochemical discrimination diagrams. Computers & Geosciences, 1964~1969. 7. Jinbin Zhou, Xianhua Li. GeoPlot: an excel VBA program for geochemical data plotting.
Computers & Geosciences, 2006.554–560.
8. Yuanfa LU. GeoKit—A geochemical toolkit for Microsoft Excel. Geochimica, 2004, 33(5):46~464[in Chinese].
9. Sanming Chen, Jianming Hu, Yanli Ding, et al. Geoscience Information Engineering Practical So ftware Course, Bei Jing: Metallurgical Industry Press, 2009.1~42[in Chinese].
10. Diao Ming Guang, Xue Tao, Lv Zhicheng, et al. Research and development of petrographic geochemical graphic information analysis assistant system [J]. geological bulletin, 2011, 30 (05): 729-736[in Chinese].
11. General Administration of Quality Supervision, Inspection and Quarantine of the People’s Republic of China. GB/T 17412.2-1998. Classification and nomenclature schemes of the rocks— Classification and nomenclature schemes of sedimentary rock. Bei Jing: Standards Press of China, 1998.06.17[in Chinese].
12. Jiaxiang Qiu, Jingqian Lin. Petrogeochemistry. Bei Jing: Geological Publishing House, 1991.88~267[in Chinese].