2018 International Conference on Computer, Electronic Information and Communications (CEIC 2018) ISBN: 978-1-60595-557-5
Power User Profile under Multi-source Heterogeneous
Data Fusion in Smart Grid
Bao-xian GUO
1,3,*, Ying XU
2, Ren-jie LI
1and Xing-xiong ZHU
31
State Grid Electronic Commerce Co. Ltd, Beijing, China 2
State Grid Zhejiang Electric Power Company, Hangzhou, China 3
State Grid Huitongjincai (Beijing) Information Technology Co. Ltd, Beijing, China
*Corresponding author
Keywords: Power user profile, Multi-source fusion, Heterogeneous data, Power business.
Abstract. In order to better understand the usage and distribution of power users, analyze the characteristics of power users' big data, and then realize the precise positioning of power users, in this paper, we established a unified model of heterogeneous data fusion based on user Profiles, and fuses heterogeneous user data through user Profile technology, and so as to achieve the purpose of strengthening centralized management and segmented individual service capabilities of multiple electronic service channels.
Introduction
The user Profile (user information tagging) is a virtual representative of a real user, which is a tagged user model that is excavated according to the user's real data (e.g., social attributes, lifestyle habits, consumer behavior, etc.). The power user Profile data modeling is combined with the actual needs of customers, to find out the relevant data entities, data entities as the central data dimension types and relationships, to form a modeling system that meets the customer's actual situation[1].
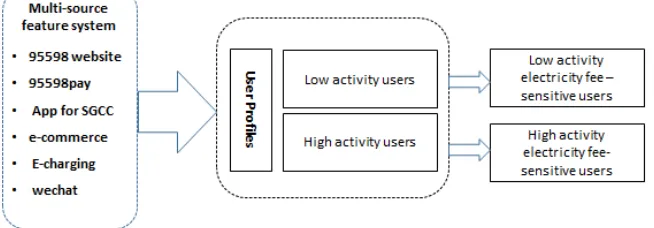
We integrated multi-sources of data: 95598 website, 95598pay, App for SGCC, e-commerce, E-charging and wechat of power. We strive to establish a heterogeneous user data model based on “Internet+” marketing services through the Profile technology and provide strong support for the accurate analysis of the user types and user graphics of the company’s various marketing service electronic channels [2]. The design and development of electronic channel unified identity authentication and service supervision system provide data model preparation, so as to realize seamless integration between the unified identity authentication and service supervision system and each channel.
Power User Profile
Acquiring User Information
Power user Profile data is mainly divided into four categories: basic attributes, power consumption information, payment information, and appeal information. These data are distributed in different information system files, such as user basic attributes, payment information in the marketing business system, user electricity information in the electricity information collection system, and user demand information in the 95598 business support system.
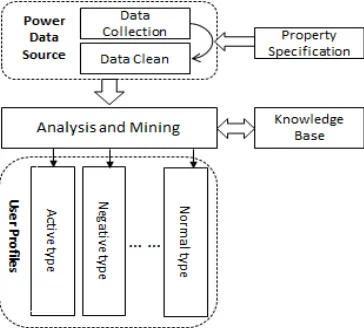
Create User Behavior Tag Library
partially obtained through a series of algorithms or rules (question tolerance, appeal preferences, etc.), as shown in Figure 1.
Figure 1. Power user behavior tags.
Build a Profile of a Power User
The purpose of the user's Profile is to analyze the user's behavior and provide the customer with a better service based on the analysis result. Quantitative information is not conducive to the analysis of customers. Quantitative information needs to be converted into qualitative information, and different customer groups are analyzed through information categories.
Through the user tag system, individual user Profiles and group Profiles can be developed. By inputting the user's unique identification information by the marketing personnel, an individual Profile covering its basic attributes, power consumption characteristics, payment characteristics, and appeal characteristics may be performed from an independent user.
Instructing first-line marketers adopt individualized and differentiated service strategies in on-site operation services to reduce the scope and degree of individual service risks and improve user service satisfaction [4]. In addition, the marketing staff selects different tag features of user basic information, electricity use behavior, payment behavior, and appeal behavior, and then carries out the user group image around the selected tag, and focuses on the composition of the child tag feature of the group of user Profiles. The situation aims at observing differences in image composition of the same user group in different regions and at different times. It helps horizontal comparison of user groups in each power supply unit, or the trend analysis of user groups in the same power supply unit, and then adopts differentiated marketing strategies and assessments of marketing effectiveness.
[image:2.612.219.401.554.718.2]Power User Group Identification and Analysis
Power User Behavior Relationship Model
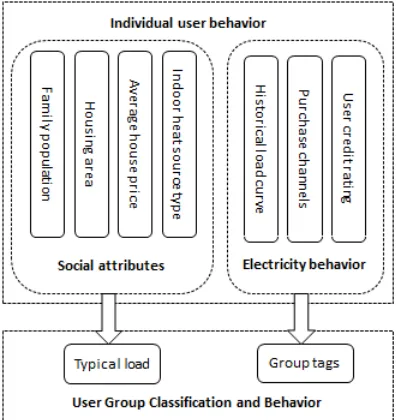
[image:3.612.207.405.281.491.2]As shown in Figure 3, there are two types of individual behavior descriptions for power users. The first is the social attributes of power users, including household population, housing area, average housing price, indoor heat source type, etc., reflecting the power users' Consumption ability and potential, this type of description can help the consumer to portray the image of the user, and then categorize or summarize the user. The second is the power user's electricity consumption behavior, including historical load curve, Internet purchase behavior, and user credit rating [5]. It reflects the electricity consumption characteristics of the electricity users, such as actual electricity consumption and purchasing channels, and dynamically displays the characteristics of the user's electricity consumption behavior [6]. This can help the electricity sales user understand the user's electricity consumption patterns and consumption habits. The classification and behavioral characterization of the power user group is reflected in the individual behavior based on the user's behavior, forming a description of the typical load of the group and the group label [7]. The group label contains the common social attributes and power consumption behaviors of the users in the group.
Figure 3. Model of Power users’ relation.
Power User Image Data Sheet
To create a Profile of a power user, first of all, it is necessary to use a part of a list of known power users as the basis of analysis. Based on this part of the power user, the power user's cognition is combined to screen out the real power users. The list of power users should include the power user's user ID and SIM card status information. Take power meter reading users as an example.
Multi-source Heterogeneous Power User Big Data Feature Analysis
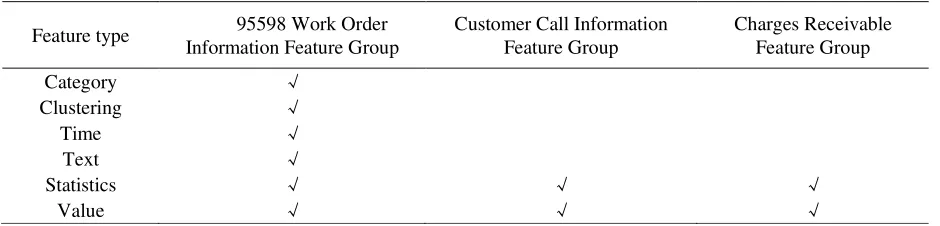
Table 1. Feature system.
Feature type 95598 Work Order Information Feature Group
Customer Call Information Feature Group
Charges Receivable Feature Group
Category √
Clustering √
Time √
Text √
Statistics √ √ √
Value √ √ √
Category Characteristics
The types of user consultation services are different, reflecting the different needs of users. Some users report repairs to failures, while others are concerned about electricity charges to inquire about electricity charges. Judging from the urban and rural categories, it is clear that users in urban centres and remote mountainous areas are also more sensitive to electricity charges. Based on the above analysis, this article deals with category fields such as business types, urban and rural categories, and power supply units. For low-activity users, each user has only one category for the same field. For high-activity users, each user corresponds to the same field. Multiple values, in order to make full use of the information expressed between multiple values
Clustering Features
Some field codes have too many values. For example, there are hundreds of values for power supply unit codes. After statistical observation, we found that there are fixed coding rules for these fields. Using these rules, we can cluster the codes and process them according to the characteristics of the features, thus achieving feature dimensionality reduction.
Time Characteristics
Since the electricity demand is different in different seasons and at different times, there are also differences in the number of electricity-sensitive users at different time periods. We count the number of sensitive users and non-sensitive users in each day of the year 365 days, as shown in the figure 3.
Text Features
The contents of the work order acceptance record the content of the customer's narration, which reflects the customer's true appeal and is a direct reflection of the user's sensitivity. Its basic format is "[theme] main content", such as "[inquiry electricity fee] customers query the amount of electricity charges this month, has been informed", "[time-rate electricity price] whether the customer consultation has been opened on time-of-use price/time-sharing price policy/points The price range and conditions of the electricity price cartoon, etc. We extracted a total of three textual features for each user's text content.
Statistical Features
Numerical Characteristics
[image:5.612.148.475.179.293.2]For numerical data, some common statistics often reflect the deep information of the data, for example, the median reflects the centralized trend of data distribution, the standard deviation reflects the degree of data dispersion, and so on. Therefore, we use normalized processing for single values of low-activity users, and construct basic statistics for multiple values of high-activity users (maximum, minimum, mean, medium Number of digits, standard deviation, including field time, call duration, total power, and amount of electricity as shown in figure 4.
Figure 4. Model for power user.
Summary
With the development of power information and communication technologies, the collection and analysis of power user data is becoming more and more convenient and efficient, laying the foundation for achieving accurate Profiles for power users. Using user Profile technology, combined with power customer marketing data, 95598 work order data, electricity collection data, distribution and transformation management data and other multi-source heterogeneous data integration, analysis and establishment of electricity customer labeling system to form a multi-level, multi-level Dimensional and three-dimensional panoramic Profiles of customers help business people to comprehensively, accurately, and quickly recognize customers during business operations, and facilitate the development of targeted personalized service programs, which can effectively improve service quality and work efficiency, and win customers. Satisfaction and establishing a good corporate image play an important role.
Acknowledgement
This work is supported by the science and technology project of State Grid Corporation of China (SAP No. 52110417001D).
References
[1] Meng W, Xuexia W U, Jing L I, et al. Power user Profiles based on big data technology[J]. Telecommunications Science, 2017.
[2] Yuan-Bin X U. Research and application of fusion method of multi-source heterogeneous data based on large power parameters [J]. Electronic Design Engineering, 2016.
[3] Li H, Ma G. Support Vector Machine Based Approach for Feature-Level Multiple Source and Heterogeneity Data Fusion [J]. Journal of North China Institute of Aerospace Engineering, 2017.
[5] Sun L. Model of end user behavior tag library based on analysis of mobile big data[J]. Modern Science & Technology of Telecommunications, 2016.
[6] Shan H, Zhang Y, Zhuang W, et al. User Behavior-Aware Scheduling Based on Time-Frequency Resource Conversion[J]. IEEE Transactions on Vehicular Technology, 2017, PP(99):1-1.