Acid incubation reverses the polarity of
intercalated cell transporters, an effect
mediated by hensin
George J. Schwartz, … , Ayesa Mian, Qais Al-Awqati
J Clin Invest.
2002;
109(1)
:89-99.
https://doi.org/10.1172/JCI13292
.
Metabolic acidosis causes a reversal of polarity of HCO
3–flux in the cortical collecting duct
(CCD). In CCDs incubated in vitro in acid media,
b
-intercalated (HCO
3–-secreting) cells are
remodeled to functionally resemble
a
-intercalated (H
+-secreting) cells. A similar remodeling
of
b
-intercalated cells, in which the polarity of H
+pumps and Cl
–/HCO
3–exchangers is
reversed, occurs in cell culture and requires the deposition of polymerized hensin in the
ECM. CCDs maintained 3 h at low pH ex vivo display a reversal of HCO
3–flux that is
quantitatively similar to an effect previously observed in acid-treated rabbits in vivo. We
followed intracellular pH in the same
b
-intercalated cells before and after acid incubation
and found that apical Cl/HCO
3exchange was abolished following acid incubation. Some
cells also developed basolateral Cl
–/HCO
3–exchange, indicating a reversal of intercalated
cell polarity. This adaptation required intact microtubules and microfilaments, as well as
new protein synthesis, and was associated with decreased size of the apical surface of
b
-intercalated cells. Addition of anti-hensin antibodies prevented the acid-induced changes in
apical and basolateral Cl
–/HCO
3–exchange observed in the same cells and the
corresponding suppression of HCO
3–secretion. Acid loading also promoted hensin
deposition in the ECM underneath adapting
b
-intercalated cells. Hence, the adaptive
conversion of
b
-intercalated cells to
a
-intercalated cells during acid incubation depends
upon ECM-associated hensin.
Article
Find the latest version:
Introduction
The cortical collecting duct (CCD) of the kidney is comprised of principal cells, involved in salt, water, and potassium transport, and intercalated cells, which make up a third of the cells in this segment and medi-ate acid-base transport (1, 2). Two functionally distinct subtypes of intercalated cells have been identified in the CCD: one secretes HCO3– and the other absorbs it
(3–5). Reabsorption of HCO3–(i.e., secretion of
pro-tons) is accomplished in α-intercalated cells by an api-cal H+-ATPase and a basolateral Cl–/HCO
3–exchanger
(4, 6–8). Secretion of HCO3–by β-intercalated cells is
mediated by the same kinds of transporters but locat-ed on the opposite cell membranes (4, 8–10).
The CCD plays an important role in acid base home-ostasis, especially in the corrective response to an acid or alkali load. In rabbits, CCDs generally secrete HCO3–
(4, 5, 11, 12), but metabolic acidosis causes this seg-ment to absorb HCO3–(4, 5, 11, 13).We initially found
that acid feeding increased the number of αcells and decreased the number of βcells without changing the total number of intercalated cells, and hence we con-cluded that βcells converted to αcells; we termed this
process plasticity of functional epithelial polarity (4). The reversal of polarity of HCO3–flux is of obvious
physiological interest, and understanding the cellular mechanisms by which the functional proteins change their targeting paths raises several questions of great importance to cell biology. Since our original descrip-tion, several molecular tools have become available to characterize intercalated cells. For example, CCDs were shown to contain some cells with apical H+-ATPase and
others with basolateral localization (7, 8). In addition, there was a large fraction of intercalated cells in which the pattern of staining was more intracellular than restricted to polarized membrane domains (7, 9, 14). The situation with the apical and basolateral anion exchangers is much more complex (15), but there is now general agreement for the existence of several sub-types of intercalated cells. The central question of whether an individual βcell can convert to an αcell awaited the development of methods that allow the examination of the same cell in response to acid treat-ment. Here, we provide such evidence.
Recently, we developed a model of metabolic acidosis in vitro by which the CCD reverses the polarity of net
Acid incubation reverses the polarity of intercalated cell
transporters, an effect mediated by hensin
George J. Schwartz,
1Shuichi Tsuruoka,
2Soundarapandian Vijayakumar,
3Snezana Petrovic,
1Ayesa Mian,
1and Qais Al-Awqati
31Department of Pediatrics and Strong Children’s Research Center, University of Rochester School of Medicine,
Rochester, New York, USA
2Department of Clinical Pharmacology, Jichi Medical School, Minamikawachi, Tochigi, Japan 3Department of Medicine and Physiology, College of Physicians and Surgeons of Columbia University,
New York, New York, USA
Address correspondence to: George J. Schwartz, Division of Nephrology, Box 777, University of Rochester School of Medicine, 601 Elmwood Avenue, Rochester, New York 14642, USA.
Phone: (716) 275-9784; Fax: (716) 756-8054; E-mail: George_Schwartz@urmc.rochester.edu.
Received for publication May 17, 2001, and accepted in revised form November 12, 2001.
Metabolic acidosis causes a reversal of polarity of HCO3–flux in the cortical collecting duct (CCD).
In CCDs incubated in vitro in acid media, β-intercalated (HCO3–-secreting) cells are remodeled to
functionally resemble α-intercalated (H+-secreting) cells. A similar remodeling of β-intercalated cells,
in which the polarity of H+pumps and Cl–/HCO
3–exchangers is reversed, occurs in cell culture and
requires the deposition of polymerized hensin in the ECM. CCDs maintained 3 h at low pH ex vivo display a reversal of HCO3–flux that is quantitatively similar to an effect previously observed in
acid-treated rabbits in vivo. We followed intracellular pH in the same β-intercalated cells before and after acid incubation and found that apical Cl/HCO3exchange was abolished following acid incubation.
Some cells also developed basolateral Cl–/HCO
3–exchange, indicating a reversal of intercalated cell
polarity. This adaptation required intact microtubules and microfilaments, as well as new protein synthesis, and was associated with decreased size of the apical surface of β-intercalated cells. Addi-tion of anti-hensin antibodies prevented the acid-induced changes in apical and basolateral Cl–/HCO
3–exchange observed in the same cells and the corresponding suppression of HCO3–
secre-tion. Acid loading also promoted hensin deposition in the ECM underneath adapting β -intercalat-ed cells. Hence, the adaptive conversion of β-intercalated cells to α-intercalated cells during acid incu-bation depends upon ECM-associated hensin.
HCO3–flux after 3 hours of incubation at low pH (5).
These studies revealed that in vitro exposure to acid media induced extensive remodeling of β-intercalated cells, especially apical membrane components; much of this process was mediated by apical endocytosis. In addition, acid incubation resulted in decreased HCO3–
secretion, a process that required de novo protein and RNA synthesis and the integrity of the cytoskeleton (16). More recently, we showed that the CCD adapts to low pH in vitro by downregulating HCO3–secretion in β-intercalated cells and upregulating HCO3–
absorp-tion in α-intercalated cells (3). These studies opened the way for examining the response of the same identi-fied βcells to an acid load in a situation as close to the in situ situation as possible.
To investigate the biochemical and molecular basis for plasticity of epithelia, we generated an immortal-ized cell line of β-intercalated cells that exhibited api-cal Cl–/HCO
3–exchange and basolateral H+-ATPase
activities (17). This phenotype was reproduced when the cells were seeded at subconfluent density and exam-ined when they formed an epithelial monolayer capa-ble of transepithelial HCO3–transport. When they were
plated at high density, they converted to an α-like form with an apical H+-ATPase and a basolateral Cl–/HCO
3–
exchanger. A new protein, termed hensin, was deposit-ed in the ECM of these high-density cells, but not in the matrix of cells plated at low density. When hensin was purified from the ECM, it was capable of converting the low-density cells (i.e., β-like cells) to α-like pheno-type. While soluble hensin is also secreted by low-den-sity cells, only high-denlow-den-sity cells localize it to the ECM (18). Furthermore, only the polymeric ECM form of hensin is capable of inducing this reversal of function-al polarity in the cell line (18). Hensin is expressed in most epithelial cells, but in the kidney it is found only in collecting tubules where it is expressed by both prin-cipal and intercalated cells (19). The remarkable con-version of one phenotype to another in response to seeding density suggested that the pathways thus iden-tified might share a common component with CCDs that adapt to acid treatment.
In this paper we demonstrate that the same identified
β-intercalated cells convert to α-like cells and that this process is associated with deposition of hensin in the ECM of these cells but not in that of other cells. More-over, Ab’s to hensin prevent this conversion of polarity. We conclude that the polarity reversal of intercalated cells in the CCD occurs by a hensin-mediated pathway.
Methods
Animals. Female New Zealand white rabbits weighing 1.5–2.8 kg were maintained on laboratory chow and water (3). Acid treatment in vivo was accomplished by providing 75 mM NH4Cl in 5% sucrose drinking
solu-tion and limiting food intake to 2% of body weight (20). Microperfusion of CCDs. CCDs were microdissected and microperfused as performed in this laboratory (3, 20, 21). Equilibration, transport, and cell pH studies were
performed using Burg’s solution in the perfusate and bath, containing (in mM) 120 NaCl, 25 NaHCO3, 2.5
K2HPO4, 2 CaCl2, 1.2 MgSO4, 5.5 D-glucose, 1 trisodium
citrate, 4 sodium lactate, and 6 L-alanine, 290 ± 2 mOsm/kg H2O and gassed with 94% O2– 6% CO2,
yield-ing a pH 7.4 at 37°C (3, 5, 20). The bath was continual-ly exchanged, except when precious Ab’s were used dur-ing 3-hour incubations; in those cases, osmolality was maintained within ±1% by adding 240 µl water per hour (22) and replacing the bath and Ab’s each hour. Incu-bations for 3 hours in acid (pH 6.8 in both luminal and bathing solutions) and control (pH 7.4) media were described previously (3, 16, 20, 23); incubation at pH 6.8 yields a physiology comparable to 3 days of acidosis in vivo, while that at pH 7.4 sustains net HCO3–secretion.
Anti-hensin Ab’s. Hensin was first purified as a new 230-kDa ECM protein produced by rabbit intercalated cells in vitro (24), and a partial cDNA allowed us to pro-duce in Escherichia colia 32-kDa fusion protein com-posed of SRCR domains 6 and 7, which was used to generate the polyclonal Ab’s. These antisera recognized hensin as a native secreted protein by immunoprecipi-tation, denatured on Western blots, in fixed and per-meabilized cells and kidney sections (19) and in non-fixed cells in culture (25). These Ab’s also prevented all the hensin-mediated functions, such as the develop-ment of apical endocytosis, the induction of specific apical proteins (cytokeratin 19 and villin), the forma-tion of the apical terminal web, and the change in cell shape. Ab’s against other extracellular matrix proteins were obtained from commercial suppliers.
Bicarbonate transport. Triplicate collections of 12–15 nl of tubular fluid were made under water-saturated mineral oil and analyzed for HCO3–(3, 20, 21). When
JHCO3is greater than 0, there is net HCO3–absorption;
when JHCO3is less than 0, there is net HCO3–secretion.
Measurements were repeated after the 3-hour incuba-tion and compared with preincubaincuba-tion values. In ten of the pH 6.8 incubations, guinea pig polyclonal Ab to rabbit hensin (1:100) (19), a comparable dilution of nonimmune guinea pig serum, or a mouse monoclon-al Ab to the ECM protein, collagen IV (Chemicon International, Temecula, California, USA), was added to the bath. In some studies, 5 µg of the fusion protein were preincubated with 10 µl of the serum for 1 hour at 4°C, and the mixture was then added to 1 ml of the pH 6.8 incubation medium.
some-times after the reversible removal of basolateral Cl–. The
sequence of readings was repeated in the same identi-fied intercalated cells after 3 hours of incubation.
Agents were dissolved in 0.1% DMSO and added to the bathing solution 3–15 minutes before and during the 3-hour incubation at pH 6.8. These agents included Ab’s such as guinea pig anti-rabbit hensin polyclonal Ab (1:100 dilution) and nonimmune guinea pig serum (1:100, control for hensin Ab), as well as the reagents colchicine (10 µM), cytochalasin D(1 µM), anisomycin (10 µM), and O,O′-bis (2-aminophenyl) ethyleneglycol-N,N,N′,N′-tetraacetic acid tetraacetoxymethylester (BAPTA-AM) (10 µM; Molecular Probes Inc.).
β-intercalated cell cap length. Each CCD was perfused with FITC-peanut agglutinin (PNA; 20 µg/ml, Vector Laboratories, Burlingame, California, USA) and mon-oclonal Ab B63, 14 µg/ml (against the apical surface of β-intercalated cells) (26), followed by Texas red polyclonal goat anti-mouse secondary Ab (Jackson ImmunoResearch Laboratories, West Grove, Pennsyl-vania, USA). The CCD was then subjected to the 3-hour incubation, fixed in 3% paraformaldehyde, and mounted on a slide in Gel/Mount (Biomedia Corp., Foster City, California, USA). Tubules were examined for fluorescein and rhodamine fluorescence in a Nikon epifluorescence microscope, photographed at high dry power (×100 real magnification), projected, and manually traced. Cells expressing PNA and B63
on the apical surface, appearing as caps, parallel to the long axis of the tubule (3–20 per CCD) were measured using calibrated calipers and averaged per CCD. Mean data from three to nine tubules were obtained for each experimental maneuver.
Confocal fluorescence microscopy of hensin-labeled CCDs. Microdissected CCDs were labeled extracellularly with anti-hensin Ab at 1:100 dilution in PBS/1% BSA by exposure at 4°C for 4–5 hours, followed by fixation in Prefer (Anatech Ltd., Battle Creek, Michigan, USA), per-meabilization, and overnight exposure to counterlabel, either rhodamine-PNA (20 µg/ml) or IVF12 mAb to band 3 (1:100), provided by M. Jennings (27). Next, the CCD was exposed to FITC-goat anti-guinea pig IgG (1:75) and, if band 3 was used, rhodamine donkey anti-mouse IgG (1:50). Each tubule was transferred to a slide in Gel/Mount, coverslipped, sealed, and examined using an Axiovert 100 laser-scanning confocal micro-scope (model LSM 410; Carl Zeiss Inc., Thornwood, New York, USA) (25, 28). Images were collected using a
×40 objective (×100 real magnification), and 1-µm opti-cal sections were obtained and analyzed by the Zeiss LSM-PC software. The final images were processed with Adobe Photoshop software (Adobe Systems Inc., San Jose, California, USA).
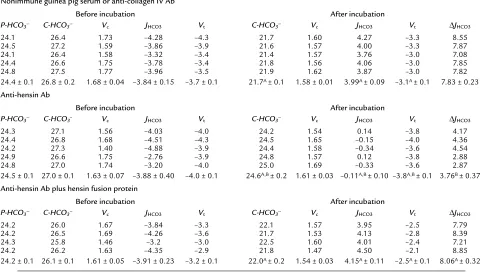
[image:4.576.57.554.86.358.2]Analysis and statistics. Data are presented as means plus or minus SE. Standard paired and unpaired compar-isons were performed using statistical software (NCSS Table 1
HCO3–transport before and after 3-hour incubation at pH 6.8
Nonimmune guinea pig serum or anti-collagen IV Ab
Before incubation After incubation
P-HCO3– C-HCO3– Vc JHCO3 Vt C-HCO3– Vc JHCO3 Vt ∆JHCO3
24.1 26.4 1.73 –4.28 –4.3 21.7 1.60 4.27 –3.3 8.55 24.5 27.2 1.59 –3.86 –3.9 21.6 1.57 4.00 –3.3 7.87 24.1 26.4 1.58 –3.32 –3.4 21.4 1.57 3.76 –3.0 7.08 24.4 26.6 1.75 –3.78 –3.4 21.8 1.56 4.06 –3.0 7.85 24.8 27.5 1.77 –3.96 –3.5 21.9 1.62 3.87 –3.0 7.82 24.4 ± 0.1 26.8 ± 0.2 1.68 ± 0.04 –3.84 ± 0.15 –3.7 ± 0.1 21.7A ± 0.1 1.58 ± 0.01 3.99A ± 0.09 –3.1A ± 0.1 7.83 ± 0.23
Anti-hensin Ab
Before incubation After incubation
P-HCO3– C-HCO3– Vc JHCO3 Vt C-HCO3– Vc JHCO3 Vt ∆JHCO3
24.3 27.1 1.56 –4.03 –4.0 24.2 1.54 0.14 –3.8 4.17 24.4 26.8 1.68 –4.51 –4.3 24.5 1.65 –0.15 –4.0 4.36 24.2 27.3 1.40 –4.88 –3.9 24.4 1.58 –0.34 –3.6 4.54 24.9 26.6 1.75 –2.76 –3.9 24.8 1.57 0.12 –3.8 2.88 24.8 27.0 1.74 –3.20 –4.0 25.0 1.69 –0.33 –3.6 2.87 24.5 ± 0.1 27.0 ± 0.1 1.63 ± 0.07 –3.88 ± 0.40 –4.0 ± 0.1 24.6A,B ± 0.2 1.61 ± 0.03 –0.11A,B ± 0.10 –3.8A,B ± 0.1 3.76B ± 0.37
Anti-hensin Ab plus hensin fusion protein
Before incubation After incubation
P-HCO3– C-HCO3– Vc JHCO3 Vt C-HCO3– Vc JHCO3 Vt ∆JHCO3
24.2 26.0 1.67 –3.84 –3.3 22.1 1.57 3.95 –2.5 7.79 24.2 26.5 1.69 –4.26 –3.6 21.7 1.53 4.13 –2.8 8.39 24.3 25.8 1.46 –3.2 –3.0 22.5 1.60 4.01 –2.4 7.21 24.2 26.2 1.63 –4.35 –2.9 21.8 1.47 4.50 –2.1 8.85 24.2 ± 0.1 26.1 ± 0.1 1.61 ± 0.05 –3.91 ± 0.23 –3.2 ± 0.1 22.0A ± 0.2 1.54 ± 0.03 4.15A ± 0.11 –2.5A ± 0.1 8.06A ± 0.32 ASignificantly different from before incubation (paired ttest); Bsignificantly different from non-immune serum (unpaired t test). P-HCO
3–, perfusate [HCO3–]
in mEq/l; C-HCO3–, collected fluid [HCO3–] in mEq/l; Vc, collection rate in nanoliters per minute; JHCO3, net HCO3–flux in picomoles per minute per
Statistical Software, Kaysville, Utah, USA; Excel, Microsoft Corp., Bellevue, Washington, USA). Signifi-cance was asserted when P values were less than 0.05.
Results
Lowering bath pH converts HCO3–secretion to HCO3–
absorp-tion. When CCDs from normal rabbits are perfused and bathed in vitro in solutions simulating an ultrafiltrate of rabbit plasma at pH 7.4, they generally secrete HCO3–
(3, 4). Similar results were observed in five CCDs that secreted HCO3–(–3.84 ± 0.15 pmol/min/mm) and had
a transepithelial voltage of –3.7 ± 0.1 mV (baseline, i.e., before incubation; Table 1 and Figure 1, control serum,
basal, white bars). When Cl–was removed from the
lumen, HCO3–secretion was completely reversed, and
net HCO3–absorption of 3.34 ± 0.11 pmol/min/mm
was observed (Figure 1, Cl-free lumen, white bar). The overall Cl–-dependent HCO
3–secretion was –7.03 ± 0.26
pmol/min/mm (Figure 1, HCO3Flux, white bar),
sim-ilar to what has been observed previously (3).
After 3 hours of in vitro incubation in pH 6.8 media, these same tubules changed their HCO3– transport
rates to absorption at a rate of 3.99 ± 0.09 pmol/min/mm, even when the CCD’s were examined at pH 7.4 (Figure 1, basal, black bar). With H+secretion,
the voltage became less negative at –3.1 ± 0.1 mV. These results were not affected by inclusion in the bath of anti-collagen IV Ab’s or nonimmune guinea pig serum (1:100 dilution) during the 3-hour incubation at pH 6.8 (Table 1). Thus, all of these data were pooled. When luminal Cl– was removed after the acid incubation,
there was a small increase in HCO3–absorptive flux to
5.45 ± 0.20 pmol/min/mm (Figure 1, Cl–free lumen, black bar) with a rate of Cl–-dependent HCO
3–secretion
that was reduced to 1.56 ± 0.20 pmol/min/mm (Figure 1, HCO3Flux, black bar). In sum, in vitro exposure to a
bath of pH 6.8 caused the CCD to reverse the polarity of HCO3–flux from net secretion to net absorption; the
acid-induced change in net HCO3–flux was 7.83 ± 0.23
pmol/min/mm. This adaptation was specific to the lowering of bath pH rather than to the 3-hour incuba-tion, since we showed previously that exposure of CCDs to 3-hour incubation at pH 7.4 (control incuba-tion) resulted in no net change in HCO3– flux or
transepithelial voltage (3).
Conversion of HCO3–secretion to HCO3–absorption is
hensin-dependent. It had been shown in an immortalized intercalated cell line that hensin converts the low-den-sity, i.e., β-like phenotype, to the high-density or α-like form, and anti-hensin Ab’s prevented this conversion (19). When CCDs were exposed to these Ab’s in the bath during the 3-hour acid incubation, they prevent-ed much of the adaptation (Figure 1, hensin anti-serum, basal, black bar). Before incubation, HCO3–was
secreted (–3.88 ± 0.40 pmol/min/mm), while after acid incubation plus anti-hensin Ab, the flux was not sig-nificantly different from zero. The overall change in net HCO3–flux with acid incubation was reduced by
52% to 3.76 ± 0.37 pmol/min/mm, significantly less than that observed after low pH incubation in the presence of irrelevant Ab’s. The acid-induced decrease in electronegativity of transepithelial voltage was sig-nificantly attenuated to only 0.2 mV. These data indi-cate that the anti-hensin Ab’s prevented the adapta-tion. Preincubation of the Ab’s with the immunizing fusion protein completely prevented the effect of the Ab’s (Figure 1, lower panel).
To examine which unidirectional flux of HCO3–was
affected by hensin, we removed luminal Cl–. The change
in flux due to Cl–removal (i.e., the HCO
3–secretory flux)
[image:5.576.69.283.53.309.2]was reduced in response to acid incubation. When the tubules were incubated in irrelevant Ab’s, the HCO3–
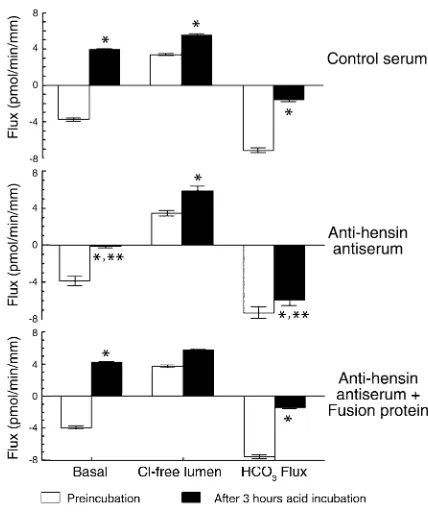
Figure 1
Acid incubation converts HCO3–secretion to HCO3–absorption, a
process that is hensin-dependent. Upper panel: five CCDs (control serum, basal, white bars) secrete HCO3–. When Cl–was removed
(Cl-free lumen), HCO3–absorption resulted; the difference is the rate of
Cl–-dependent HCO
3–secretion (HCO3flux). After 3-hour
incuba-tion at pH 6.8 (black bars), net HCO3–absorption was observed
(basal). Removal of luminal Cl–caused a small increase in HCO 3–
absorption (Cl–-free lumen), and the Cl–dependent HCO
3–secretion
(HCO3flux) was substantially less than before acid incubation.
Mid-dle panel: five CCDs (anti-hensin antiserum) were incubated simi-larly, except anti-hensin Ab was included in the bath. Anti-hensin antiserum (black bars) blocked half of the acid-induced change in HCO3–transport (basal) but did not change the flux after removal of
luminal Cl–(Cl-free lumen), so that the Cl–-dependent rate of HCO 3–
secretion (HCO3flux) was only slightly smaller than preincubation
values. Lower panel: four CCDs (anti-hensin antiserum + fusion pro-tein) were incubated similarly, except that hensin Ab had been prein-cubated with the fusion protein that had been used as the immuno-gen. After acid incubation (black bars), the pattern of net HCO3–
transport (basal), HCO3–absorption (Cl-free lumen), and HCO3–
secretory flux was –7.20 ± 0.59 pmol/min/mm before acid incubation and –1.56 ± 0.20 pmol/min/mm after incubation (Figure 1, control serum, HCO3flux). In
contrast, the tubules that were exposed to anti-hensin antiserum plus low pH showed only a small change in their HCO3–secretory flux (–7.20 ± 0.59 pmol/min/mm
before acid incubation and –5.90 ± 0.54 pmol/min/mm after; see Figure 1, anti-hensin antiserum, HCO3flux,
black bar). After acid incubation in the presence of hensin Ab’s, the HCO3–secretory flux was significantly
larger than if exposed to irrelevant Ab’s (see Figure 1, control serum, HCO3flux, black bar). These studies
suggest that the adaptive decrease in HCO3–secretion
to in vitro acid treatment is mediated by hensin. The flux remaining after removal of luminal Cl–represents
HCO3absorption, i.e., H+secretion. This flux was
stim-ulated by in vitro acid incubation from 3.3 to 5.5 pmol/min/mm. Interestingly, hensin Ab’s did not block this acid-induced stimulation.
Identification of individual intercalated cells. We had used the pH sensitive dye, BCECF, to identify subtypes of intercalated cells, finding
that removal of luminal Cl–
led to alkalinization of β-type intercalated cells (4, 5, 10, 29) since HCO3– secretion was
inhibited, whereas α-type intercalated cells did not respond because they lacked apical anion exchangers or channels (30). Removal of bath Cl–resulted in
alkalin-ization of α-intercalated cells, because basolateral base exit via the Cl–/HCO
3–exchanger
is inhibited (4, 6, 15).
Basolat-eral Cl–removal, however, acidifies β-intercalated cells,
because HCO3–exit from the cell into the lumen via the
apical Cl–/HCO
3– exchanger is accelerated in the
absence of bath (and therefore cellular) Cl–(5, 10). We
used this approach to identify individual intercalated cells before and after acid incubation. The upper panel of Figure 2a shows the response of typical intercalated cells; the βform (upper tracing) reversibly alkalinizes 0.4 pH units upon removal of luminal Cl–and acidifies
0.4 pH units upon removal of bath Cl–. The α
-interca-lated cell (Figure 2a, lower tracing) does not change cell pH with luminal Cl–removal and reversibly alkalinizes
0.3 units after removal of bath Cl–. In the mid-CCD, the
vast majority of intercalated cells were βtype; a few resembled α-intercalated cells, similar to what has been found previously (6, 10). These two functional pheno-types were the only ones observed in BCECF-positive cells in the mid-CCD.
To secrete HCO3in a transepithelial manner, a β cell
has to have a Cl–/HCO
3–exchanger on the apical
[image:6.576.61.285.53.299.2]mem-brane and a H+-ATPase on the basolateral membrane.
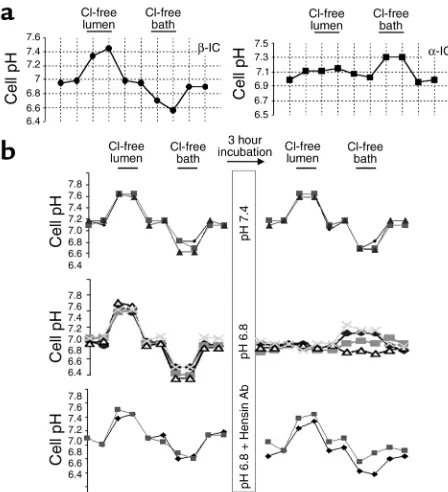
Figure 2
Identification of individual intercalated cells and their response to 3-hour incubation. (a) Perfusion of CCDs with BCECF-AM results in selective concentration of fluorescence in intercalated cells. Left trac-ing shows a β-intercalated cell, which alkalinizes with removal of luminal Cl–and acidifies upon removal of bath Cl–. Right tracing
shows an α-intercalated cell, which is unresponsive to the removal of luminal Cl–, but alkalinizes upon the removal of bath Cl–. (b)
Repre-sentative tracings of pH changes in β-intercalated cells presented to illustrate the variety of responses to Cl–removal under different
incu-bation conditions. Top panel: Incuincu-bation at pH 7.4 has no effect on the response of β-intercalated cells to removal of Cl–. Middle panel:
Incubation at pH 6.8 causes a loss of apical Cl–/HCO
3–exchange
activity and prevents acidification with the removal of bath Cl–.
Moreover, two of four β-intercalated cells (diamonds and x’s) now alkalinize after basolateral Cl–removal. The responses of all cells are
depicted in Figure 4. Lower panel: Anti-hensin Ab added with the pH 6.8 incubation prevented the loss of apical Cl–/HCO
3–exchange and
permits acidification with bath Cl–removal.
Table 2
β-Intercalated cell pH values
Before incubation After incubation
Incubation n First pH Last pH First pH Last pH
pH 7.4 15 7.13 ± 0.03 7.14 ± 0.05 6.94 ± 0.06A 6.95 ± 0.06
pH 6.8 75 7.15 ± 0.02 7.03 ± 0.03A 7.07 ± 0.01 7.12 ± 0.03A
pH 6.8 + Hens Ab 21 7.17 ± 0.03 7.12 ± 0.03 6.92 ± 0.03A 6.95 ± 0.04
pH 6.8 + Colch 20 7.06 ± 0.03 7.08 ± 0.04 7.10 ± 0.04 7.10 ± 0.03 pH 6.8 + Cyt D 9 7.15 ± 0.03 7.06 ± 0.04 7.02 ± 0.03 7.06 ± 0.03 pH 6.8 + Aniso 16 7.06 ± 0.02 7.02 ± 0.02 7.04 ± 0.02 7.02 ± 0.02 pH 6.8 + BAPTA 7 7.09 ± 0.02 7.02 ± 0.01A 7.05 ± 0.06 6.98 ± 0.09 β-Intercalated cell pH values obtained in the presence of Burg’s solution (pH 7.4) in both luminal and bathing solu-tions before and after a 3-hour incubation. ASignificantly different from preceding value. n, number of cells; Hens
In this study, those intercalated cells that had apical Cl–/HCO
3–exchange were classified as βcells. At this
time there is no procedure to measure H+pumping in
individual cells repeatedly without drastic changes in cell pH, an action that itself might change the distri-bution of transporters. Others (9, 14) using immuno-cytochemistry found that the H+-ATPase of many βcells is located in intracellular vesicles but not on the basolateral membrane. It is therefore likely that some
β cells with apical Cl–/HCO
3–exchange actually secrete
HCO3–while others do not. Our use of apical or
baso-lateral Cl–/HCO
3–exchange as a marker for βor αcells
overestimates the number of cells that participate in transepithelial transport.
An acid bath in vitro induces loss of apical Cl–/HCO 3–
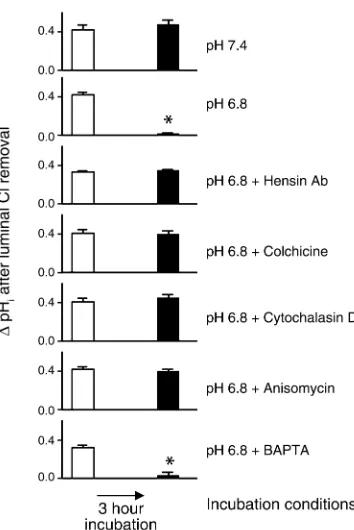
exchange by a hensin-mediated mechanism. We first showed that the phenotype of β-intercalated cells did not change after a 3-hour incubation at pH 7.4 (Figure 2b, upper tracing). In 15 cells from five CCDs, the mean reversible increase in cell pH upon removal of luminal Cl–was 0.43 ± 0.04 units before and 0.47 ± 0.05 units
after incubation at pH 7.4 (Figure 3, pH 7.4). While there was a small decrease in the steady state cell pH after this incubation, this was not observed after most other maneuvers (Table 2). These studies confirm that a 3-hour incubation does not alter this fundamental
property of β-intercalated cell function (3). In contrast, incubation for 3 hours at pH 6.8 caused a complete loss of sensitivity to luminal Cl–removal (Figure 2b, middle
tracing; Figure 3, pH 6.8). In 75 cells from 21 CCDs, the mean reversible increase in cell pH upon the removal of luminal Cl–was 0.42 ± 0.01 units before and 0.02 ± 0.01
units after incubation at pH 6.8 (P < 0.001). Note that the same cells were examined before and after Cl–
removal and acid incubation, thereby establishing the fact that an individual identified intercalated cell responded to a change in ambient pH with loss of luminal Cl–/HCO
3–exchangers. The consequence, seen
in Figure 1, was a downregulation of HCO3–secretion
and Cl–-dependent change in HCO 3–flux.
When hensin Ab was added to the bath during the pH 6.8 incubation, this adaptive loss of Cl–/HCO
3–exchange
was prevented (Figure 2b, lowest tracing). Indeed, in 21 cells from seven CCDs, the mean reversible increase in cell pH upon the removal of luminal Cl–was 0.33 ± 0.02
units before and 0.35 ± 0.02 units after incubation at pH 6.8 (Figure 3, pH 6.8 + hensin Ab). Although hensin Ab’s completely prevented the loss of apical Cl–/HCO
3–
exchange, they only partially restored the HCO3–
secre-tory flux (Figure 1). We conclude that some cells that had apical Cl–/HCO
3–exchange must not have
basolat-eral H+-ATPase activity and therefore were not
partici-pating in the transepithelial flux activity.
Metabolic acidosis in vitro induces a reversal in polarity of Cl–/HCO
3–exchange activity. To examine whether the adapted β-intercalated cells changed their phenotype to that of the αtype, we measured their response to basolateral Cl–removal, a maneuver that results in
acid-ification of β-cell pH (see Figure 2). Control studies demonstrated that a 3-hour incubation at pH 7.4 had no effect on this Cl–-dependent acidification of cell pH
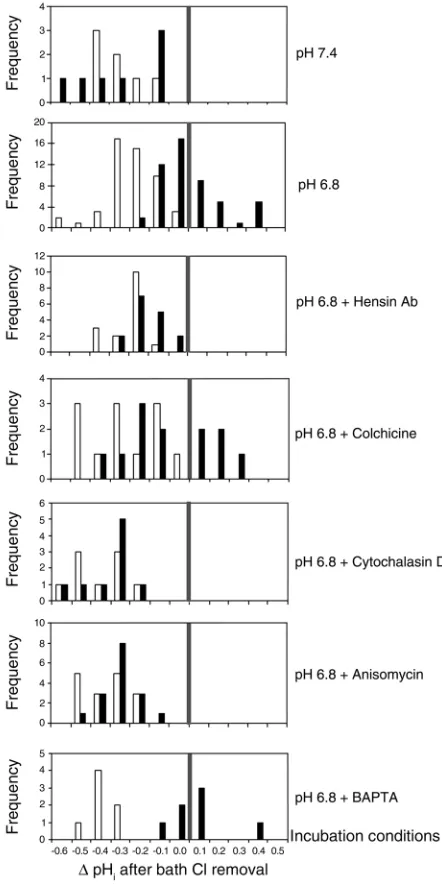
(0.34 ± 0.04 units before and 0.34 ± 0.07 units after incubation; Figure 2b, top tracing). When seven cells from five CCDs were studied and the responses pre-sented in histogram form (Figure 4, pH 7.4) the distri-bution before incubation (white bars) did not differ from that after incubation (black bars).
However, the response of cell pH to bath Cl–removal
after incubation at pH 6.8 (Figure 2b, middle panel) was quite different: some cells showed no change in cell pH, while others showed a substantial alkalinization. Overall, in 51 cells from 16 CCDs, the mean change in cell pH with bath Cl–removal before incubation was
–0.29 ± 0.02 units compared with 0.01 ± 0.02 units after incubation (P < 0.001). The histogram of all responses (Figure 4, pH 6.8) shows that 39% of previously identi-fied β-intercalated cells had now alkalinized in response to bath Cl–removal (black bars); tracings of
four adapting β-intercalated cells, two of which clearly show alkalinization with removal of bath Cl–after acid
incubation, are depicted in Figure 2b (middle panel). These data indicate that a substantial proportion of individually identified β-intercalated cells have lost api-cal and gained basolateral Cl–/HCO
3–exchange
[image:7.576.88.265.49.314.2]activi-ty, two of the key properties of α-intercalated cells (see Figure 3
Loss of apical Cl–/HCO
3–exchange activity in response to acid
incu-bation is an adaptation that is prevented not only by hensin Ab, but also by cytoskeletal and protein synthesis inhibitors; this adaptation does not depend on changes in cell calcium. Mean (± SE) reversible change in cell pH upon removal of luminal Cl–in β-intercalated cells
Figure 2a), confirming unequivocally our original idea of the plasticity of epithelial polarity.
Acid incubation also stimulates basolateral Cl–/HCO 3–
exchange activity in α-intercalated cells. While the vast majority of intercalated cells in the mid-CCD respond-ed as β-intercalated cells, severalα-intercalated cells (4% of total intercalated cells) were also identified. In six
αcells examined in four CCDs, the mean alkalinization resulting from removing bath Cl–was 0.34 ± 0.02 pH
units before acid incubation and 0.47 ± 0.03 pH units after acid incubation, a 36% increase (P < 0.05). These data are consistent with increased expression of apical H+-ATPase and basolateral band 3 in α cells after
chronic metabolic acidosis in vivo (7, 31).
Hensin Ab prevents the adaptive gain of basolateral Cl–/HCO
3–exchange activity. When Ab to hensin was added to the bath during the 3-hour incubation at pH 6.8, there was no apparent adaptation at the basolater-al side of the β-intercalated cells. In 16 cells from six CCDs, the mean reversible acidification in response to removal of bath Cl–was 0.28 ± 0.02 units before and
0.22 ± 0.02 units after the 3-hour incubation at pH 6.8 plus hensin Ab (Figure 2b, lower tracing). The his-togram of all responses (Figure 4, pH 6.8 + hensin Ab) confirmed that there were no significant changes in the distribution of responses to bath Cl–removal.
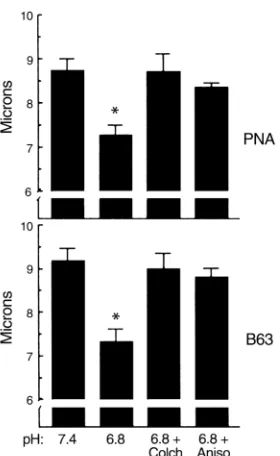
The apical surface of β-intercalated cells diminishes in response to acidosis in vitro. Assuming that a reduction of apical Cl–/HCO
3–exchange activity would be
accom-plished by endocytosis of part of the apical membrane, we examined changes in two different apical markers of
β-intercalated cells, PNA (5, 9, 10) and binding of the mAb B63 (26). In five CCDs, a 3-hour control incuba-tion at pH 7.4 resulted in a mean apical PNA cap length of 8.7 ± 0.3 µm and a mean B63 cap length of 9.2 ± 0.3
µm (Figure 5, pH 7.4). In six CCDs, incubation for 3 hours at pH 6.8 resulted in significant reductions in cap length to 7.3 ± 0.2 µm for PNA (P < 0.05) and 7.3 ± 0.3
µm for B63 (P < 0.05) (Figure 5, pH 6.8). Previous stud-ies suggested that this reduction in cap length is a con-sequence of endocytosis of these apical markers. Stud-ies in vivo (4, 5) and in the intercalated cell line in vitro (18, 24) had demonstrated that induction of apical endocytosis is one of the first phenomena to occur dur-ing conversion of β- to α-intercalated cell phenotypes. These findings suggest that endocytic removal of apical Cl–/HCO
3–exchangers results in reduction of apical
membrane area of β-intercalated cells.
Plasticity of intercalated cells is associated with deposition of hensin in the ECM. Hensin is a 250-kDa protein that is expressed in all cells of ureteric bud lineage, i.e., both principal and intercalated cells (19). In most of these cells it is present in intracellular vesicles. Previous studies in the intercalated cell line demonstrated that for hensin to activate its receptor, it must be deposit-ed in the extracellular matrix as an insoluble fiber composed of a homomultimer whose structure is sta-bilized by binding to galectin-3 (28). Only this form of hensin is active, and monomeric hensin, the form
[image:8.576.312.533.204.646.2]pres-ent in intracellular vesicles, does not induce the rever-sal of polarity. That Ab’s to hensin inhibited the response of isolated perfused CCDs also suggest that it is the ECM form of hensin that is responsible for conversion of β- to α-intercalated cells demonstrated above, since the Ab’s are large molecules and do not have access to any intracellular structures. To demon-strate whether hensin was present in the ECM of the CCDs, it was necessary to develop methods that would assay for its presence only in the ECM and not intra-cellularly, since all cells of these segments express
Figure 4
Acid incubation induces a reversal of polarity of Cl–/HCO
3–
exchang-ers, a process that is hensin-dependent and mediated by intact microfilaments and protein synthesis; this adaptation is independ-ent of changes in cell calcium. Histogram of changes in cell pH (pHi)
induced by removal of bath Cl–before 3-hour incubation (white bars)
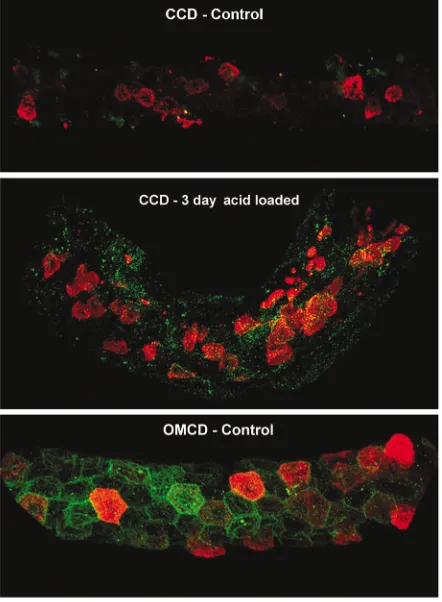
hensin. To prevent cellular permeabilization required exposure of microdissected CCDs to hensin Ab’s at 4°C for 4–5 hours, followed by washing, fixation, and then detergent permeabilization, in order to assay for the presence of PNA (the marker of βcells) and band 3 (the marker for α cells). Confocal microscopy showed that β-intercalated cells expressed thick, well-formed caps on the apical membrane that contained the PNA-binding protein (Figure 6, cell 2). These cells had no basal or lateral hensin in the ECM in the unpermeabilized state. In CCDs taken from 3-day acid-treated rabbits, the PNA caps of β-cells had lost the thick and well-defined structure, converting to a variety of patterns varying from thin and short images to a few punctate structures, which might represent PNA that was internalized by apical endocytosis (Fig-ure 6, compare cells 1 and 3). The hensin staining was localized to the basal and lateral surface of only a few of the cells in the acid-treated CCD (cell 1 or 3, for instance), likely to be the adapting β-intercalated cells. However, most of the cells in both control and acid-treated CCD (presumably principal cells) had no such staining (Figure 6). Alpha cells in CCDs from acidotic rabbits were abundant, as previously noted (4, 5), and also had extracellular hensin; this was best seen in the outer medullary collecting duct (OMCD), a segment with abundant αcells (Figure 7).
Role of cell calcium in the adaptive change in polarity of Cl–/HCO
3–exchange. We had shown previously that acute intracellular acidification by CO2of α-intercalated cells
leads to an increase in cell calcium with consequent increase in H+transport, an effect that was prevented by
BAPTA-AM, a permeable intracellular calcium chelator (32). To examine whether the more long-term adapta-tion to an acid environment also involves elevaadapta-tion of cell calcium, we incubated CCDs for 3 hours at pH 6.8 in the presence of BAPTA to blunt any increase in cell calcium. This treatment failed to prevent the adaptive loss of apical Cl–/HCO
3–exchange activity (Figure 3)
and the gain of basolateral Cl–/HCO
3–exchange
activi-ty in response to acid incubation. The histogram of all basolateral responses (Figure 4, pH 6.8 + BAPTA) indi-cated that 57% of previously identified β-intercalated cells had now alkalinized in response to the removal of bath Cl–(black bars).
Plasticity in epithelial polarity requires protein synthesis. The conversion of β- to α-intercalated cells requires a complex remodeling of the cell as well as induction of apical endocytosis. To examine whether new proteins are needed for this induction we incubated CCDs for 3 hours at pH 6.8 in the presence of anisomycin, a reversible inhibitor of protein synthesis. This reagent prevented the adaptive decrease in apical Cl–/HCO
3–
exchange activity (Figure 3) and any significant changes in the distribution of responses to the removal of bath Cl–(Figure 4, pH 6.8 + Anisomycin). Finally, the
remodeling of the apical membrane as assayed by the cap length method was also prevented by anisomycin in three CCDs. The mean PNA and B63 cap lengths were not significantly affected by acid incubation plus anisomycin (Figure 5). These results demonstrate that all the examined characteristics of plasticity appear to require new protein synthesis.
Plasticity in epithelial polarity requires an intact cytoskeletal network. Induction of apical endocytosis and the trans-port of an anion exchanger to the basolateral membrane clearly require an intact cytoskeleton. In addition, it had been demonstrated that β-intercalated cells are shorter and flatter than the α-phenotype (25), and effecting changes in cell shape depends on an intact cytoskeleton. We found that cytochalasin and colchicine, disrupters of actin and microtubules, respectively, both prevented the adaptive loss in apical Cl–/HCO
3–exchange activity
in response to acid incubation (Figure 3). Colchicine, however, did not inhibit some intercalated cells from acquiring basolateral Cl–/HCO
3–exchange, as shown in
the histogram in Figure 4. A third of previously identi-fied β-intercalated cells had now alkalinized in response to the removal of bath Cl–(black bars). On the other
hand, cytochalasin prevented the acquisition of baso-lateral Cl–/HCO
3–exchange activity in response to acid
incubation (Figure 4).
[image:9.576.110.250.51.279.2]Colchicine prevented the adaptive decrease in apical cap length, much as it prevented the decrease in api-cal activity. In three CCDs, incubation for 3 hours at pH 6.8 plus colchicine resulted in a mean PNA cap length of 8.7 ± 0.4 µm and a mean B63 cap length of 9.0 ± 0.3 µm, not significantly different from a con-trol incubation (Figure 5, 6.8 + Colch). Thus, this Figure 5
endocytic process of apical membrane removal from the β-intercalated cell after acid incubation requires intact microtubules. This process is consistent with a remodeling of β-intercalated cells that are adapting to metabolic acidosis in vitro.
Discussion
Several years ago (4), we showed that the cortical col-lecting tubule has two distinct functional subtypes of intercalated cells: the H+-secreting or αtype has an
api-cal H+-ATPase and basolateral Cl–/HCO
3–exchanger
and exhibits vigorous apical endocytosis. The HCO3–
-secreting or βtype has an apical Cl–/HCO
3–exchanger
and a basolateral H+-ATPase and binds peanut lectin
on the apical membrane but has no apical endocyto-sis. In vivo acid loading resulted in a decrease in the number of β-intercalated cells and an increase in the number of α-cells in CCDs from these animals, and the perfused CCDs absorbed HCO3–after acid loading,
compared with secreting HCO3–in normal animals.
From these data, we proposed that acid loading in vivo caused a reversal of functional epithelial polarity. Although we found no evidence for increased mitotic activity, we were unable, then, to monitor the same cell during this adaptation, hence the question of whether the same cell converted its polarity remained unan-swered. Although we initially thought that the adap-tation required a long period of acid loading, recent
studies showed that incubating CCDs for only 3 hours at pH 6.8 in vitro caused this reversal of polarity of HCO3–flux from net secretion to net absorption (3, 5,
16). This procedure, as well as improvements in opti-cal methods, now allowed us to study individual cells before and after in vitro acid incubation. We found that HCO3–-secreting β-intercalated cells removed
Cl–/HCO
3–exchangers from the apical membrane and
began to insert Cl–/HCO
3–exchangers on the
basolat-eral membrane. This complex process required protein synthesis, an intact cytoskeletal network of actin and tubulin, as well as degradation and internalization of the apically located peanut lectin–binding protein. Hence, we believe that we have provided unequivocal evidence that acid treatment can convert one interca-lated cell type to another.
Role of hensin in the acid-induced plasticity of polarity. To examine the molecular basis of this transformation we generated a conditionally immortalized clonal interca-lated cell line whose phenotype resembled those of the
β-intercalated cells in situ. When these cells were seed-ed at low density and allowseed-ed to form a confluent epithelium, they showed apical Cl–/HCO
3–exchange
[image:10.576.60.292.57.320.2]and basolateral H+-ATPase, a phenotype consistent with βcells. Seeded at superconfluent density, they changed their phenotype to that of αcells, expressing all of their Figure 6
Confocal immunofluorescent imaging of isolated CCDs stained for extracellular hensin (green) and peanut agglutinin (PNA, red); real magnification was ×100. Upper two panels show a CCD from con-trol and 3-day acid-treated rabbit kidneys; there are three identified intercalated cells from the latter CCD. Lower three panels show suc-cessive 1-µm optical cuts for each of these cells.
Figure 7
[image:10.576.312.533.378.679.2]characteristics, including vigorous apical endocytosis (24). While the relation of seeding density to acid treat-ment is obscure, we felt that the end result was suffi-ciently similar to that in situ that the two pathways were likely to intersect at some point. We identified a protein that mediates this change of phenotype and named it hensin (for change in body in Japanese). Low-density cells, resembling βcells, secreted monomeric hensin to the basolateral medium, whereas the α-like high-densi-ty cells secreted multimers of hensin, which become deposited in the ECM (18). When purified, this ECM form of hensin was able to induce conversion of polari-ty of the low-densipolari-ty cells. In high-densipolari-ty cells, monomeric hensin is first converted to dimers or tetramers by a folding enzyme located in the ECM, then it is “bundled” into fibers by galectin-3 (28). That Win-yard et al. (33) had demonstrated that galectin-3 was only expressed in the α-intercalated cells suggested that our hope of intersection of the density-mediated and acid-induced pathways was reasonable.
Hensin is a protein that is composed of three types of domains, eight SRCR domains, two CUB domains, and one ZP domain (34). Ab’s against SRCR domains 6 and 7 prevented the development of the high-density phe-notype and inhibited apical endocytosis 50–70% (18, 19). Similarly, these Ab’s significantly reduced the adaptive inhibition of HCO3– secretory flux by an
equivalent fraction, but completely prevented the appearance of basolateral Cl–/HCO
3–exchange and the
disappearance of apical anion exchange. A likely cause of the partial effect on transepithelial HCO3–flux is
that part of the adaptation includes stimulation of HCO3–absorption by the α-intercalated cells in the
CCD, and it is possible that the added Ab’s did not inhibit this effect. Tubules incubated in nonimmune sera or with Ab’s against another ECM protein (colla-gen IV) displayed the full effect of the acid incubation on these HCO3–-transport processes. In the present
studies we also demonstrated that in vivo acid treat-ment caused the localization of hensin in the ECM of the CCDs on the basal and lateral surface of intercalat-ed cells. Because hensin is expressintercalat-ed in all CCD cells where it exists in intracellular vesicles (19), we per-formed these studies in unpermeabilized tubules incu-bated with anti-hensin Ab’s at 4°C to prevent endocy-tosis of the Ab’s. Remarkably, the cells with a thick and prominent peanut lectin cap (i.e., unequivocal βcells) had no extracellular hensin, and the cells that had newly deposited extracellular hensin had little or no apical peanut lectin. We were able, however to see a few cells that were transitional, in that they had punctate peanut lectin staining and extracellular hensin. These results in the aggregate demonstrate that the localiza-tion of hensin to the ECM is a central mediator of intercalated cell plasticity. Clearly, determination of events “upstream” of hensin, whereby acid media induce ECM localization of hensin, is an important future aim of our studies. The results presented here highlight the utility of the cell culture model in
identi-fication of new genes and proteins involved in mediat-ing complex physiological phenomena such as the plas-ticity of polarity of the intercalated cells.
Apical Cl–/HCO
3–exchange. The molecular identity of the apical anion exchanger has been the subject of extensive investigation. Immunocytochemistry using a large number of anti-AE1 Ab’s has been negative. Recent studies have identified two new candidates for apical anion exchange, AE4, a new member of the Na-HCO3cotransporter family (35), and pendrin (36, 37).
AE4 is present in a subpopulation of PNA-positive cells of the rabbit kidney cortex. Pendrin, located in the api-cal membrane of mouse, rat, and human interapi-calated cells, was clearly found to mediate HCO3–secretion,
since tubules isolated from mice deleted in pendrin failed to secrete HCO3–.
Intercalated cells exist in a continuum of subtype. Initially, we based our analysis of subtypes of intercalated cells on the presence of PNA, the polarized location of Cl–/HCO
3–exchange, and the presence of apical
endo-cytosis (4, 6). While this provided a simplified distri-bution of two canonical subtypes, others (9, 15, 29, 38) have shown using a variety of methods that there are more than two subtypes of intercalated cells. In a com-prehensive analysis of the pattern of expression of H+
-ATPase, Bastani et al. (7) concluded that there were six subtypes of intercalated cells and that acidosis shifted the population density toward the αtype, while alka-losis shifted it toward the βtype. Just as importantly, “intermediary types” were also observed under control conditions, implying intercalated cells with potential to change to αor βtype. However, population studies cannot determine whether an individual cell can change its phenotype. We showed previously (5) that acid incubation of CCDs induced β-intercalated cells to endocytose PNA from the apical membrane and sequester it in apical vesicles. Here we show that the same identified β-intercalated cells before and after a 3-hour incubation in acid media reduce the size of PNA caps and apical Cl–/HCO
3–exchanger activity.
Moreover, acid incubation resulted in the insertion of basolateral Cl–/HCO
3–exchangers in 39% of identified β-intercalated cells; this process also required protein synthesis and intact microfilaments, but somehow proceeded despite microtubule inhibition by colchicine. When reviewing the histogram of these responses (see Figure 4), it is clear from a functional viewpoint that there is a continuum of responses, in keeping with the above-noted population studies per-formed after acid-base perturbations. The functional consequences of this β-intercalated cell remodeling is to reverse the polarity of HCO3–flux during acid
treat-ment (see Figure 1) by removing or inactivating apical Cl–/HCO
3–exchangers from the apical membrane and
inserting Cl–/HCO
3– exchangers on the basolateral
membrane. And, from the data of Bastani et al. (7), these adapting cells sorted the H+pumps from the
which is synthesized and polymerized by adapting intercalated cells. Hensin has a critical role in the adap-tation to acid-base disturbances: the cellular mecha-nisms by which it exerts its role must await the identi-fication of its receptor.
Acknowledgments
This work was supported by NIH grants DK-20999 (to Q. Al-Awqati) and DK-50603 (to G.J. Schwartz) and by a Grant-in-Aid from the American Heart Association (0150138N, to G.J. Schwartz). The Columbia Confocal Facility is supported by NIH grant RR-10506.
1. Kaissling, B., and Kriz, W. 1979. Structural analysis of the rabbit kidney.
Adv. Anat. Embryol. Cell Biol.56:1–121.
2. Madsen, K.M., and Tisher, C.C. 1986. Structural-functional relationships along the distal nephron. Am. J. Physiol.250:F1–F15.
3. Tsuruoka, S., and Schwartz, G.J. 1996. Adaptation of rabbit cortical col-lecting duct HCO3–transport to metabolic acidosis in vitro. J. Clin. Invest.
97:1076–1084.
4. Schwartz, G.J., Barasch, J., and Al-Awqati, Q. 1985. Plasticity of func-tional epithelial polarity. Nature.318:368–371.
5. Satlin, L.M., and Schwartz, G.J. 1989. Cellular remodeling of HCO3– -secreting cells in rabbit renal collecting duct in response to an acidic environment. J. Cell Biol.109:1279–1288.
6. Schwartz, G.J., Satlin, L.M., and Bergmann, J.E. 1988. Fluorescent char-acterization of collecting duct cells: a second H+-secreting type. Am. J. Physiol.255:F1003–F1014.
7. Bastani, B., Purcell, H., Hemken, P., Trigg, D., and Gluck, S. 1991. Expres-sion and distribution of renal vacuolar proton-translocating adenosine triphosphatase in response to chronic acid and alkali loads in the rat. J. Clin. Invest.88:126–136.
8. Brown, D., Hirsch, S., and Gluck, S. 1988. An H+-ATPase in opposite plasma membrane domains in kidney epithelial cell subpopulations.
Nature.331:622–624.
9. Schuster, V.L., Fejes-Toth, G., Naray-Fejes-Toth, A., and Gluck, S. 1991. Colocalization of H+ATPase and band 3 anion exchanger in rabbit col-lecting duct intercalated cells. Am. J. Physiol.260:F506–F517. 10. Satlin, L.M., Matsumoto, T., and Schwartz, G.J. 1992. Postnatal
matu-ration of rabbit renal collecting duct. III. Peanut lectin-binding interca-lated cells. Am. J. Physiol.262:F199–F208.
11. McKinney, T.D., and Burg, M.B. 1977. Bicarbonate transport by rabbit cortical collecting tubules. J. Clin. Invest.60:766–768.
12. Atkins, J.L., and Burg, M.B. 1985. Bicarbonate transport by isolated per-fused rat collecting ducts. Am. J. Physiol.249:F485–F489.
13. Lombard, W.E., Kokko, J.P., and Jacobson, H.R. 1983. Bicarbonate trans-port in cortical and outer medullary collecting tubules. Am. J. Physiol.
244:F289–F296.
14. Verlander, J.W., Madsen, K.M., Stone, D.K., and Tisher, C.C. 1994. Ultra-structural localization of H+ATPase in rabbit cortical collecting duct. J. Am. Soc. Nephrol.4:1546–1557.
15. Schuster, V.L. 1993. Function and regulation of collecting duct interca-lated cells. Annu. Rev. Physiol.55:267–288.
16. Yasoshima, K., Satlin, L.M., and Schwartz, G.J. 1992. Adaptation of rab-bit cortical collecting duct to in vitro acid incubation. Am. J. Physiol.
263:F749–F756.
17. Edwards, J.C., et al. 1992. Conditional immortalization of bicarbonate-secreting intercalated cells from rabbit. Am. J. Physiol.263:C521–C529. 18. Hikita, C., Takito, J., Vijayakumar, S., and Al-Awqati, Q. 1999. Only
mul-timeric hensin located in the extracellular matrix can induce apical endo-cytosis and reverse the polarity of intercalated cells. J. Biol. Chem.
274:17671–17676.
19. Takito, J., Hikita, C., and Al-Awqati, Q. 1996. Hensin, a new collecting duct protein involved in the in vitro plasticity of intercalated cell polar-ity. J. Clin. Invest.98:2324–2331.
20. Tsuruoka, S., and Schwartz, G.J. 1997. Metabolic acidosis stimulates H+ secretion in the rabbit outer medullary collecting duct (inner stripe) of the kidney. J. Clin. Invest.99:1420–1431.
21. Tsuruoka, S., Swenson, E.R., Petrovic, S., Fujimura, A., and Schwartz, G.J. 2001. Role of basolateral carbonic anhydrase in proximal tubular fluid and bicarbonate absorption. Am. J. Physiol.280:F146–F154.
22. Schwartz, G.J., Goldsmith, D.I., and Fine, L.G. 1978. p-Aminohippurate transport in the proximal straight tubule: development and substrate stimulation. Pediatr. Res.12:793–796.
23. Tsuruoka, S., and Schwartz, G.J. 1998. Adaptation of the outer medullary collecting duct to metabolic acidosis in vitro. Am. J. Physiol.
275:F982–F990.
24. van Adelsberg, J., Edwards, J.C., Takito, J., Kiss, B., and Al-Awqati, Q. 1994. An induced extracellular matrix protein reverses the polarity of band 3 in intercalated epithelial cells. Cell.76:1053–1061.
25. Vijayakumar, S., Takito, J., Hikita, C., and Al-Awqati, Q. 1999. Hensin remodels the apical cytoskeleton and induces columnarization of inter-calated epithelial cells: processes that resemble terminal differentiation.
J. Cell Biol.144:1057–1067.
26. Fejes-Toth, G., Naray-Fejes-Toth, A., Satlin, L.M., Mehrgut, F.M., and Schwartz, G.J. 1994. Inhibition of bicarbonate transport in peanut lectin-positive intercalated cells by a monoclonal antibody. Am. J. Physi-ol.266:F901–F910.
27. Jennings, M.L., Anderson, M.P., and Monaghan, R. 1986. Monoclonal antibodies against human erythrocyte band 3 protein. Localization of proteolytic cleavage sites and stilbenedisulfonate-binding lysine residues. J. Biol. Chem.261:9002–9010.
28. Hikita, C., et al. 2000. Induction of terminal differentiation in epithelial cells requires polymerization of hensin by galectin 3. J. Cell Biol.
151:1235–1246.
29. Weiner, I.D., Weill, A.E., and New, A.R. 1994. Distribution of Cl–/HCO 3– exchange and intercalated cells in rabbit cortical collecting duct. Am. J. Physiol.267:F952–F964.
30. Koeppen, B.M. 1985. Conductive properties of the rabbit outer medullary collecting duct: inner stripe. Am. J. Physiol.248:F500–F506. 31. Verlander, J.W., Madsen, K.M., Cannon, J.K., and Tisher, C.C. 1994. Acti-vation of acid-secreting intercalated cells in rabbit collecting duct with ammonium chloride loading. Am. J. Physiol.266:F633–F645. 32. van Adelsberg, J., and Al-Awqati, Q. 1986. Regulation of cell pH by Ca+2
-mediated exocytotic insertion of H+-ATPases. J. Cell Biol.102:1638–1645. 33. Winyard, P.J.D., Bao, Q., Hughes, R.C., and Woolf, A.S. 1997. Epithelial galectin-3 during human nephrogenesis and childhood cystic diseases.
J. Am. Soc. Nephrol.8:1647–1657.
34. Takito, J., et al. 1999. Hensin, the polarity reversal protein, is encoded by DMBT1, a gene frequently deleted in malignant gliomas. Am. J. Physiol.
277:F277–F289.
35. Tsuganezawa, H., et al. 2001. A new member of the HCO3–transporter superfamily is an apical anion exchanger of β-intercalated cells in the kidney. J. Biol. Chem.276:8180–8189.
36. Royaux, I.E., et al. 2001. Pendrin, encoded by the Pendred syndrome gene, resides in the apical region of renal intercalated cells and mediates bicarbonate secretion. Proc. Natl. Acad. Sci. USA. 98:4221–4226. 37. Soleimani, M., et al. 2001. Pendrin: an apical Cl–/OH–/HCO
3– exchang-er in the kidney cortex. Am. J. Physiol.280:F356–F364.