http://dx.doi.org/10.4236/ijg.2015.61008
How to cite this paper: Al-Hafdh, N.M. and El-Shaafi, A.E.-S.S. (2015) Geochemistry and Petrology of Basic Volcanic Rocks of Jabal Al Haruj Al-Aswad, Libya. International Journal of Geosciences, 6, 109-144.
http://dx.doi.org/10.4236/ijg.2015.61008
Geochemistry and Petrology of Basic
Volcanic Rocks of Jabal Al Haruj
Al-Aswad, Libya
N. M. Al-Hafdh
1*, Abd El-Salam S. El-Shaafi
21Department of Earth Science, Faculty of Sciences, Mosul University, Mosul, Iraq 2Department of Earth Science, Faculty of Sciences, Benghazi University, Benghazi, Libya
Email: *Alhafdh@yahoo.co.uk
Received 3 January 2015; accepted 26 January 2015; published 30 January 2015
Copyright © 2015 by authors and Scientific Research Publishing Inc.
This work is licensed under the Creative Commons Attribution International License (CC BY). http://creativecommons.org/licenses/by/4.0/
Abstract
which provides strong evidence of a common source. In addition, the rocks display similar pat-terns of the peaks and troughs; this strongly suggests that they have a common parent and com-mon subsequent processes. The compatible transitional metals Ni (81 - 193 ppm) and Cr contents (238 - 361 ppm) and relatively low Mg# (Mg/(Mg + Fet)) (52 - 62) give an indication that the stud-ied basaltic rocks have slightly to moderately fractionated olivine and/or spinel. The magmatism of this volcanic field seems to be related to reactivation of pre-existing structures during the pas-sive rifting of the Sirt Basin that most likely produced in response to convergence between Euro-pean and African plates since Jurassic until Holocene times.
Keywords
Jabal Al Haruj Al Aswad Area, Basaltic Rocks, Geochemistry, Petrology, Petrogenesis, Libya
1. Introduction
The Al Haruj (Jabal Al Haruj al Aswad and al Abiyad) area is located in central part of Libya, and is considered one of the main occurrences of young extrusive rocks. It is the largest of four volcanic provinces in Libya; the other three occurrences are in Gharyan province in north-western Tripoli, Jabal as Sawda between Gharyan and Jabal Al Haruj, and Jabal Nuqy farther south, close to the Tibesti massif at the Chadian-Libyan border (Figure 1).
All these occurrences represent the main Tertiary-Recent volcanics in Libya, and are arranged with older vol-canics in the NNW to the youngest in the SSE. Moreover, the smallest sizes of these volvol-canics are encountered in the extreme south-east of Libya, in Jabal Awayant, Busrewil and Wadsworth [1]. In general, these volcanics are composed essentially of voluminous alkaline basalts and less extensive transitional and theoliitic basalts; more differentiated rocks are less common, Busrewil and Suwesi [2].
[image:2.595.207.420.496.695.2]Al Haruj al Abiyad falls within the Al Haruj basalt field; it is located south-west of the main body and is the youngest region of the field, which is called Al Haruj Aswad. The extensive lava plateaus cover an area of at least 16,000 km2 in Al Haruj al Aswad, preserved as variably eroded lava fields. The entire Al Haruj has a vol-canic area of 45,000 km2; thus, it is significantly larger than the Tibesti volcanic region, Nemeth et al. [3]. Most of the volume of the lava involved in the building of the lava plateau seems to have been extruded in an ex-tremely fluid condition through thousands of fissures, which are not visible in the field, Busrewil and Wads- worth [4].
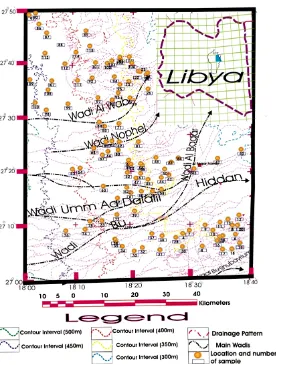
The study area represents the north-eastern part of Jabal Al Haruj al Aswad and is limited by latitudes 27˚00'00"N to 27˚50'00"N and longitudes 18˚00'00"E to 18˚39'58.5"E (Figure 2). The landscape of the study area is characterized by a hilly morphology with frequent steep lava fronts, pressure ridges and blocky lava fields, with transverse intermittent desert sands dotted by balta (kipukas), but in other parts the relief is more or less flat.
Field geological mapping was carried out using Landsat TM multispectral satellite imagery with a scale of 1: 100,000, which can be fitted with any kind of coordinate system with an accuracy of at least 20 m, using a few calibration points that were measured during the fieldwork by GPS (Figure 2). This image formed the base of the geological map completed with altitude contours, locality names and other relevant data, Peregi et al. [5].
As the study area is remote, rather inaccessible and extremely difficult terrain, the fieldwork was carried out with the Industrial Research Centre (IRC), Tripoli as part of the geological mapping project of SE Libya in March 2006. During fieldwork, systematic field traverses were carried out by researchers equipped with GPS units, digital cameras and so on.
[image:3.595.175.453.301.680.2]During the field trip, all basaltic exposures were investigated. About 109 samples were carefully collected from the flows for each phase (Figure 3). Of these, 42 samples were prepared for thin sections, and 29 samples were chosen for the major and trace element analysis using the XRF (Philips 2440) technique carried out by the Central Laboratories of the Egyptian Geological Survey, Cairo.
Figure 3. Topographic contour map showing the main wadis and their drain-age patterns, as well as the localities of the samples.
The drainage patterns developed on the surfaces of the basaltic lava flows show systematic changes with the increasing age of basaltic lava flows, Busrewil and Suwesi [2]. The Landsat TM image shows the drainage pat-tern frequently increases in density as the basaltic rock become progressively older or decreases as the flow be-come younger, as in Phase 5, El-Shaafi [6]. The area investigated is cut by many wadis flowing from west and south-west towards the east and south-east, most of them starting from the central part of Al Haruj Al Aswad, outside the study area.
In the study area, the most common type of drainage pattern is dendritic, which is a well-integrated pattern formed by the main wadis (Wadi Bu al Hiddan, Wadi Al Baqar and Wadi Umm daladil), with tributaries branch-ing and rebranchbranch-ing in several directions without systematic arrangement, Busrewil and Suwesi [2].
The core of southern Libya was formed by Precambrian basement massifs represented by Jabal Awayant, the Tibesti massif and the Tihemboka Arch, which are parts of the Nile craton, East Saharan craton and Pan-African remobilized belt, Hallett [7].
During the Pan-African orogeny, the rocks within these terrains were uplifted and accompanied by intense deformation, shearing and metamorphism. The main phase of the pan-African orogeny was completed about 540 Ma, followed by post-orogenic magmatism until about 440 Ma, interpreted by Klitzsch [8] as the early manifes-tation of the Caledonian orogeny.
This event was accompanied by the formation of NNW-SSE trending extensional structures more than a thousand km long such as the Kalanshio trough, south Haruj uplift, Dor el Qussah trough and the Tripoli-Tibesti uplift, among others. These directly affected the geological history of Al Haruj al Aswad and al Abiyad, Peregi
[image:4.595.176.461.80.445.2]Toward, the Haruj uplift, the Palaeozoic geological development is much less clear than in the Dor el Qussah trough, as this area is covered by the volcanic pile of Al Haruj al Aswad. Following the Pan-African orogeny, Lower Paleozoic sediments were deposited and probably overlain by the Middle-Upper Devonian and Carbonif-erous sedimentary formations, Hallett [7].
After the Hercynian orogeny (Figure 4) almost the entire Kalanshio trough became part of Sirt Arch and most of the Palaeozoic sequence was destroyed by erosion, Peregi et al. [5].
The first data on the radiometric age lava of Jabal Al Haruj was given by Pesce [10], who considered it to be Late Pliocene based on K/Ar determination.
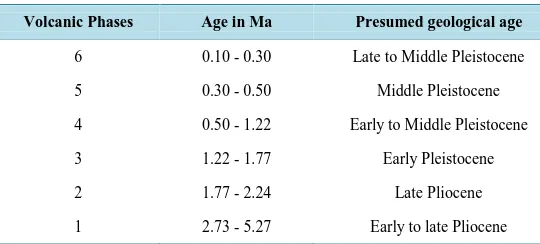
Ade Hall et al. [11] published the first results of a detailed K/Ar whole rock radiometric age determination survey combined with a palaeomagnetic measurement of the Al Haruj volcanic area. The measurements give an interval from 6 to 0.4 Ma for the formation of the volcanic rocks, Less et al. [12], with the majority of the flows being younger than 2.2 Ma. The modern study of age dating by Peregi et al. [5] was based on K/Ar analyses of 20 basalt samples carried out at Atomki in Hungary.
[image:5.595.172.457.283.688.2]It shows that the volcanic activities continued from 5.27 Ma to about 0.1 Ma, which means that they can be assigned to the Pliocene and Pleistocene epochs, taking the limit of the Miocene at 5.3 Ma according to the Global Standard Stratigraphic Age (Table 1).
Table 1. Age of the volcanic phases according to radiometric age determina-tions and paleomagnetic measurements, and their geological interpretation, Peregi et al.[5].
Volcanic Phases Age in Ma Presumed geological age
6 0.10 - 0.30 Late to Middle Pleistocene
5 0.30 - 0.50 Middle Pleistocene
4 0.50 - 1.22 Early to Middle Pleistocene
3 1.22 - 1.77 Early Pleistocene
2 1.77 - 2.24 Late Pliocene
1 2.73 - 5.27 Early to late Pliocene
From this review it is clear that the study area has not been thoroughly studied so far, El-Shaafi [6], except for the work of Klitzsch [13], which deals with the regional geological mapping of Jabal Al Haruj (Al Abiyad and Al Aswad), showing the distribution of six major phases and one minor phase.
On the other hand, Farahat et al. [14] mentioned that the Libyan low volcanicity rift is probably related to the large Afro-Arabian rift system that extends from Turkey to Mozambique. This rift system is thought to have de-veloped episodically rather than continuously. Age dating has suggested that the eastern rift in Kenya has evolved in three major pulses as follows: Eocene (44 - 38 Ma), Middle Miocene (16 - 11 Ma) and Pliocene to Pleistocene (5 - 0 Ma). These ages are generally contemporaneous with the ages of the Libyan volcanics; for example, Jabal Al Haruj was contemporaneous with the third pulse and the Gharyan volcanic province with the three pulses.
The linear trend of the Libyan volcanics and their decrease in age towards the SSE is probably caused by in-traplate extensional stresses. Continental rifting is normally associated with asthenospheric upwelling and high heat flow, but there is some controversy as to the mechanism involved, Farahat et al. [14]. It is difficult to decide whether the volcanic activity in Jabal Al Haruj was related directly to an uprising mantle plume (active rifting) or to the extension of the lithosphere (passive rifting), Peregi et al. [5]. The present work deals mainly with the different exposures in the study area. The exposed strata range in age from the Lower Miocene to Upper Pleis-tocene. Stratigraphically, the basalt flows in the study area disconformably overlie the older sequence of sedi-mentary rocks. The investigated volcanic rocks are overlay Maradah Formation and have a varied morphology, implying that they are produced episodically in consistency with available age data of 5.3 to 0.10 Ma from the Upper Miocene to Upper Pleistocene, Peregi et al. [5].
The study area is not mountain range but rather a vast plateau. The commonest type of volcanic occurrence is represented by basalt lava flows, which shaped the present morphology. Generally, the central eruption of these lava flows are most markedly shown in the central part of Al Haruj, while elsewhere it is on its margins. In con-trast, and despite the study area being located at the margin of Al Haruj, it is difficult to locate these features.
The Jabal Al Haruj Al Aswad volcanic province is characterized by the prevalence of lava of an effusive form rather than an intrusive form. Although some of the lava may have come from central volcanoes, the great vol-ume of lava and the remarkable uniformity in thickness of individual lava sheets over a wide area indicate that the lava must have extruded from numerous fissures, Farahat et al. [14]. In the area investigated, plateau basalts are the most widespread; they are composed of several lava flows, whose thickness does not exceed several me-tres. Five major volcanic phases of different field appearances (including weathering surface, morphology, and primary structures) have been documented in the investigated area in the north-eastern part of Al Haruj Al As-wad province (Figure 5).
2. Petrography
The petrographic characteristics of the Tertiary volcanic rocks of Jabal Al Haruj (al Aswad and al Abiyad) have been studied by many authors, among them Busrewil and Suwesi [2], Less et al. [12], Peregi et al. [5], Vesely [15] and Woller [16].
(a) (b)
Figure 5. Geological map showing (a) The central part of al Haruj al Aswad, studied by Busrewill and Suwesi [2] and the north-eastern part of al Haruj al Aswad (study area) investigated in the present work; (b) Magnified geological map of the study area.
petrographic descriptions 42 samples were selected for detailed petrographic study. Modal analyses of the vari-ous phases of basaltic rocks were carried out using an electronic point counter (Model E). The results of the modal analyses are presented in Table 2.
Microscopically, the rock samples are variably vesicular, amygdaloidal and almost medium grained and sub-ordinately fine grained. Some of the samples are characterized by the presence of variable amounts of glass in the groundmass, but most of them are holocrystalline with an intergranular to intersertal texture.
The phenocrysts consist predominately of olivine and a subordinate amount of clinopyroxene, while plagio-clase is not found. Olivine phenocrysts form about 7% to 21% by volume of the rock and occur as subhedral and sometimes as euhedral crystals without zoning; therefore, they indicate the presence of enough time to equili-brate with the melting at mantle depth.
Olivine phenocrysts sometimes occur as clots displaying a glomerporphyritic texture. Pyroxene phenocrysts were found in some samples as elongated and prismatic crystals. The matrix consists mostly of medium grained plagioclase laths, olivine, clinopyroxene (augite) and opaque minerals (probably ilmenite).
Plagioclase laths are the most abundant, representing 32% to 48% of the matrix in most of the studied samples. They are both pilotaxitically and randomly arranged, and sometimes they exhibit a trachytic arrangement around olivine phenocrysts. Cryptocrystals fill the interstices between plagioclase laths. Some samples showed vesicles filled with carbonate secondary minerals.
The different textures and mineralogical composition of basaltic rocks of each phase are described in more detail in El-Shaafi [6]. A detailed petrographic description of Phase 1 follows.
Phase 1
This phase represents the earliest volcanic activity in the area. The lava flow of this phase is highly weathered, but although weathered in the field, the plagioclase and pyroxene (augite) are nearly fresh under the microscope.
Table 2. Model analyses of representative basaltic rocks from north-eastern part of Al Haruj al Aswad. Phase Number Sample Number Olivine % Clino-Pyroxene % Plagioclase
% Opaque % Glass % Carbonate % Texture Type
1 17 18.57 21.76 37.28 12.96 5.69 3.74 Porphyritic Intergranular
1 54 21.55 24.84 39.14 9.09 2.21 3.17 Porphyritic Intergranular
2 23 13.77 19.55 41.40 8.11 8.20 8.97 Porphyritic Intergranular
2 95 12.29 15.01 37.41 7.28 18.30 9.71 Intersertal, Amygdaloidal
3 35 15.87 24.11 45.31 8.21 3.99 2.51 Porphyritic Intergranular
3 51 16.21 20.01 43.72 6.25 10.41 3.41 Intergranular to Intersertal
3 68 16.45 19.92 48.46 4.29 7.48 3.40 Intergranular to Intersertal
4 30 18.01 19.56 46.09 5.02 10.71 0.61 Intergranular to Intersertal
4 69 19.10 21.14 47.16 4.77 3.68 4.15 Intergranular to Intersertal
4 108 6.71 26.88 46.43 2.56 13.86 3.56 Intergranular to Intersertal
5 86 7.83 12.99 32.92 0.78 42.76 2.72 Intersertal to Hyalo Ophitic
common texture of the rocks of this phase is an intersertal to intergranular texture (Plate 1). The intergranular texture is one in which the dimensions of the plagioclase and pyroxene are similar and the glass is relatively minor, which grades into intersertal when interstitial glass is a significant component.
The rocks are composed mainly of plagioclase, clinopyroxene and olivine. Opaque minerals that might be il-menite are present as accessory minerals. Reddish brown iddingsite and carbonate minerals are secondary prod-ucts. Volcanic glass is also observed. The detailed petrography of Phase 1 as follows:
A―Plagioclase is the most abundant, occurring in the form of laths of lamellar twinned crystals, ranging in size from 0.40 to 0.95 mm in length and from 0.10 to 0.20 mm in width, and occurring in the form of irregular grains. The interference colour of plagioclase laths of the first order is grey to straw-yellow with broad twin la-mellae. Generally, the relief of plagioclase is quite high, so this is a calcium-rich plagioclase, Mackenzie and Adams [17].
Plagioclase crystals contain opaque crystals as inclusions, El-Shaafi [6]. There is more than one generation of plagioclase: the first generation produced small plagioclase crystals which occur as inclusions within clinopy-roxene; the second produced lath-shaped crystals with lamellar twinning. Optical measurements indicate that the plagioclase compositions are generally in the range of An 61% to An 72% (labradorite-bytownite), which is characterized by broad twin lamellae under cross-polarized light. Laths of plagioclase are commonly seen to flow around phenocrysts and form a trachytic texture, which may have resulted from the flow of the magma be-fore solidification, El-Shaafi [6].
B―Olivine is the third of the abundant minerals which occur in the euhedral to subhedral form, or as rounded crystals. The olivine crystals range in size from 0.40 to 1.2 mm in length and from 0.40 to 0.70 mm in width, al-though rounded crystals averaging 0.38 mm diameter are recorded. It is recognized in the examined samples by its colourless, high relief and high birefringence, and it is commonly traversed by randomly oriented cracks.
Olivine phenocrysts are partially or completely converted into a strongly coloured reddish brown along their cracks and boundaries, known as iddingsite, El-Shaafi [6]. Multiple grains as clusters of adhering phenocrysts of olivine were observed and formed a glomerporphyritic texture, El-Shaafi [6]. Skeletal crystals of olivine were observed, where the edges and corners grow more rapidly than the faces, El-Shaafi [6]. More than one genera-tion of olivine were observed: the first generagenera-tion were the phenocrysts, which appear as highly cracked crystals, whereas the second generation produced small scattered crystals associated with clinopyroxene (augite) occu-pying the spaces between the plagioclase.
Plate 1. Microphotographs of olivine basalt of phase one, showing fine-grained rock with micro-phenocrysts of olivine (highest interference colour) and clinopyroxene (augite). The groundmass is composed of olivine, laths shaped of plagioclase and clinopyroxene (augite), with roughly rectangular crystals of opaque minerals. A higher magnification view reveals the olivine crystals and laths of pla-gioclase in more detail. Sometimes clinopyroxene crystals occur as a large poikilitic plate, enclosing several plagioclase and olivine crystals and forming an ophitic texture.
specimens. Rarely, the crystals show simple twining. The crystals are generally fresh, but may be slightly altered along the cracks and cleavages. Some of them contain inclusions of plagioclase and opaque minerals (most probably ilmenite).
A subophitic texture is well developed in the rock, where plagioclase laths are partly enclosed with clinopy-roxene, whereas the carbonate (most probably calcite) iddingsite occurs and secondary constituents.
D―Opaque minerals are present in considerable amounts, being in the form of discrete crystals that exhibit various forms. They are generally of a smaller size than associated silicate minerals, where they range in length from 0.05 mm to 0.20 mm and from 0.035 mm 0.10 mm in breadth, El-Shaafi [6]. They are the primary con-stituents, being crystallized straight from the melt.
E―Volcanic glass is present in some of the examined samples, but in small amounts between the plagioclase laths, manifesting an intersertal texture.
F―Carbonate occurs plentifully in some samples in the interstitial spaces and it fills irregular vesicles and forms an amygdaloidal texture, El-Shaafi [6]. Carbonate minerals have higher birefringence, so that when viewed in cross-polarized light (XPL), they do not show interference colours; instead, they show delicate pastel shades of colours because of the extreme birefringence, which reaches up to the sixth order of interference col-our.
3. Geochemistry
The geochemistry of Late Miocene-Pleistocene basaltic rocks of Al Haruj area has previously been treated by investigators. Busrewil and Wadsworth [1], made the first attempt to undertake a preliminary study of chemical data on Al Haruj volcanics. These authors indicated that the rocks of Al Haruj belong to the alkali olivine basalt association, ranging in composition from basalts to hawaiites. Vesely [15] revealed that the rocks there are com- posed of alkaline to tholeiitic basalts. Busrewil and Suwesi [2] suggested the clustering of Al Haruj volcanics into four trends of differentiation, which may be described as follows: alkali basalts of the block lava series, al-kali basalts of the main lava series, subalal-kali basalts and dolerites.
Peregi, et al. [5] studied the geochemistry of basaltic rocks from Al Haruj al Abiyad; they concluded that they were formed in an intracontinental (within plate) tectonic setting. They classified them into three main mafic groups based on their chemical composition: basanites, alkali basalts and olivine tholeiites. Moreover, they originated from different degrees of partial melting of a similar mantle source. The basanite magmas could have been formed by 0.5% to 1% partial melting, whereas the primary magmas of the alkaline basalts could have been generated by 2% to 6% partial melting, Peregi, et al. [5].
The present study is an attempt to identify the geochemical characteristics of the Late Miocene–Pleistocene basaltic rocks of the NE part of Al Haruj al Aswad, evaluate the chemistry of these rocks within the framework of established magma types and determine the tectonic environment of their eruption. A major step in the devel-opment of evaluating the studied basaltic rocks involves choosing a method that enables rapid and accurate analysis to be conducted of major and trace elements present at low concentrations in silicate materials.
[image:10.595.191.432.377.695.2]Twenty-nine samples were chemically analysed using X-ray fluorescence (Philips 2404) at the Central Labo-ratories of the Geological Survey of Egypt to determine the major and trace elements of the chemically analysed samples (Figure 6). Details of the analytical procedure and precision can be found in Appendix 1 of El-Shaafi [6]. The geochemical data of the 29 samples and the CIPW norms are presented in Table 3.
Table 3. Representative analyses of the major elements (wt%), trace elements (in ppm) and (CIPW) norms of the studied basaltic rocks. CIPW normative components are calculated for the volatile free data normalized to 100%. Fe2O3 and FeO were estimated based on ratio of Fe2O3/FeO = 0.2.
(a)
Representative analyses of the major elements (wt%) of Jabal al Haruj al Aswad
Intrusion SiO2 TiO2 Al2O3 Fe2O3 FeO MnO MgO CaO Na2O K2O P2O5 LOI SO3 Cl Sum Total Fe
DN19 Phase 1.1 49.85 1.79 15.81 1.65332 8.2666 0.15 6.49 9.26 3.65 0.98 0.25 0.01 0.14 0.13 98.43 10.84
DN49 Phase 1.1 48.23 1.55 15.54 1.68688 8.4344 0.16 6.38 9.92 3.38 0.74 0.22 1.17 0.85 0.16 98.421 11.06
DN50 Phase 1.1 48.13 1.62 15.77 1.62282 8.1141 0.16 5.54 10.02 3.6 0.73 0.19 1.39 1.57 0.24 98.697 10.64
DN52 Phase 1.1 47.9 1.87 15.63 1.53 8.35 0.15 5.2 12.33 3.45 0.96 0.32 1.21 0.31 0.11 99.32 10.13
DN53 Phase 1.1 47.63 1.73 15.11 1.67467 8.3734 0.16 6.56 10.17 3.39 0.97 0.31 0.77 1.69 0.18 98.718 10.98
DN54 Phase 1.1 50.06 1.64 16.33 1.57554 7.8777 0.16 6.02 9.37 3.7 0.91 0.23 0.55 0.1 0.2 98.723 10.33
DN97 Phase 1.1 50.18 1.64 16.41 1.67162 8.3581 0.16 5.72 9.36 3.96 0.68 0.19 0.01 0.18 0.16 98.68 10.96
DN64 Phase 1.1 46.93 1.56 15.27 1.67162 8.3581 0.16 5.7 11.82 3.24 0.69 0.28 1.03 1.81 0.1 98.622 10.96
DN5 Phase 1.1 48.45 1.64 15.08 1.68993 8.4496 0.16 6.7 10.4 3.22 0.77 0.23 0.94 0.69 0.26 98.68 11.08
DN12 Phase 1.1 50.85 1.83 15.67 1.62892 8.1446 0.15 5.59 9.21 3.65 0.79 0.14 0.4 0.41 0.23 98.694 10.68
DN13 Phase 1.1 50.76 1.7 16.35 1.58164 7.9082 0.15 5.56 9.46 3.82 0.95 0.2 0.01 0.12 0.16 98.73 10.37
DN17 Phase 1.1 47.66 1.61 14.44 1.62282 8.1141 0.15 6.65 10.9 3 0.54 0.15 1.59 1.9 0.2 98.527 10.64
DN23 Phase n.2 48.25 1.88 15.81 1.61062 8.0531 0.16 5.26 10.46 3.55 0.81 0.31 1.78 0.7 0.17 98.804 10.56
DN80 Phase n.2 47.89 1.68 14.63 1.63197 8.1598 0.15 6.95 10.44 3.29 0.78 0.22 1.83 0.91 0.15 98.712 10.7
DN94 Phase n.2 49.95 1.71 17.5 1.52063 7.6031 0.15 4.75 10.56 4 0.54 0.27 0.19 0.09 0.05 98.884 9.97
DN95 Phase n.2 50.06 1.87 15.74 1.60451 8.0226 0.16 6.05 9.54 3.6 0.86 0.23 0.39 0.53 0.12 98.777 10.52
DN35 Phase n.3 48.75 2.07 15.22 1.7189 8.5945 0.16 6.32 9.9 4 0.96 0.37 0.19 0.4 0.1 98.753 11.27
DN43 Phase n.3 48.3 1.57 15.81 1.54961 7.748 0.15 5.66 10.38 3.53 0.77 0.19 1.26 1.67 0.18 98.768 10.16
DN51 Phase n.3 48.48 1.8 14.88 1.61977 8.0988 0.15 7.51 9.89 3 0.94 0.24 0.64 1.26 0.21 98.719 10.62
DN55 Phase n.3 50.12 1.83 16.62 1.61062 8.0531 0.16 4.71 10.34 3.85 0.74 0.29 0.15 0.14 0.09 98.704 10.56
DN68 Phase n.3 49.51 1.87 15.16 1.63502 8.1751 0.17 7.66 9.23 3.45 0.89 0.34 0.12 0.39 0.07 98.67 10.72
DN30 Phase n.4 51.63 1.82 16.54 1.45047 7.2523 0.15 5.36 8.97 4.03 1.06 0.3 0.01 0.05 0.13 98.753 9.51
DN33 Phase n.4 49.45 1.62 14.80 1.63654 8.1827 0.15 7.00 10.23 2.96 0.56 0.14 1.01 0.79 0.18 98.709 10.73
DN69 Phase n.4 49.65 1.68 16.25 1.59689 7.9844 0.16 5.82 10.24 3.75 0.83 0.26 0.13 0.16 0.18 98.691 10.47
DN92 Phase n.4 51.60 1.81 15.65 1.61977 8.0988 0.15 6.17 8.59 3.34 0.76 0.14 0.00 0.18 0.18 98.289 10.62
DN108 Phase n.4 48.44 1.87 14.75 1.7189 8.5945 0.17 7.15 10.42 3.29 0.80 0.27 0.84 0.12 0.16 98.593 11.27
DN86 Phase n.5 48.87 1.76 14.91 1.81499 9.075 0.17 7.35 10.09 2.99 0.68 0.15 0.11 0.49 0.20 98.66 11.90
DN87 Phase n.5 48.77 2.06 14.07 1.91261 9.563 0.17 6.96 10.01 3.22 0.86 0.21 0.14 0.46 0.13 97.946 12.54
(b)
CIPW norms of the studied Jabal al Haruj al Aswad basaltic rocks. CIPW normative components are calculated for the volatile free data normalized to 100% Fe2O3 and
Intrusion Q Or Ab An Ne Di Hy Ol Mt Il Ap
DN19 Phase 1.1 5.91 30.89 23.86 0 17.1 2.03 12.72 2.44 3.46 0.58
DN49 Phase 1.1 4.55 28.6 25.045 0 19.3 0.45 13.8 2.54 3.06 0.53
DN50 Phase 1.1 4.49 29.04 24.714 0 20.4 0 11.8 2.46 3.23 0.46
DN52 Phase 1.1 5.79 20.94 24.326 4.87 29.3 0 7.6 2.28 3.63 0.74
DN53 Phase 1.1 5.79 24.45 23.147 1.85 21.6 0 13.41 2.52 3.42 0.74
DN54 Phase 1.1 5.5 31.31 25.262 0 16.4 3.2 10.98 2.32 3.19 0.56
DN97 Phase 1.1 4.08 33.51 24.992 0 16.9 1.155 12.28 2.46 3.17 0.44
DN64 Phase 1.1 4.25 21.79 25.084 3.22 27.3 0 10.01 2.51 3.1 0.67
DN5 Phase 1.1 4.73 27.25 24.419 0 21.7 0.84 13.04 2.54 3.21 0.56
DN12 Phase 1.1 4.79 30.89 24.04 0 17.4 10.84 4.4 2.41 3.55 0.32
DN13 Phase 1.1 5.73 32.32 24.659 0 17.5 3.3 9.53 2.33 3.29 0.46
DN17 Phase 1.1 3.37 25.39 24.34 0 24.7 3.29 10.11 2.48 3.23 0.37
DN23 Phase n.2 4.96 28.56 24.811 0.81 21.4 0 10.39 2.41 3.72 0.74
DN80 Phase n.2 4.85 26.25 22.847 0.88 23.5 0 13.17 2.45 3.34 0.53
DN94 Phase n.2 3.19 32.36 28.2 1.03 18.6 0 10.23 2.36 3.27 0.63
DN95 Phase n.2 5.2 30.46 24.248 0 18 0 8.68 2.36 3.63 0.56
DN35 Phase n.3 5.79 27.68 20.739 3.42 21.7 0 12.37 2.52 4.01 0.88
DN43 Phase n.3 4.79 28.12 25.019 1 21.6 0 11.17 2.33 3.11 0.46
DN51 Phase n.3 5.73 25.39 24.359 0 19.5 0 11.54 2.39 3.35 0.58
DN55 Phase n.3 4.43 32.58 25.882 0 19.8 0 9.31 2.35 3.53 0.67
DN68 Phase n.3 6.26 29.19 23.25 0 17 4.29 13.05 2.42 3.63 0.72
DN30 Phase n.4 6.38 34.1 23.91 0 15.5 6.03 6.91 2.13 3.51 0.7
DN33 Phase n.4 3.43 25.05 25.442 0 20.6 0 4.89 2.45 3.17 0.32
DN69 Phase n.4 5.02 30.06 25.055 0 20.1 0 11.68 2.35 3.25 0.6
DN92 Phase n.4 0.65 4.61 28.26 25.465 0 13.6 20.07 0 2.39 3.51 0.32
DN108 Phase n.4 4.85 26.97 23.116 0.5 22.5 0 14 2.54 3.65 0.65
DN86 Phase n.5 4.08 25.3 25.253 0 19.9 7.18 10.67 2.68 3.42 0.35
DN87 Phase n.5 5.2 27.25 21.397 0 22.6 2.53 12.67 2.83 4.01 0.49
(c)
Representative analyses of trace elements (ppm) of Jabal al Haruj al Aswad basaltic rocks
Intrusion Sc V Cr Co Ni Cu Zn Rb Sr Y Zr Nb Mo
DN19 Phase 1.1 195.7 337.5 56.8 190.5 69.2 70.6 4.9 332.8 <1 86.8 10.1 1.6
DN49 Phase 1.1 227.4 319.9 52.9 120.4 48.0 70.2 5.2 179.2 <1 72.9 10.0 2.4
DN50 Phase 1.1 203.6 295.6 51.7 134.8 47.1 63.5 6.7 179.9 <1 70.4 9.7 2.1
DN52 Phase 1.1 207.5 281.4 50.7 116.9 54.4 59.6 4.2 184.0 <1 66.1 9.2 2.0
DN53 Phase 1.1 199.1 277.3 58.6 117.6 34.4 61.6 4.4 174.5 <1 64.0 7.8 2.3
DN54 Phase 1.1 201.6 281.1 53.9 160.5 73.0 63.8 6.3 197.3 <1 74.4 8.7 1.7
DN97 Phase 1.1 205.7 292.1 47.2 186.6 68.1 61.0 6.4 220.1 <1 81.0 11.0 2.7
DN64 Phase 1.1 206.9 322.1 51.1 184.9 53.4 62.6 5.5 306.2 <1 88.1 10.7 2.3
DN5 Phase 1.1 211 289.0 59.6 150.4 47.2 66.3 5.8 198.9 <1 76.5 11.1 2.5
DN12 Phase 1.1 196.5 273.4 54.6 141.5 46.0 66.0 5.1 238.5 <1 79.8 10.8 2.4
DN13 Phase 1.1 196.8 287.4 51.2 134.1 41.3 62.3 5.3 221.6 <1 71.0 9.5 1.7
DN17 Phase 1.1 204.7 325.3 58.0 124.6 47.0 63.8 5.4 318.8 <1 84.8 9.1 2.8
DN23 Phase n.2 193.2 267.8 53.5 118.6 41.5 52.5 5.2 240.5 <1 80.5 11.2 2.0
DN80 Phase n.2 210.3 305.3 54.2 136.9 68.5 70.0 5.6 206.1 <1 83.2 11.9 1.5
DN94 Phase n.2 219.2 292.7 51.7 141.6 45.5 59.7 5.4 266.2 <1 82.8 10.7 1.8
DN95 Phase n.2 196.7 238.7 42.6 81.9 52.9 58.7 3.4 176.9 <1 59.5 7.2 1.8
DN35 Phase n.3 197.3 339.1 53.5 193.1 55.0 66.8 5.6 306.4 <1 84.2 8.6 1.6
DN43 Phase n.3 208.3 329.4 47.1 114.0 60.2 62.2 4.9 405.6 <1 99.3 12.4 1.5
DN51 Phase n.3 186.1 265.0 45.2 124.2 48.1 56.9 4.6 247.0 <1 71.0 9.0 1.9
DN55 Phase n.3 201.2 282.1 43.8 137.3 50.5 60.0 5.6 235.9 <1 80.4 10.4 2.0
DN68 Phase n.3 228.1 316.0 61.2 153.8 47.7 65.0 5.2 388.3 <1 101.4 12.4 1.9
DN30 Phase n.4 217.1 268.5 48.8 108.3 32.6 62.5 7.1 186.6 <1 76.6 9.8 1.9
DN33 Phase n.4 211.9 304.1 53.4 114.7 44.5 74.7 6.0 183.1 <1 68.9 8.3 1.5
DN69 Phase n.4 211.2 283.3 46.5 103.0 35.2 58.9 5.8 187.9 <1 71.5 10.4 2.1
DN92 Phase n.4 237.1 358.4 56.9 133.6 47.9 70.7 6.3 176.9 <1 75.4 9.8 2.6
DN108 Phase n.4 215.0 345.2 56.7 172.8 49.4 71.7 4.7 202.9 <1 75.1 10.7 1.6
DN86 Phase n.5 243.2 327.6 57.3 139.1 52.4 68.8 6.1 200.1 <1 75.1 9.6 1.0
DN87 Phase n.5 260.0 361.3 60.1 165.3 59.1 70.8 7.0 236.6 <1 91.6 13.9 1.7
(d)
Representative analyses of trace elements (ppm) continued
Intrusion Sn Ba La Yb Hf Ta Pb Th
DN19 Phase 1.1 3.2 333.4 16.5 4.4 3.7 3.7 3.9 <1
DN49 Phase 1.1 5.9 176.6 6.0 4.1 2.8 4.2 3.9 <1
DN50 Phase 1.1 2.2 177.5 17.4 4.2 3.7 3.7 4.7 2.3
DN52 Phase 1.1 2 191.6 13.5 3.9 1.8 4.0 4.8 4.4
DN53 Phase 1.1 2.4 166.4 15.0 4.1 3.4 4.0 4.1 <1
DN54 Phase 1.1 2.4 241.3 11.4 4.2 3.0 3.5 7.7 <1
DN97 Phase 1.1 3.2 194.7 13.7 4.3 3.4 4.0 <1 <1
DN64 Phase 1.1 2.4 616.0 7.1 4.1 2.2 3.6 4.8 3.0
DN5 Phase 1.1 0.6 203.6 19.0 4.2 3.4 5 6.4 4.0
DN12 Phase 1.1 3.7 930.6 15.3 4.2 4.6 3.6 4.3 2.0
DN13 Phase 1.1 2.9 157.7 17.9 4.2 3.5 3.8 4.4 <1
DN17 Phase 1.1 2.5 214.2 15.5 4.1 2.2 3.4 4.5 1.0
DN23 Phase n.2 1.9 194.3 10.2 4 2.8 3.6 2.8 2.2
DN80 Phase n.2 3.4 189.8 12.3 4 3.1 3.6 5.5 0.8
DN94 Phase n.2 2.0 1070 13.4 4 4.9 2.8 2.2 2.1
DN95 Phase n.2 4.3 164.1 7.2 3.9 1.4 3.2 4.9 2.8
DN35 Phase n.3 2.4 1062 15.7 4.1 4.4 3.3 6.3 1.0
DN43 Phase n.3 1.5 764.0 15.4 4 3.4 4.1 3.8 2.3
DN51 Phase n.3 2.5 310.3 10.5 3.9 3.5 3.2 6.4 <1
DN55 Phase n.3 2.2 321.3 12.3 4 2.3 3.1 5.0 2.1
DN68 Phase n.3 3.8 663.0 17.0 4.1 3.8 3.3 3.7 <1
DN30 Phase n.4 3.7 219.8 12.6 3.9 3.5 3.6 5.5 3.0
DN33 Phase n.4 4.1 352.8 16.4 4.1 1.5 4.6 4.9 <1
DN69 Phase n.4 3.5 199.4 15.6 4.1 3.3 4 6.7 1.4
DN92 Phase n.4 2.1 176.8 19.5 4.1 4 4 4.6 <1
DN108 Phase n.4 2.5 292.0 11.3 4.2 4.1 3.9 5.9 1.0
DN86 Phase n.5 1.1 180.9 14.7 4.2 3.4 4 4.3 2.0
DN87 Phase n.5 2.4 182.0 29.9 4.2 3.3 3.4 6.4 2.5
DN90 Phase n.5 2.8 173.0 22.9 4.1 2.5 3.5 6.1 2.0
The chemical composition ranges of the investigated samples as a whole are relatively narrow within each in-dividual basaltic phase and also within the different phases that existed there. The chemical ranges of the studied samples are somewhat restricted.
According to the CIPW norm, the analysed rocks are characterized by a high normative olivine content, with at most a low content of normative nepheline. Hence, these rocks can be classified as olivine basalt. The occur-rence of normative hypersthene leads to rock being classified as normal olivine transitional basalt. SiO2 ranges
the primitive mantle. The studied basaltic rocks are actually basalt on the basis of their silica content.
The petrographical criteria obtained from the studied basaltic rocks are not strictly conclusive in their classi-fication. However, the modal contents cannot be accurately determined in most cases in volcanic rocks because of the fine grain size and presence of glassy materials. Therefore, some chemical criteria should be used to de-termine the basalt type of the studied rocks. The chemical classifications use parameters such as the existence of oxides, functions of oxides and ratios. Various suggestions have been proposed in this domain by different au-thors.
The volcanic rocks may be subdivided into two members of the major magma series, alkalic and subalkalic; however, although the boundary between them is marked as a solid line, it is actually transitional.
From the various literature dealing with petrochemical classification, it is clear that four types of basaltic rocks can be distinguished: tholeiitic basalts, transitional basalts, alkali basalts and high alumina basalts or calc-alkaline basalts, Cox et al. [19]. The concept of transitional basalts between the tholeiitic and alkali basalt type has been clarified by many authors, e.g. Middlemost, [20]. For the chemical classification of the basaltic rocks under consideration variation diagrams are employed using major elements, which are introduced in the following.
According to Middlemost [21] the investigated samples are transitional basalts of either a soda or potash se-ries. This can be accomplished by an empirical boundary line on a soda vs potash diagram. The studied transi-tional basalts were found to belong to the soda series (Figure 7).
[image:15.595.201.426.347.454.2]In addition to the classifications based on major elements, certain variation diagrams have been suggested by Winchester and Floyd [23] to classify the basaltic rocks using five minor and trace elements (Ti, P, Zr, YNb) to produce a set of binary diagrams that discriminate between tholeiitic and alkali basalts (Figure 8).
Figure 7. K2O versus Na2O (wt%) diagram, showing the subdivision of the transitional magma series into the Na sub-series of the samples in question, after Winter [22].
[image:15.595.207.420.491.696.2]The P2O5-Zr diagram shows that the investigated samples are plotted close to the boundary of the alkali
be-tween the alkali basalt and tholeiitic basalt, whereas the TiO2-Zr/P2O5 diagram shows that most of samples are
situated in alkali field (Figure 8). This is expected since these diagrams use phosphorous as a principal compo-nent, which shows varying degrees of mobility, as stated by Rollinson [24]. Moreover, the Zr values of the stud-ied samples are generally low.
The major element data contains only Fe2O3 as total iron. To obtain appropriate CIPW norms these values had
to be recalculated into Fe2O3 and FeO. In the current study the ratio of Fe2O3/FeO = 0.2 was used (Less et al.
[12]; Peregi et al., [5]). Middlemost [20] has proposed a range of oxidation ratios (Fe2O3/FeO) for use with
vol-canic rocks drawn from geological literature; that of basalts is Fe2O3/FeO = 0.2, Rollinson, [24].
There are various published programs for the calculation of the CIPW. The CIPW normative calculation in the current study was carried out by Norm4 software, written by Kurt Hollocher of the Geology Department, Union College, New York State. Several methods for the normative classification of basaltic rocks have been proposed. Yoder and Tilley [25] devised a scheme for classifying basaltic rocks by their CIPW norms using a basalt tetra-hedron. Several modifications have been suggested to this classification and various schemes have been pro-posed by later investigators. Among these, Thompson [26] propro-posed a classification scheme for basalts based upon CIPW normative proportions of Ne, Ol, Di, Hy and Q. The three equilateral triangles of Thompson's dia-gram [26] represent basaltic and related rocks, which are respectively undersaturated, saturated and oversatu-rated: silica-undersaturated basalts (alkali basalts) are characterized by normative Ol + Ne; silica-saturated ba-salts (olivine tholeiite) are characterized by Hy + Ol; and, silica-oversaturated baba-salts (quartz tholeiites) are characterized by normative Q + Hy. With regard to normative minerals, the most studied samples are classified into hypersthene-normative; Wilkinson [27] considered hypersthene-normative rocks to be transitional or mild alkaline.
Busrewil and Oun [28] suggested that the transitional basalt is applied to basaltic rock that exhibits a nepheline-free norm. Three samples belonging to Phase 1, two samples from Phase 2 and two samples from Phase 3 were classified into nepheline-normative alkaline basalts (ne = 0.10 - 4.8; alkali-ol basalts), and one sample from Phase 4 was located at the boundary between ol-tholeiite and quartz tholeiite; this latter sample is near to oversaturation in SiO2, which is a common feature of tholeiitic basalts (Figure 9).
The two main types of variation diagrams currently used are bivariate plots and triangular diagrams. A bivari-ate plot shows the variation between samples and identifies trends. Elements plotted along the x-axis of the dia-gram should be selected either to show maximum variability between samples or illustrate a particular geo-chemical process. Normally, in basic igneous rock MgO might be selected, Rollinson, [24].
One of the most commonly used alternatives to the Harker diagram is MgO plot. This is most appropriate for a rock series which includes abundant mafic members, as in this case the range of SiO2 concentrations may be
[image:16.595.202.427.503.681.2]small. The changes in selected major and minor element oxides are plotted against MgO for representative sam-
ples from the study area. The analyses exhibit an evolutionary trend representing slight increases in SiO2, K2O
and Na2O, along with decrease CaO, FeOt and MgO. Clearly, MgO increases with increased FeOt. However, in
spite of this overall trend there is no consistent chemical pattern related to each phase.
Vague correlations between MgO and most other oxides in the studied samples probably suggest that these are related by different degrees of partial melting rather than by fractional crystallization. The relatively low MgO of less than 7.5 wt% and Ni (81 - 193 ppm) and Cr (238 - 361 ppm) contents indicates that the studied basaltic rocks exhibit slight to moderate fractionation of olivine and/or spinel. Consequently, the basaltic rocks are not primary magmas.
On average in the studied samples, the lava flows of Phase 5 and two samples from Phase 3 are more primi-tive. MgO is an important component of the solid phases in equilibrium with mafic melts and shows a great deal of variation, either as a consequence of the breakdown of magnesium phases during partial melting or as a result of their removal during fractional crystallization. Below 7% MgO-CaO correlates positively with MgO, indicat-ing the removal of CaO-MgO from the liquid due to the crystallization of plagioclase and clinopyroxene. How-ever, above 7% MgO and CaO-MgO correlate negatively, because this part of the trend is controlled entirely by the olivine. Inflections are most obvious where the number of fractionating minerals is small, Rollinson, [24].
Trace element data provide a clearer view than the major and minor elements of distinct sources for the vari-ous magma types. In the current study the focus is on the trace elements, which due to enrichment and depletion are revealing about the nature of the basalt plateau. The trace element data can be used to evaluate the source composition, degree of partial melting and subsequent processes. The ratios of incompatible elements have been employed to distinguish between source reservoirs. The concentrations of the compatible trace elements (Ni, Cr, Co, Cu) are low in the studied samples, which supports our contention that they are not primary magma.
A characteristics feature of the studied volcanic rocks is their relatively constant ratios of certain incompatible trace elements (Nb/Zr and Rb/Zr) (Table 4). Relative constancy of ratios of incompatible elements provides strong evidence of a common source (homogenous). Also, the (Zr/Nb) ratios of studied basaltic rocks are less than 10, which indicates an ocean island basalt (OIB) source, Winter [22].
Crustal contamination would certainly alter the ratios of Zr/Nb and Hf/Ta. The studied mafic samples have similar ratios, so the effect of crustal contamination on the studied basaltic rocks is probably minor, Baker [29].
Several variants of the spider diagram have been used in the literature, with different elements and different normalization schemes. The order of the elements along the abscissa may vary slightly between different authors. Spider diagrams are flexible, and a variety of elements and normalizations have been displayed using them, Winter, [22]. In the current study, the comparison of the geochemical composition of the different rock samples, representative of different phases, with the MORB-normalized trace element patterns was used by Pearce [30].
Figure 10 compares the incompatible elements of each sample with the most abundant igneous rocks on the planet. The large ionic lithophile (LIL) elements are on the left-hand side of the diagram and the high field strength (HFS) elements are on the right. Both are arranged in order of increasing incompatibility away from the margins, so that the most incompatible elements are just left of the centre of the diagram, Winter [22].
[image:17.595.91.540.577.719.2]The MORB-normalized trace element patterns of representative samples of different volcanic phases are given in Figure 10. Based on these diagrams, the patterns show a fairly close similarity in the shape and con-centration range. The diagrams show a slightly different concon-centration of some incompatible trace elements
Table 4. Ratios between some trace elements of the studied mafic rocks that could be used for their petrogenesis.
Phase One Phase Two
Sample No. 97 19 12 13 17 5 49 50 52 53 54 64 23 80
Nb/Zr 0.135 0.116 0.135 0.134 0.106 0.144 0.136 0.137 0.139 0.121 0.117 0.120 0.138 0.143
Rb/Zr 0.078 0.056 0.063 0.074 0.063 0.075 0.070 0.095 0.069 0.084 0.062 0.064 0.067 0.065
Phase Two Phase Three Phase Four Phase Five
Sample No. 94 95 35 43 51 55 30 33 69 92 108 86 90 87
Nb/Zr 0.129 0.120 0.125 0.126 0.128 0.122 0.127 0.120 0.145 0.129 0.142 0.127 0.128 0.151
Figure 10. MORB-normalized patterns for selected samples from the study area, representa-tive of different phases from Phases 1 to 5 (normalized data is greater than one). The Ba con-centration of the studied samples shows extreme variation in some samples due to very high sensitivity to secondary processes.
within samples of the same phase, and also between samples representative of different phases, but they showed nearly identical behaviour for the less incompatible trace elements (Hf, Sm, Ti, Yb).
The studied basaltic rocks showed more peaks and troughs, reflecting the variable behaviour of the elements involved. Basalts from the study area are clearly enriched by the whole spectrum of more incompatible elements relative to MORB samples (normalized values greater than one). They show a broad central hump in which both LIL (K, Ba), and HFS (Ta) elements also reveal slight negative anomalies in Rb, Nb and Zr. The rocks display similar patterns of the peaks and troughs, which strongly suggests they share a common parent and subsequent processes, Winter [22]. Thus, based on this, the basalts could have a common genesis.
The basaltic samples from different volcanic phases show a fairly similar character to each other in their geo-chemical behaviour. Consequently, one phase cannot be distinguished from another based on their trace element contents.
From the consistent negative slopes, it can be deduced that the slope of the studied basaltic rocks are distinct from MORB slope and appear to originate in the lower enriched mantle reservoir, although a very low degree of partial melting may also produce LREE-enriched melts from primordial or slightly depleted sources, Cox et al.
[19]. The pattern is regarded as typical of melts generated from relatively undepleted mantle material.
Spikes at LIL (Rb, Ba, K) may reflect enrichment, perhaps due to contamination of magma by continental crust. Negative Nb anomalies are also characteristic of the continental crust and may be an indicator of crustal involvement in magma processes, Rollinson [24]. Enriched LIL and the slight alkaline of the studied basaltic rocks suggest derivation from an enriched mantle source, Aboazom [31].
The high LIL/HFS pattern and negative Nb anomaly is a feature of many intracontinental volcanics, suggest-ing this pattern may be also a feature of the subcontinental lithospheric mantle (Fitton et al. [32]; Hawesworth [33]).
Figure 11. La/Zr vs La/Nb for the studied basalt samples, after Hop-per et al.[34].
The distinct phases suggest a single source and probably similar degrees of partial melting. The positive trend in Figure 12 reflects the mixing of material derived from the source, Hopper et al. [34].
The elements of the first transition series (Ti, V, Cr, Mn, Fe, Co, Ni, Cu, Zn) vary in geochemical behaviour, and most of them are considered to be compatible elements. Transitional element plots have been mainly used with basalts as a means of exploring the geochemical behaviour of the first transitional elements, Rollinson [24].
Figure 12shows consistent trends for most studied samples representative of different phases on chondrite- normalized plots. They show progressive depletion from Ti to Ni and have a positive Ti anomaly and negative Cr anomaly. Cu and Zn are more variable and their concentrations may not reflect the original igneous values, (Longmuir et al. [35]. Anomalies in Ni and Cr concentrations may reflect the role of olivine (Ni) and clinopy-roxene or spinel (Cr); Ti anomalies indicate the role of Fe-Ti oxides as opaque minerals.
Despite differences in the major element chemistry, the pronounced and very close patterns of similarity of trace elements of all the samples representative of the different phases certainly suggest there is a common source for the mantle peridotite beneath Al-Haruj province.
3.1. Comparison of the Studied Mafic Rocks with the Mid-Oceanic Ridge (OIB)
A broad spectrum of trace elements for the studied basalts rock can be compared using composite (average) OIB, as proposed by Sun [37] (Figure 13). The patterns of the studied basaltic rocks are similar in the shape to OIB, but vary in the concentration range of some incompatible trace elements. OIB enrichment in LIL (Sr, K, Rb) thus suggests a somewhat depleted mantle source relative to OIB, Winter [22].
3.2. The Results of Correspondence Analysis
There is a large body of literature on the statistical treatment of geochemical data. Correspondence analysis is a descriptive and exploratory technique designed to analyse multi-way tables containing some measures of corre-spondence between rows (observations) and columns (variables). The results provide information that is similar in concept to those produced by correlation techniques. The term “inertia” in correspondence analysis can be thought of as a measurement of variation in data.
Obviously, the final goal of correspondence analysis is to find a graphical interpretation (meaning) from ex-tracted dimensions (dimension 1 on the x-axis and dimension 2 on the y-axis). Thus, one can make the interpre-tation that the great similarity between the average of the elements of each phase with regard to the correlation between most HFS, LIL and transitional metal elements is more in Phase 4. However, as has been indicated, it is appropriate to make general statements about the nature of the dimensions (Figure 14).
Figure 12. Transitional metal concentrations in most studied samples representative of the five phases, normalized to chondritic values, showing the same behaviour of transitional metal of different phases. The normalized values are taken from Kay and Hubbard [36].
Figure 13. MORB-normalized spider diagram for average OIB, data from Rollinson, [24] and average representative analyses of the studied samples.
Judging the quality of the average of five phases expresses the value and importance of each phase in the cur-rent study, so in Table 5 it can be clearly observed that all phases are of highly significant importance. The cor-respondence analysis is useful for drawing attention to the likelihood that all phases were generated by sharing a common source.
3.3. Tectonic Environments
[image:20.595.228.420.373.549.2]Figure 14. Correspondence analysis for trace elements of the average five phases presented in the area investigated, plotted on coordinates (on dimension 1 and dimension 2).
Table 5. The results of correspondence analysis for the average of the five phases.
Aver. Phases Colum Coordinate Coordinate Quality
Average Ph. 1 1 0.052836 −0.032650 0.818930
Average Ph. 2 2 −0.093243 0.028226 0.904941
Average Ph. 3 3 −0.262192 −0.0125540 0.995548
Average Ph. 4 4 0.135643 0.042508 0.970742
Average Ph. 5 4 0.261218 −0.020566 0.991675
Floyd and Winchester [46] found that basalts with similar chemistry may be produced in different tectonic re-gimes, since their compositions reflect the nature of the particular mantle and the melting processes operating rather than the regime in which they are found. Probably, this often makes the chemical designation of ancient basalt less certain.
Wood et al. [47] considered the effects of crustal contamination which were not considered by Pearce and Cann [41] and yet which are likely to have a significant influence in the appearance of continental flood basalts and may be a contributory factor in their persistence in classification, Rollinson [24]. There are a large number of discrimination diagrams applicable to basalts and basaltic andesites, which use trace elements and minor and major elements to distinguish the different environments of basalt. Of course, the investigator should not rely wholly on any single technique or plot, Winter [22].
Pearce [38] developed a method that classified basalts in term of their tectonic setting on the basis of their major element patterns. He calculated the discriminant function based upon the eight major oxides and presented discriminant diagrams to identify mid-oceanic ridge basalt (MORB), within plate basalt, oceanic island basalt (OIB), continental flood basalt (CFB), calc-alkaline basalts (CAB), island arc tholeiites (IAT) and shoshonites (SB).
[image:21.595.145.486.419.514.2]2 2 2 3
2 2
SiO 0.0774TiO 0.0102Al O 0.0066FeO 0.0017MgO
0.0143CaO 0.0155Na O 0.0007K O 1 0.0088
F − + + −
− − +
= +
.
2 2 2 3
2 2
2 0.0130SiO 0.0185TiO 0.0129Al O 0.0134FeO 0.0300MgO
0.00204CaO 0.0481Na O 0.071K O
F = − − − − −
− − − .
It is clear that the majority of the samples investigated are plotted in the field of within-plate basalts (Figure 15).
Wood [47] proposed the Th-Hf-Ta ternary discrimination diagram based upon the immobile (HFS) elements. Using this classification (Figure 16(a)), the studied basaltic rocks plot closer to the fields of within-plate basalts. The elements Th, Hf, and Ta existed in very low concentrations in basalts and cannot accurately determined by XRF analysis.
The advantage of using minor elements as discriminants between basalts is that they are readily detected and more accurately determined than trace elements, Rollinson [24].
Pearce et al. [42] found in an empirical study that it was possible to discriminate between oceanic and conti-nental basalts with a single straight boundary line on a TiO2-K2O-P2O triangular diagram (Figure 16(b)). The
[image:22.595.200.427.305.458.2]field oceanic basalts included MORB and OIB. The studied basaltic rocks are plotted around the line separating the two fields.
Figure 15. Major element discrimination diagram for basalts, after Pearce [38], showing the most studied samples plot in the field of within-plate basalts.
(a) (b)
[image:22.595.108.519.490.682.2]4. Summary and Discussions
The tertiary volcanic rocks of Jabal Al Haruj represent the largest volcanic province in Libya covering an area of ≈ 45,000 km2, which originated during several phases of eruptions that were closely associated in space and
time.
The study area is located in north-eastern Jabal Al Haruj al Aswad, an area which has not been studied in a thorough manner so far. Nevertheless, the work of Klitzsch [13] gave research details showing the distribution of six major phases and one minor phase. The most important study in this respect was done by Busrewil and Suwesi [2] on the Al Haruj al Aswad. The authors gave a detailed volcanological study of the area and distin-guished six volcanic phases.
The division of the volcanic phases used in the present work is based on similar principles to those developed by the earlier authors, which are as follows:
Colour variation of the lava flows of different phases on Landsat TM images. Degree of weathering of the rocks.
Accessibility of lava fields.
Morphological and lithological characteristics observable in the field. Superposition of the lava flows and drainage pattern.
Field evidence has revealed that each of these criteria are complementary and cannot be used separately, Bus-rewil and Suwesi [2]. Field studies included geologic mapping and the identification of mode of occurrence of the volcanics. According to modern age dating, the volcanic activity in the area started in the Late Miocene and lasted until the Late Pleistocene. The first five of the six volcanic phases of the Al Haruj volcanic province are present in the study area. The geological setting, the petrography, the geochemistry and tectonic setting of these occurrences are examined in this study. The following is a summary of the above-mentioned aspects and the main conclusions obtained during the present work.
Field geological mapping was carried out using Landsat TM multispectral satellite imagery. This imagery formed the base of the geological map, which was completed by the addition of topographic contours, locality names and drainage pattern of wadis, as well as other field criteria. The study area is remote, rather inaccessible and extremely difficult terrain. Due to this, the field work was carried out in parallel with the Industrial Research Centre (IRC), Tripoli during their regional geological mapping of SE Libya in March 2006.
The topographic form of the old volcanic phases is highly modified, while the forms of more recent phases are usually fresh and very well preserved. In general, each basalt flow unit begins at the bottom with the most massive part, characterized by a fine to micro-vesicular texture, and it evolves upwards into an obviously ve-sicular texture. The basalts are dark to medium and pale gray with a porphyritic appearance. A fresh sample was taken from the massive part of each flow unit.
Characteristic features of Phase 1 are the blocky, rough, subangular to subrounded rocky structure and have smooth surfaces, massive and less vesicular. On the satellite image it is distinguished by a bluish colour.
Phase 2 covers a limited geographical extent and outcrops in small scattered localities in parts of the study area. Lava flows from this phase tend to disintegrate into small blocks and slabs, less than 50 cm in diameter. The vesicles are often elongated in the direction of flow. The presence of lamination is pronounced by the altera-tion of the variable concentraaltera-tion of vesicles. The accessibility of the area covered by Phase 2 is particularly bad. On the satellite image it is discriminated by a greyish to reddish blue colour, and an almost homogenous surface without any readily recognizable features.
The lava field of Phase 3 covers a large area with subangular blocks that form the rough type of morphology. The blocks are coated by thin dark brown crust providing a rather characteristic field appearance. The fresh broken surface of the rock is black or dark grey. The rocks are readily recognizable on the satellite image by their brown tone or hue, and the hilly morphology dotted by number of large balta (kipukas). The kipuka, or ac-cording to their Arabic name balta, are closed shallow depressions within the lava flows surrounded by lava tongues. In Phase 3 the geomorphological dimension of baltas may vary.
The exposures of Phase 4 are widespread in the central Al Haruj al Aswad and in the study area. From the central part of Al Haruj al Aswad large volumes of Phase 4 lava flow poured downward in a more or less radial pattern. The flows are distinguished by their morphology and the preservation of surface features. Lava flowing down pre-existing wadis acquired an elongated form as they filled the wadis.
but in other places the contact is quite sharp. This phase is represented by dark grey to black vesicular lavas in the upper part with polygonal columnar joints and dense masses in the lower part. This flow is characterized by hilly morphology, pressure ridges and steep distinctly fresher lava scarps. On the satellite image, it has a black colour and features a large number of baltas.
Phase 5 is represented by a well-preserved volcanic form with the freshest of rocks, a vesicular form, and the conspicuous features of the pahohoe structure. The rocks of this phase cover a relatively small area confined to the south-west part of the study area. The excellent preservation and appearance of this phase reflects the younger age of these basaltic flows. On the satellite image the rocks are dark black with dots, representing small baltas of 5 to 20 m in size.
The drainage pattern developed on the surface of basaltic lava flows shows systematic alteration with the age of the basaltic lava flows, Busrewil and Suwesi [2]. From the Landsat TM image, the drainage frequently de-creases as the flows of basaltic rock become progressively younger, as Phase 5 has a less dense drainage pattern.
The Libyan volcanic provinces are spatially related to two structural trends: early Palaeozoic structural ele-ments of a prevalent NNW-SSE direction and by late Palaeozoic to Mesozoic structures with a general ENE- WSW trend. These elements represent the regional structures that have played an important role in the geologi-cal evolution of Libya, Peregi et al. [5]. Klitzsch [8] suggested that the basalts of Al Haruj al Aswad erupted at the crossing zone of NW trending early Palaeozoic elements (south Al Haruj uplift) and the NE trending late Paleozoic elements (Tibesti-Sirt uplift), and they probably also used some of the upper Cretaceou-Tertiary faults as conduits.
According to Busrewil and Suwesi [2], the major structural trend of the central part of Al Haruj al Aswad volcanic province is controlled by the alignment of spatter cones and the distribution of the more recent lava flows (Phases 5 and 6) along NW-SE and NE-SW directions. Herein, the present area is located to the north- eastern part of Al Haruj al Aswad, where the data taken from the investigated area reveal that Phases 4 and 5 are controlled by the NE-SW direction, which is coincident with the pattern of the most distinct structures in the re-gion (Figure 17).
From the direction of flow of the more recent lava (Phases 4, 5, 6) and from the alignment of cones, it is sug-gested that the situation of the Al Haruj lava field is related to tensional lines, one parallel to the Dur al Qussah fault system and the other running along the prolongation of the Hun graben, Busrewil and Suwesi [2]. These lines probably represent extensional stresses reactived by Proterozoic basement faults in the direction NW-SE, NNW-SSE, NE, NNE and E-W during the late Cenozoic, reflecting the evolution of the Red Sea, EL-Akhal [48]. The rising magma erupted along the fault planes cutting across the lower most resistant areas at the cross points of these tensional lines. The lava field and its associated volcanoes are thus considered to have resulted from a rather continuous release of pressure in the main central feeder. After the activity waned in Al Haruj volcanic province (after the Pleistocene), and the area was cut by a conspicuous rejuvenated NW-SE set of faults, Bus-rewil and Suwesi [2].
The different rock varieties of the study area are petrographically described in 42 thin sections showing cer-tain petrographic features signifying the different varieties. Mineralogically, most of the studied basaltic rocks contain olivine as an essential mineral together with clinopyroxenes (augite), plagioclase (labradorite to by-townite) feldspars and opaque accessory minerals (probably ilmenite). The recorded olivines are unzoned and either fresh or altered.
Phases 1, 3 and 4 contain a higher modal olivine content and olivine phenocrysts that are larger in size than those from Phases 2 and 5.
The volcanic trends (Phases 4 and 5) are well documented in the area investigated by the continuation of the NE-SW structural trend.
Therefore, the studied rocks can be considered as olivine bearing or olivine basaltic rocks, since they contain a significant amount of modal olivine.
The degree of alteration of the olivines in the studied rocks varies greatly; alteration is manifested around the edges and along the cracks of Phases 3 and 4. On the other hand, highly altered basaltic rocks are found in Phases 1 and 2. The alteration products are either partial or complete to deep reddish iddingsite. Clinopyroxene (augite) is detected in the investigated rocks: it has a maximum extinction angle of 44˚ to 51˚, and is character-ized by a pale brown colour, and is subhedral to anhedral and prismatic in shape. Pleochrism is not observed in most samples.
Figure 17. The structural alignment of the central part of al Haruj al Aswad volcanic province (Phases 5 and 6) and a scatter of cones following NE-SW and NW-SE trends, Busrewill and Suwesi [2].
roxene (augite) and high contents of vesicles, amygdales and cryptocrystalline to glassy groundmass and mi-crophenocrysts of olivine, which are fresher when compared to rocks from other phases. Plagioclase laths are the most abundant, representing 37% to 48% of the matrix in most of the studied samples. The composition of the plagioclase varied between An 58% to An 78% (labradorite to bytownite). They are both pilotaxitically and randomly arranged, and sometimes they exhibit a trachytic arrangement around olivine phenocrysts. Brown glass and cryptocrystals fill the interstices between laths of plagioclase. The rocks exhibit a porphyritic texture with phenocrysts embedded within the groundmass, whereas the groundmass shows intergranular, intersertal, ophitic and subophitic textures. Olivine phenocrysts occur sometimes as clots displaying a glomerporphyritic texture.
The order of crystallization of the minerals in the rocks from the various phases is similar. Phenocrysts of oli-vine result from a slower cooling beneath the surface in the magma chamber prior to eruption. Therefore, they indicate the presence of enough time to equilibrate with the melt at mantle depth. Upon eruption, the remaining liquid crystallizes to form fine laths and tabular or equant crysts comprising the groundmass and resulting in a dense network of plagioclase microlites and pyroxene granules, with opaque oxides of a small size. Glass may solidify at late stage, filling spaces between minerals and forming an intersertal texture, as in Phase 5.
Inclusions of opaque minerals should have formed at an earlier stage than the plagioclase (labradorite to by-townite) that enveloped them. In the ophitic texture, laths of plagioclase (labradorite to byby-townite) enveloped by larger pyroxene (augite) is commonly interpreted as indicating that the clinopyroxene (augite) formed later, Winter, [22]. An anhedral or skeletal form of olivine indicates that their formation is in the later or final stages of rock crystallization, Winter [22]. From petrographical and mineralogical criteria alone, it is evident that the in-vestigated basaltic rocks have more olivine phenocrysts than the pyroxene (augite). The groundmass typically consists of interlocking plagioclase (Labradorite to Bytwonite) laths with stubby prisms of clinopyroxene (augite) granules of olivine and opaque minerals.
of the study of Busrewil and Wadsworth [1]. Busrewil and Suwesi [2] suggested that they are a “subalkaline ba-saltic series which show some similarities except that they are more clearly subophitic with the presence of more opaque minerals”. Consequently, the studied mafic volcanic rocks representative of the five phases are probably transitional between alkaline and subalkaline series. But, it must be emphasized that it is necessary to establish their geochemical character to define their petrogenetic affinity within the framework that will establish the magma type. The difference between the various phases is due to the circumstances of magma solidification, not a manifestation of major variances in mineralogical and chemical composition.
The findings of the present study are a positive supplement to previous works such as that by Peregi et al. [5], which suggested that “the petrographic similarity of the mafic rocks that should be noticed, cannot be distin-guished frequently in terms of volcanic phases and flow units based on their petrographic characteristics. The difference sometimes may be more significant in samples taken from the surfaces and deeper part of the same lava flow, than between the different volcanic rock phases.”
Again, the above study agrees with that by Farahat et al. [14] who stated that “differences in groundmass tex-tures may be related to differential degrees of cooling and crystallization at various levels of the outpouring of magma.”
The geochemistry of the basaltic rock under consideration has been revealed through the analysis of 29 sam-ples for their major and trace elements determined quantitatively by Philips (2404) X-ray fluorescence (XRF). Several geochemical parameters and various diagrams were adopted to recognize the chemical characteristics of these rocks, to evaluate their chemistry within the framework of established magma types and to determine the tectonic environment of their phases.
The major elements of the investigated rocks and the content of their trace elements demonstrates that all the phases are similar in chemical composition. In terms of different methods of recent chemical classification based on major, minor and trace elements, the investigated basaltic rocks have a subalkaline to alkaline affinity. If the term “transitional basalts” is accepted, the investigated rocks are best named as “transitional”.
The most studied samples are hypersthene-normative. Wilkinson [49] considered hypersthene-normative rocks to be transitional or mild alkaline, and other samples were classified as nepheline-normative or alkaline basalts, and one sample was located at the boundary between olivine tholeiite and quartz tholeiite, which could represent a distinctive feature of tholeiitic basaltic rock.
In the current study, the focus has been on trace elements, which are generated as enriched or depleted and reveal more about the nature of basaltic rocks. Concentrations of compatible trace elements are low in the stud-ied samples, which supports the contention that they are not primary magma. A characteristic feature of the studied volcanic rocks is their relatively constant ratios of certain incompatible trace elements such as Nb/Zr and Rb/Zr. The constancy of incompatible element ratios provides strong evidence that they were generated from a common source. The Zr/Nb ratios of the basaltic rocks are less than 10, which also indicates an OIB source. The studied samples have similar ratios of Zr/Nb and Hf/Ta, so the effect of crustal contamination on the studied ba-saltic rocks is probably minor.
Based on MORB normalized trace element patterns of representative samples of different volcanic phases, the patterns show fairly close similarities in their shape and concentration range, whereas they are characterized by very slightly different concentrations of some incompatible trace elements within samples of the same phase and also between samples representative of different phases, but those showed a nearly similar pattern in the less in-compatible trace elements.
The studied samples of the different phases, which were enriched in all incompatible trace elements over MORB (normalized values greater than one) in proportion to the degree of incompatibility, also showed slightly positive anomalies in K, Ba and Ta and slightly negative anomalies in Rb, Nb and Zr. The rocks display similar patterns of peaks and troughs, strongly suggesting that they share a common parent and subsequent processes, Winter [22].
The basaltic samples from the different volcanic phases showed remarkable similarities with each other, but with slight geochemical variations in some incompatible elements. Consequently, the phases cannot be distin-guished from one another on the basis of their trace element contents.


![Figure 4. The volcanic distribution and relation between NW trending (Cale-donian) and NE trending (Hercynian) structural elements and the volcanic eruptions, after Woller and Feduick [9]](https://thumb-us.123doks.com/thumbv2/123dok_us/8183638.811417/5.595.172.457.283.688/distribution-relation-trending-hercynian-structural-elements-eruptions-feduick.webp)
![Figure 5. Geological map showing (a) The central part of al Haruj al Aswad, studied by Busrewill and Suwesi [2] and the north-eastern part of al Haruj al Aswad (study area) investigated in the present work; (b) Magnified geological map of the study area](https://thumb-us.123doks.com/thumbv2/123dok_us/8183638.811417/7.595.82.539.80.379/geological-studied-busrewill-suwesi-eastern-investigated-magnified-geological.webp)


![Figure 7. K2O versus Na2O (wt%) diagram, showing the subdivision of the transitional magma series into the Na sub-series of the samples in question, after Winter [22]](https://thumb-us.123doks.com/thumbv2/123dok_us/8183638.811417/15.595.207.420.491.696/figure-diagram-showing-subdivision-transitional-samples-question-winter.webp)
![Figure 9. The classification of the studied samples according to their CIPW normative composition expressed as Ne-Ol-Di, Ol- Di-Hy, Di-Hy-Q (basalt tetrahedron, after Thompson, [26])](https://thumb-us.123doks.com/thumbv2/123dok_us/8183638.811417/16.595.202.427.503.681/figure-classification-according-normative-composition-expressed-tetrahedron-thompson.webp)
