not insulin resistance in mice with P465L
PPAR
gg
Yau-Sheng Tsai, … , Jason K. Kim, Nobuyo Maeda
J Clin Invest.
2004;
114(2)
:240-249.
https://doi.org/10.1172/JCI20964
.
Peroxisome proliferator–activated receptor
g
(PPAR
g
), the molecular target of a class of
insulin sensitizers, regulates adipocyte differentiation and lipid metabolism. A dominant
negative P467L mutation in the ligand-binding domain of PPAR
g
in humans is associated
with severe insulin resistance and hypertension. Homozygous mice with the equivalent
P465L mutation die in utero. Heterozygous mice grow normally and have normal total
adipose tissue weight. However, they have reduced interscapular brown adipose tissue and
intra-abdominal fat mass, and increased extra-abdominal subcutaneous fat, compared with
wild-type mice. They have normal plasma glucose levels and insulin sensitivity, and
increased glucose tolerance. However, during high-fat feeding, their plasma insulin levels
are mildly elevated in association with a significant increase in pancreatic islet mass. They
are hypertensive, and expression of the angiotensinogen gene is increased in their
subcutaneous adipose tissues. The effects of P465L on blood pressure, fat distribution, and
insulin sensitivity are the same in both male and female mice regardless of diet and age.
Thus the P465L mutation alone is sufficient to cause abnormal fat distribution and
hypertension but not insulin resistance in mice. These results provide genetic evidence for a
critical role for PPAR
g
in blood pressure regulation that is not dependent on altered insulin
sensitivity.
Article
Cardiology
Find the latest version:
Research article
240 The Journal of Clinical Investigation http://www.jci.org Volume 114 Number 2 July 2004
Hypertension and abnormal fat
distribution but not insulin resistance
in mice with P465L PPAR
γ
Yau-Sheng Tsai,1 Hyo-Jeong Kim,2 Nobuyuki Takahashi,1 Hyung-Suk Kim,1
John R. Hagaman,1 Jason K. Kim,2 and Nobuyo Maeda1
1Department of Pathology and Laboratory Medicine, University of North Carolina, Chapel Hill, North Carolina, USA.
2Department of Internal Medicine, Section of Endocrinology and Metabolism, Yale University School of Medicine, New Haven, Connecticut, USA.
Peroxisome proliferator–activated receptor
γ
(PPAR
γ
), the molecular target of a class of insulin
sensitiz-ers, regulates adipocyte differentiation and lipid metabolism. A dominant negative P467L mutation in the
ligand-binding domain of PPAR
γ
in humans is associated with severe insulin resistance and hypertension.
Homozygous mice with the equivalent P465L mutation die in utero. Heterozygous mice grow normally and
have normal total adipose tissue weight. However, they have reduced interscapular brown adipose tissue
and intra-abdominal fat mass, and increased extra-abdominal subcutaneous fat, compared with wild-type
mice. They have normal plasma glucose levels and insulin sensitivity, and increased glucose tolerance.
How-ever, during high-fat feeding, their plasma insulin levels are mildly elevated in association with a
signifi-cant increase in pancreatic islet mass. They are hypertensive, and expression of the angiotensinogen gene
is increased in their subcutaneous adipose tissues. The effects of P465L on blood pressure, fat distribution,
and insulin sensitivity are the same in both male and female mice regardless of diet and age. Thus the P465L
mutation alone is sufficient to cause abnormal fat distribution and hypertension but not insulin resistance
in mice. These results provide genetic evidence for a critical role for PPAR
γ
in blood pressure regulation that
is not dependent on altered insulin sensitivity.
Introduction
Insulin resistance is the chief abnormality present in metabolic syndrome, a complex physiological condition in which obesity, hypertension, dyslipidemia, and diabetes mellitus coexist in a single individual (1). Thiazolidinediones (TZDs), a class of insu-lin sensitizers, mediate antidiabetic actions by interacting with the nuclear receptor peroxisome proliferator–activated receptor γ
(PPARγ) (2). PPARγ is expressed mainly in adipose tissue and is also detectable in the liver, kidney, intestine, and skeletal muscle. PPARγ heterodimerizes with retinoid X receptor (RXR) and reg-ulates the transcription of target genes through binding to spe-cific peroxisome proliferator response elements. The majority of known target genes are involved in glucose and lipid metabo-lism. To date, the endogenous PPARγ ligands include various fatty acids and their metabolites (2). These findings indicate that PPARγ functions as a lipid sensor, regulating energy homeostasis. The importance of PPARγ in adipogenesis has been demonstrated by its early expression in preadipocyte differentiation (3). Lack of PPARγ causes embryonic lethality in mice (4, 5), and PPARγ–null embryos rescued by tetraploid aggregation have no discernible
white adipose tissue (4). Furthermore, loss-of-function muta-tions in the ligand-binding domain of PPARγ are associated with lipodystrophy in humans (6–8).
Several lines of evidence support the idea of involvement of PPARγ in the regulation of glucose homeostasis and insulin sen-sitivity (2). Although activation of PPARγ by TZD is beneficial in improving insulin sensitivity, mice heterozygous for PPARγ defi-ciency (Pparg+/– mice) with reduced PPARγ activity are protected
from the insulin resistance induced by a high-fat diet (5). Similarly, in humans, the lower PPARγ activity linked to the PPARγ polymor-phism P12A is associated with enhanced insulin sensitivity and reduced body weight (9). Higher than normal PPARγ activity with the P115Q mutation is observed in severely obese subjects with mildly decreased insulin sensitivity (10). In contrast, two domi-nant negative mutations, P467L and V290M, with reduced PPARγ
activity were found among patients with severe insulin resistance and diabetes (11). Thus, it is not clear how aberrant PPARγ signal-ing relates to insulin resistance and metabolic syndrome.
Hypertension is frequently associated with obesity (12) and modestly with insulin resistance (13), but the genetic and physi-ological mechanisms underlying these associations are not fully elucidated. Hyperinsulinemia, a consequence of insulin resistance, can affect blood pressure (BP) through increased sodium reabsorp-tion, proliferation of vascular smooth muscle cells, and activation of sympathetic outflow (14). In addition, several components of the renin-angiotensin system (RAS), a key determinant of BP, are expressed in adipose tissue (15), providing a potential link between adipose tissue and hypertension. In rodent models, obese Zucker rats have increased angiotensinogen (AGT) expression and secre-tion from adipose tissue (16). Transgenic mice overexpressing AGT in adipose tissue have higher BP and increased fat mass (17). These
Nonstandard abbreviations used: adipocyte fatty acid–binding protein (aP2); angiotensin I (AngI); angiotensin II (ATII); angiotensin II type I receptor (AT1R); angiotensin II type II receptor (AT2R); angiotensinogen (AGT); brown adipose tissue (BAT); glucose transporter 4 (Glut4); hepatic glucose production (HGP); heterozygous for PPARγ deficiency (Pparg+/–); intraperitoneal glucose tolerance test (IPGTT);
intraperitoneal insulin tolerance test (IPITT); lipoprotein lipase (LPL); peroxisome proliferator–activated receptor γ (PPARγ); phosphoenolpyruvate carboxykinase (PEPCK); renin-angiotensin system (RAS); retinoid X receptor (RXR); thiazolidine-dione (TZD); uncoupling protein 1 (UCP1).
Conflict of interest: The authors have declared that no conflict of interest exists. Citation for this article:J. Clin. Invest.114:240–249 (2004).
doi:10.1172/JCI200420964.
findings support the idea of a potential role for the adipose RAS in the development of obesity and obesity-related hypertension.
TZDs are reported to decrease BP in hypertensive rat models (18), as well as in human patients (19), and are thought to direct-ly regulate BP through PPARγ in vascular smooth muscle cells (20) and endothelial cells (21, 22). Patients with the dominant negative mutations P467L and V290M in PPARγ were noted to have early-onset hypertension (11). However, the mechanism by which these dominant negative mutations lead to insulin resis-tance and hypertension in vivo is not known, and whether the elevated BP is dependent on or independent of altered insulin sensitivity is not clear.
To determine whether the P467L mutation directly causes insulin resistance and hypertension, we have generated mice in which the proline at position 465 of the mouse PPARγ protein (equivalent to residue 467 in the human protein) is substituted with leucine through gene targeting. Homozygous PpargP465L/P465L
mice die in utero. Heterozygous PpargP465L/+ mice exhibit
abnor-malities seen in the human P467L patients, including elevated BP
(11) and abnormal fat distribution (6), but unlike humans, they main-tain normal insulin sensitivity.
Results
Mice with the PPARγ P465L mutation.
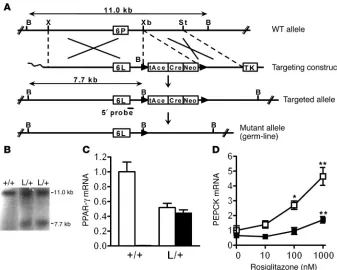
We mutated codon 465 of the mouse
Pparg gene (equivalent to codon 467 in human PPARG) from CCC (pro-line) to CTG (leucine) via gene target-ing in mouse ES cells, and generated mice carrying the P465L substitution (Figure 1A). Southern blots (Figure 1B) and nucleotide sequence analy-ses (data not shown) confirmed the mutation in the Pparg gene. Wild-type and heterozygous PpargP465L/+
littermates were born at the expected mendelian ratio (34:61) from mat-ing of heterozygous pairs, but no homozygous PpargP465L/P465L mice
were born. Thus, homozygosity for the P465L mutation is lethal in utero, establishing that the mutant protein is effectively nonfunctional. For the following studies, we used F1
off-spring derived from crosses between 129/SvEv heterozygous PpargP465L/+
mice and C57BL/6 wild-type mice. Precision quantitative RT-PCR revealed that expression of the wild-type allele in adipose tissues of
PpargP465L/+ mice was, as expected, about
50% of that in wild-type littermates (Figure 1C). The mutant P465L tran-scripts in PpargP465L/+ mice were present
at the same level as the wild-type tran-scripts, showing that the mutant allele is transcribed normally. Total amounts of PPARγ transcripts were not differ-ent between PpargP465L/+ and wild-type
mice. Similarly, there was no compensatory alteration in the gene expression of RXRα, PPARα, or PPARδ (data not shown).
Cultured gonadal adipose tissue isolated from wild-type mice responded to rosiglitazone by increasing expression of the PPARγ
target gene encoding phosphoenolpyruvate carboxykinase (PEPCK) in a dose-dependent manner (Figure 1D). In contrast, activation of PEPCK expression was markedly impaired in cul-tured adipose tissue from PpargP465L/+ mice (Figure 1D),
indicat-ing that rosiglitazone-dependent activation of wild-type PPARγ is dominantly suppressed by the P465L protein in vivo.
Abnormal body fat distribution in PpargP465L/+ mice. PpargP465L/+ mice
developed normally and appeared healthy. Their food and water intake, urine output, rectal temperature, and hematological parameters, and the macroscopic and microscopic features of their major organs were normal (data not shown). Fasting plasma lipids, including total cholesterol, triglyceride, and FFA, were not altered in PpargP465L/+ mice (Table 1). The growth curves of both
male and female PpargP465L/+ mice were the same as those of
[image:3.585.49.386.81.351.2]wild-type mice fed regular chow or a high-fat diet (Figure 2A). Organ
Figure 1
Generation of mice with the PPARγ P465L mutation. (A) Crossovers (indicated by the large X marks) between the wild-type mouse Pparg locus with Pro465 in exon 6 (6P) (top diagram) and targeting construct with Leu465 (6L) (second diagram) resulted in the targeted allele in ES cells (third diagram). The ACN (Cre-Neo) cassette, flanked by loxP sequences, was excised out of the mutant allele upon germline transmission (bottom diagram). B, X, Xb, and St indicate the BamHI, XhoI, XbaI, and StuI restriction enzyme sites, respectively. tAce, testis-specific Ace promoter; TK, thymidine kinase. (B) Southern blot analysis of genomic DNA. The targeted allele was identified by a 5′ probe that hybridizes to an 11-kb fragment in wild-type (+/+) DNA and to a 7.7-kb fragment in heterozygous DNA that includes the P465L mutation (L/+). (C) PPARγ mRNA of the wild-type (white bars) and mutant allele (black bar) in gonadal adipose tissue from wild-type and PpargP465L/+ mice (n =8 each). The PPARγ mRNA amount
is expressed relative to that of wild-type allele in wild-type mice. (D) Rosiglitazone-induced PEPCK expression in gonadal adipose tissue explants. Tissues isolated from four wild-type (open squares) and four PpargP465L/+ (filled squares) mice were incubated in cultured media containing various
research article
242 The Journal of Clinical Investigation http://www.jci.org Volume 114 Number 2 July 2004
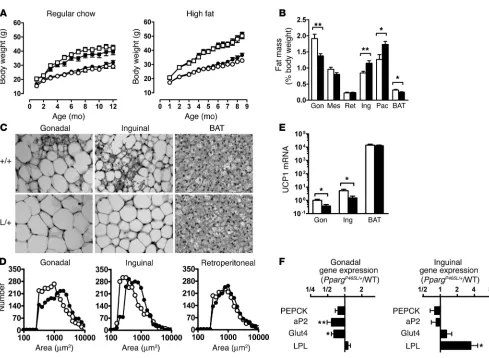
and total weights of abdominal fat pads (gonadal, mesenteric, ret-roperitoneal, and inguinal, normalized by body weight) were not significantly different between mice of the two genotypes.
Despite the similar total body fat in PpargP465L/+ and wild-type
mice, we found significant differences in their fat distribution (Figure 2B). The interscapular brown adipose tissue (BAT) weight relative to body weight of PpargP465L/+ mice was about
80% that of wild-type mice (P <0.02), and the gonadal fat mass in PpargP465L/+ mice was about 70% (P <0.004). In contrast, the
weight of the inguinal fat pad in PpargP465L/+ mice was increased
to about 140% that of wild-type mice (P <0.01). The pectoral subcutaneous fat pad in PpargP465L/+ mice was similarly increased
(P <0.02). Consequently, the ratio of intra-abdominal fat weight to extra-abdominal fat weight (the sum of mesenteric, gonadal, and retroperitoneal fat depots versus inguinal fat) in PpargP465L/+
mice was substantially reduced to 63% that of wild-type mice (P <0.0001). A high-fat diet led to fat deposition in both mutant and wild-type mice and increased this difference in fat distribu-tion (47% of wild-type; P <0.0001).
Microscopically, the cellularity of adipose tissues in wild-type mice was heterogeneous. In contrast, the adipocytes in PpargP465L/+
mice were relatively uniform and the number of small adipocytes was reduced (Figure 2C). The size distributions of adipocytes in the gonadal and inguinal fat from PpargP465L/+ mice showed
sig-nificant shifts toward larger cells compared with the distributions from wild-type mice (Figure 2D). Retroperitoneal, mesenteric, and pectoral fat showed a similar but less marked trend. These results suggest that the increase in inguinal fat mass of PpargP465L/+
mice is mainly due to an increase in triacylglycerol storage, while the decrease in gonadal fat mass is due to a decrease in cell num-ber. Both the gonadal and inguinal fat pads of PpargP465L/+ mice
showed a decrease in the number of multilocular adipocytes (Fig-ure 2C). Consistent with this, we found significant reductions in mRNA for the brown fat–specific protein uncoupling protein 1 (UCP1) in gonadal and inguinal adipose tissues to 37% (P <0.02) and 29% (P <0.03) that of wild-type mice, respectively (Figure 2E). The amount of UCP1 mRNA in interscapular BAT did not differ between PpargP465L/+ and wild-type mice (Figure 2E).
To examine the in vivo effects of the P465L mutation on the expression of PPARγ target genes, we measured their steady-state mRNA levels in adipose tissues. Despite the impaired PEPCK activation in culture described above, expression of the gene encoding PEPCK in both gonadal and inguinal adipose tis-sues of PpargP465L/+ mice was indistinguishable from that of
wild-type mice (Figure 2F). In contrast, mRNA levels for adipocyte fatty acid–binding protein (aP2; reduced to 0.58× wild-type levels, P <0.002) and glucose transporter 4 (Glut4; reduced to 0.64× wild-type levels, P <0.05) were significantly decreased in gonadal but not inguinal adipose tissue in PpargP465L/+ mice.
Conversely, expression of the gene encoding lipoprotein lipase (LPL) was not affected in gonadal adipose tissue but was signifi-cantly increased in inguinal adipose tissue of PpargP465L/+ mice
(increased to 3.48× wild-type levels, P <0.05). Thus, the presence of the P465L mutation does not lead to a uniform change, but exerts adipose depot–specific effects on the basal expression of PPARγ target genes in vivo.
These results demonstrate that the P465L mutation in PPARγ
causes abnormal fat distribution, leading to a preferential deposi-tion of fat in subcutaneous fat pads rather than in intra-abdomi-nal fat pads, and reduces the number of small adipocytes, includ-ing mutilocular adipocytes, in these white fat depots.
Normal insulin sensitivity in PpargP465L/+ mice. The human
P467L mutation is associated with severe insulin resistance, hyperinsulinemia, and diabetes. However, the plasma glucose concentrations in PpargP465L/+ mice after fasting were normal
compared with those of wild-type mice (Table 1). Their plasma insulin levels were slightly but not significantly higher than those of wild-type mice. Feeding the mice a diet high in fat for 4 weeks substantially increased plasma glucose and insulin levels in both
PpargP465L/+ and wild-type mice compared with feeding the mice
regular chow. The PpargP465L/+ mice fed the high-fat diet had
slight-ly lower glucose and higher insulin levels than did their wild-type littermates fed a similar diet (Table 1). These differences were not statistically significant, however.
To assess the dynamic response of PpargP465L/+ mice to increased
[image:4.585.56.531.114.275.2]glucose concentrations, we performed the intraperitoneal glucose
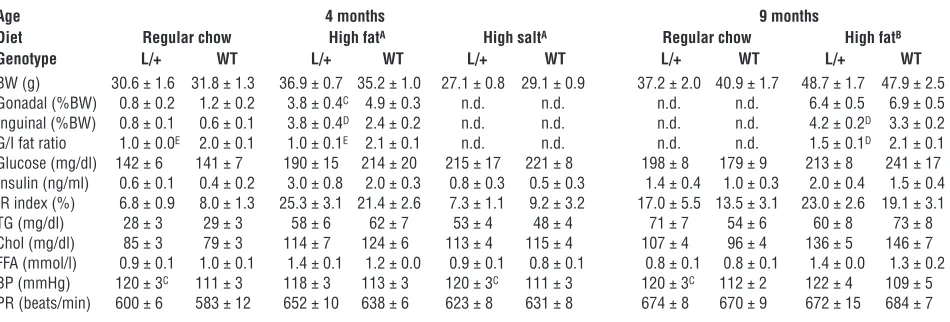
Table 1
Metabolic parameters in PpargP465L/+ (L/+) and WT male mice
Age 4 months 9 months
Diet Regular chow High fatA High saltA Regular chow High fatB
Genotype L/+ WT L/+ WT L/+ WT L/+ WT L/+ WT
BW (g) 30.6 ± 1.6 31.8 ± 1.3 36.9 ± 0.7 35.2 ± 1.0 27.1 ± 0.8 29.1 ± 0.9 37.2 ± 2.0 40.9 ± 1.7 48.7 ± 1.7 47.9 ± 2.5 Gonadal (%BW) 0.8 ± 0.2 1.2 ± 0.2 3.8 ± 0.4C 4.9 ± 0.3 n.d. n.d. n.d. n.d. 6.4 ± 0.5 6.9 ± 0.5 Inguinal (%BW) 0.8 ± 0.1 0.6 ± 0.1 3.8 ± 0.4D 2.4 ± 0.2 n.d. n.d. n.d. n.d. 4.2 ± 0.2D 3.3 ± 0.2 G/I fat ratio 1.0 ± 0.0E 2.0 ± 0.1 1.0 ± 0.1E 2.1 ± 0.1 n.d. n.d. n.d. n.d. 1.5 ± 0.1D 2.1 ± 0.1 Glucose (mg/dl) 142 ± 6 141 ± 7 190 ± 15 214 ± 20 215 ± 17 221 ± 8 198 ± 8 179 ± 9 213 ± 8 241 ± 17 Insulin (ng/ml) 0.6 ± 0.1 0.4 ± 0.2 3.0 ± 0.8 2.0 ± 0.3 0.8 ± 0.3 0.5 ± 0.3 1.4 ± 0.4 1.0 ± 0.3 2.0 ± 0.4 1.5 ± 0.4 IR index (%) 6.8 ± 0.9 8.0 ± 1.3 25.3 ± 3.1 21.4 ± 2.6 7.3 ± 1.1 9.2 ± 3.2 17.0 ± 5.5 13.5 ± 3.1 23.0 ± 2.6 19.1 ± 3.1 TG (mg/dl) 28 ± 3 29 ± 3 58 ± 6 62 ± 7 53 ± 4 48 ± 4 71 ± 7 54 ± 6 60 ± 8 73 ± 8 Chol (mg/dl) 85 ± 3 79 ± 3 114 ± 7 124 ± 6 113 ± 4 115 ± 4 107 ± 4 96 ± 4 136 ± 5 146 ± 7 FFA (mmol/l) 0.9 ± 0.1 1.0 ± 0.1 1.4 ± 0.1 1.2 ± 0.0 0.9 ± 0.1 0.8 ± 0.1 0.8 ± 0.1 0.8 ± 0.1 1.4 ± 0.0 1.3 ± 0.2 BP (mmHg) 120 ± 3C 111 ± 3 118 ± 3 113 ± 3 120 ± 3C 111 ± 3 120 ± 3C 112 ± 2 122 ± 4 109 ± 5 PR (beats/min) 600 ± 6 583 ± 12 652 ± 10 638 ± 6 623 ± 8 631 ± 8 674 ± 8 670 ± 9 672 ± 15 684 ± 7
AMice were fed a high-fat or high-salt diet for 1 month. BMice were fed a high-fat for 6 months. CP <0.05, DP <0.01, and EP <0.001 between PpargP465L/+
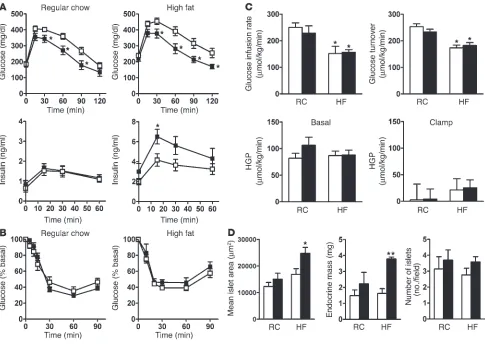
tolerance test (IPGTT). PpargP465L/+ mice cleared glucose faster
than their wild-type littermates did, regardless of diet, indicating improved glucose tolerance in the mutant mice (Figure 3A). This improved glucose tolerance was accompanied by significantly elevated plasma insulin levels (P <0.05 at 15 minutes) during the IPGTTs of PpargP465L/+ mice fed a high-fat diet but not of mice fed
regular chow. The insulin resistance index of PpargP465L/+ mice
cal-culated from the IPGTT was slightly lower in the group fed regular chow but higher in the group fed a high-fat diet than that of wild-type mice (Table 1). However, these differences were not signifi-cant. Consistent with these findings, the intraperitoneal insulin tolerance test (IPITT) revealed that the hypoglycemic response to an acute administration of insulin (0.5 U/kg) was normal in
PpargP465L/+ mice fed regular chow or a high-fat diet (Figure 3B).
To further examine the insulin sensitivity of PpargP465L/+ mice
in vivo, we established a 2-hour hyperinsulinemic-euglycemic
clamp in conscious mice fed regular chow or a high-fat diet for 3 weeks. The rates of glucose infusion required to maintain the euglycemic clamp were not different for PpargP465L/+ mice fed
regular chow compared with their wild-type littermates (Figure 3C). Feeding mice a high-fat diet blunted the insulin response during the clamps to the same extent in both groups, as reflected by their significantly lower but equal steady-state glucose infu-sion rates. Insulin-stimulated whole-body glucose turnover rates were not different in mice of the two genotypes fed regular chow and were similarly reduced after mice were fed a high-fat diet. No genotype effect was observed in insulin-stimulated whole-body glycolysis, glycogen/lipid synthesis (data not shown), and hepatic glucose production (HGP) in basal and clamped states (Figure 3C). These results indicate that the PpargP465L/+ mutation
[image:5.585.47.536.75.433.2]does not alter peripheral or hepatic insulin sensitivity and sug-gest that the increased glucose tolerance of PpargP465L/+ mice is Figure 2
Altered adipose tissue distribution in PpargP465L/+ mice. (A) Body weights of male mice (open squares, wild-type, n =9–10; filled squares, PpargP465L/+, n =9–10) and female mice (open circles, wild-type, n =7–9; filled circles, PpargP465L/+, n =8) fed regular chow (left panel) or a high-fat
diet (right panel). (B) Adipose tissue mass in 10-week-old female wild-type (white bars) and PpargP465L/+ (black bars) mice fed regular chow. Data
are expressed as percent body weights. Gon, Mes, Ret, Ing, and Pec represent gonadal, mesenteric, retroperitoneal, inguinal, and pectoral white adipose tissue, respectively; BAT indicates interscapular BAT. *P <0.05 and **P <0.01, compared with wild-type littermates. (C) Morphology of gonadal and inguinal white adipose and brown adipose tissues from 10-week-old female mice fed regular chow. +/+, wild-type; L/+, PpargP465L/+.
(D) Distribution of cell size in gonadal (left panel), inguinal (middle panel), and retroperitoneal (right panel) adipose tissues. Open circles, wild-type; filled circles, PpargP465L/+. (E) UCP1 mRNA relative to the level of gonadal adipose tissue from wild-type mice. *P <0.05 between PpargP465L/+ and
research article
244 The Journal of Clinical Investigation http://www.jci.org Volume 114 Number 2 July 2004
due mainly to their elevated plasma insulin rather than to an altered insulin sensitivity.
We next examined pancreatic islet morphology. While there was no change in the weight of pancreas (data not shown), the mean islet area and endocrine mass in 4-month-old PpargP465L/+ mice were
both slightly increased in the group fed regular chow and were sig-nificantly increased in the group fed a high-fat diet (Figure 3D). The number of islets was similar in PpargP465L/+ and wild-type mice.
Thus, increased endocrine mass and islet size may be responsible for the observed elevation of plasma insulin levels during glucose overload in PpargP465L/+ mice.
Elevated BP in PpargP465L/+ mice. The P465L mutation in PPARγ
caused a significant increase of about 8 mmHg in the BP of both male and female mice, as measured by a tail cuff method (P <0.01 for genotype effect but not significant for gender effect by two-way ANOVA; Figure 4A). The pulse rates of PpargP465L/+ mice were
not different from those of their wild-type littermates (Table 1). Consistent with the tail-cuff measurements, telemetric BP moni-toring showed higher than average systolic/diastolic BP during the light cycle in the PpargP465L/+ mice (132/94 mmHg versus wild-type
110/82 mmHg) (Figure 4B). BP during the dark cycle was simi-larly elevated in PpargP465L/+ mice (144/103 mmHg versus wild-type
124/95 mmHg) (Figure 4B). Thus, the diurnal rhythm of BP is maintained in PpargP465L/+ mice and the elevation of their BP in the
active phase is not disproportionate.
Because PPARγ is expressed in the renal medulla (23), we next examined the possibility that PpargP465L/+ mice may have abnormal
salt and water reabsorption in the kidney and may display salt-sensitive hypertension. Feeding mice a high-salt diet containing 8% NaCl for 4 weeks did not change the BP of either PpargP465L/+
[image:6.585.50.535.81.426.2]or wild-type mice, and the genotype effect on BP was maintained (Figure 4C). We further tested the salt sensitivity of PpargP465L/+ Figure 3
Increased glucose tolerance but normal insulin sensitivity in PpargP465L/+ mice. (A) Plasma glucose and insulin levels during the IPGTT in 14-
to 16-week-old male mice fed regular chow (left panels; n =15–16) or a high-fat diet (right panels; n =7–11). Open squares, wild-type; filled squares, PpargP465L/+. *P <0.05 versus wild-type. (B) IPITTs of 14- to 16-week-old female mice fed regular chow (left panel; n =7–8) or a high-fat
diet (right panel; n =6–7). Open squares, wild-type; filled squares, PpargP465L/+. Data are expressed as the percentage of the plasma glucose
before insulin injection. (C)Whole-body metabolic parameters during the hyperinsulinemic-euglycemic clamp experiment. Steady-state glucose infusion rates (top left) and insulin-stimulated whole-body glucose turnover rates (top right) were obtained for 10- to 12-week-old male mice fed regular chow (RC; n =5) or a high-fat diet (HF; n =5–8). White bars, wild-type; black bars, Pparg465L/+. *P <0.05 for diet effect. Basal (bottom left)
and clamped (bottom right) rates of HGP in wild-type (white bars) and Pparg465L/+ (black bars) mice fed regular chow (RC; n =5) or a high-fat diet
mice during the immediate adaptation to an increased dietary salt load before homeostatic adjustments take place. Changes in daily food consumption were not different, indicating mice had the same salt intake. Urinary sodium excretion was increased consider-ably on initiation of high-salt feeding. However, the daily sodium excretion as well as 4-day cumulative sodium excretion after ini-tiation of the high-salt diet was not different between mice of the two genotypes. Thus PpargP465L/+ mice have normal salt and water
handling in the kidney and the elevation of BP in PpargP465L/+ mice
is not salt sensitive.
Because the RAS plays a crucial role in the maintenance of BP, we measured the steady-state mRNA levels of genes of the RAS. The mRNA levels for AGT, renin, and aldosterone synthase (AS) in the liver, kidney, and adrenal gland, the major sites of their expres-sion, respectively, were not affected by the presence of the P465L
mutation (Figure 4D). PPARγ
activators have been shown to transcriptionally suppress the angiotensin II type I receptor (AT1R) (24), but we found that the AT1R mRNA levels in kidney were not different in PpargP465L/+
versus wild-type mice. Con-sistent with the mRNA levels, plasma renin concentration (42 ± 13 ng of angiotensin I/ml/ h in PpargP465L/+ versus 44 ± 14 in
wild-type; P =0.89), plasma AGT levels (equivalent to 622 ± 7 ng of angiotensin I/ml in PpargP465L/+
versus 608 ± 20 in wild-type; P =0.50), and plasma aldosterone (426 ± 73 pg/ml in PpargP465L/+
versus 408 ± 79 in wild-type;
P =0.87) concentrations were not different between mice of the two genotypes. Thus, the sys-temic RAS does not appear to be altered in P465L PPARγ –medi-ated hypertension.
Adipose tissue also produces and secretes vasoactive precursor substances including AGT, which may contribute to the devel-opment of hypertension (17). Expression of the gene encoding for renin in both gonadal and inguinal adipose tissues was low and was not significantly differ-ent in mice of the two genotypes (Figure 4D). The mRNA levels for angiotensin II type II recep-tor (AT2R), which is reported to antagonize AT1R by inducing vasodilation and inhibiting cell growth and proliferation (25), were not different in mice of the two genotypes. In contrast, the level of AGT mRNA in the ingui-nal fat of PpargP465L/+ mice was 2.5
times that of wild-type mice (P <0.05). The level of AGT mRNA in the gonadal fat of PpargP465L/+ mice was not different from that
of wild-type mice. Conversely, a significant increase in the AT1R gene expression was observed in the gonadal fat (2.1× wild type,
P <0.005) but not in the inguinal fat of PpargP465L/+ mice. Thus the
genes of the RAS are altered in adipose tissues of PpargP465L/+ mice
in a depot-specific fashion. These data suggest that the elevated BP of PpargP465L/+ mice could be affected by changes in the local RAS of
adipose tissues.
[image:7.585.48.407.80.414.2]Effects of age, diet, and gender. Diets containing high fat as well as aging are known to affect weight gain, fat deposition, and insulin sensitivity, which could ultimately affect BP. We therefore examined the phenotypes of mice at 9 months of age that were either main-tained on regular chow or fed a high-fat diet for 22 weeks (Table 1). We found significant age and diet effects on body weight, fat mass,
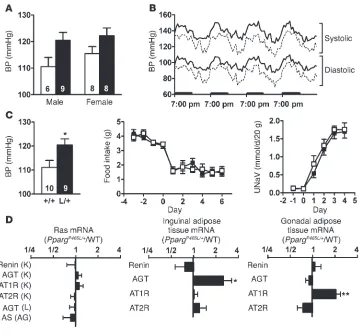
Figure 4
Elevated BP in PpargP465L/+ mice. (A) BP of 14- to 16-week-old wild-type (white bars) and PpargP465L/+
(black bars) mice by tail-cuff measurement. Numbers of mice are inside bars. P <0.01 for genotype effect by ANOVA. (B) Four-day telemetric recordings of systolic and diastolic BP in 24-week-old female mice. Results are expressed as mean of four wild-type (dashed lines) and four PpargP465L/+ (solid lines) mice
averaged with 12 values each hour. Bolded bars on the x axis represent the dark cycles. (C) Responses to changes in dietary salt intake. BP of 14- to 16-week-old male wild-type (white bar) and PpargP465L/+
(black bar) mice fed a high-salt diet for 4 weeks (left panel). Numbers inside bars indicate sample size. *P <0.05. Changes in daily food consumption (middle panel) and urinary sodium excretion (UNaV; right panel) after mice were switched to a high-salt diet at day 0 for 10- to 12-week-old male wild-type (open squares, n =7) and PpargP465L/+ (filled squares, n =6) mice. (D) Relative ratio of the expression of RAS
genes in PpargP465L/+ mice to those in wild-type mice (n =16 each). Left panel, organs of major RAS
research article
246 The Journal of Clinical Investigation http://www.jci.org Volume 114 Number 2 July 2004
plasma glucose, and insulin, and insulin resistance index, but the changes induced by diet and age were similar in both PpargP465L/+
and wild-type mice. Neither age nor diet influenced BP. Except for the hyperinsulinemic clamp experiments, which were done only in male mice, we studied both male and female mice. The P465L effects on BP, fat distribution, and insulin sensitivity were the same in both male and female mice without any interaction between gen-der and genotype by ANOVA.
Discussion
To establish a causative link between the PPARγ P467L mutation and the observed phenotypes in humans, we introduced the same mutation into the comparable mouse gene and assessed effects of the mutation on the metabolic state of the mice. We found the mutant mice recapitulated the hypertension phenotype and dis-played abnormal fat distribution, but showed normal insulin sen-sitivity. A comparison of the phenotypes of PpargP465L/+ mice with
those of human patients (6, 11) and heterozygous PPARγ knock-out (Pparg+/–) mice (5, 26, 27) is summarized in Table 2.
The P467L mutation was originally identified in patients with severe insulin-resistant type 2 diabetes (11). Unlike human patients, however, PpargP465L/+ mice maintained normal blood
glu-cose and insulin levels and achieved better gluglu-cose homeostasis without significant changes in insulin sensitivity. Furthermore, the hyperinsulinemic-euglycemic clamp experiment in PpargP465L/+
mice showed normal insulin sensitivity in peripheral tissues and liver, ruling out the possibility of insulin resistance. Although aging and diet have various effects on mice, 9-month-old (Table 1) and 12-month-old (data not shown) PpargP465L/+ mice were no more
insulin resistant than were wild-type mice, even when they were fed a high-fat diet for 6 months. Genetic background also plays an
important role in the severity of insulin resistance in mice (28, 29). However, because the F1 animals in our experiments were
gener-ated from two inbred lines, they are genetically identical except for proline or leucine at position 465 of PPARγ. Consequently, any phenotypic differences between them are directly attribut-able to this substitution. Thus, the normal insulin sensitivity of
PpargP465L/+ mice demonstrates unequivocally that this mutation is
not sufficient by itself to cause insulin resistance in mice.
This contrasts markedly with the severe insulin resistance observed in humans with the equivalent mutation. It is unlikely that the basic function of PPARγ differs between the two species. Conceivably, however, some undetermined modifier(s) of the phe-notype may inherently differ in these two species. This possibil-ity receives some support from the identification by Savage et al. of human patients with severe insulin resistance who are doubly heterozygous for frameshift mutations in one allele of the gene coding for PPARγ and for muscle-specific regulator subunit of pro-tein phosphatase-1 (30). Both frameshifts cause premature stop and loss of function in the proteins, but individuals heterozygous for only one of these mutations are normal. This digenic inheri-tance suggests that a decreased level of PPARγ expression is insuf-ficient by itself to cause insulin resistance, but it can do so when accompanied by a difference in the expression of a second gene.
The PpargP465L/+ mice fed a high-fat diet had elevated insulin
lev-els, accompanied by less-pronounced elevation of blood glucose, in response to acute glucose overload. The observed expansion of pancreatic islets in PpargP465L/+ mice parallels the increased plasma
insulin concentration and likely contributes to their better glucose responsiveness. Interestingly, the feature of elevated insulin levels, with occurrence of lower glucose curves during the IPGTT and normal insulin sensitivity, is similar to that seen in Ucp2–/– mice
(31) and pancreatic β cell–specific overexpression of Akt1 (32). The functions of these gene products are known to be influenced by PPARγ agonists (33). The mechanism underlying the pancreatic islet function in PpargP465L/+ mice requires further investigation.
Patients with the P467L mutation have partial lipodystrophy, as indicated by a loss of fat in subcutaneous depots in the limbs and buttocks but preserved visceral and abdominal subcutaneous fat (6). The lipodystrophy associated with PPARγ mutations in humans is variable, however. For example, an individual with an R425C muta-tion in PPARγ has marked loss of subcutaneous fat from extremities with excess subcutaneous fat in the trunk (7). The F388L mutation in a three-generation Canadian kindred is associated with atrophy in gluteal fat and an accumulation of subcutaneous facial, supra-scapular, and abdominal fat (8). Although our PpargP465L/+ mice
demonstrate a causative link between the P465L mutation and body fat distribution, PpargP465L/+ mice, unlike human patients,
preferentially distribute fat toward extra-abdominal subcutaneous fat depots. Intra-abdominal adipose tissue has been suggested to play an important role in the pathogenesis of type 2 diabetes (34). The altered adipose tissue distribution away from visceral depots in
PpargP465L/+ mice may potentially prevent these mice from developing
insulin resistance and may provide a possible explanation for the species discordance in metabolic sequelae. Intriguingly, the redistri-bution of body fat from the visceral to the subcutaneous depot in
PpargP465L/+ mice differs from the generalized reduction in fat tissue
and body weight reported in Pparg+/– mice (5) (Table 2) but is
simi-lar to that seen in humans or rodents treated with PPARγ agonists (35–37). The altered fat distribution in PpargP465L/+ mice is likely to
[image:8.585.52.274.139.355.2]be a consequence of effects more complex than those caused by a
Table 2
Phenotypes of humans heterozygous for P467L PPARγ, mice heterozygous for P465L PPARγ, and mice heterozygous for PPARγ knockout
Humans Mice
Mutation P467L/+ P465L/+ +/–
Body weight ↔ ↔ ↓
Body temperature ↔ ↔ ↑
Blood pressure ↑ ↑ ↔
Insulin sensitivity ↓ ↔ ↑
Plasma insulin ↑ Mildly ↑ ↓
GTT Intolerant Tolerant Tolerant
ITT Resistant ↔ Sensitive
Euglycemic clamp Resistant ↔ Sensitive Fat mass alteration Partial Redistribution General reduction reduction
Intra-abdominal fat ↔ ↓ ↓
Sub. abdominal fat ↔ ↑ ↓
Sub. peripheral fat ↓ n.d. n.d.
Dyslipidemia Yes No No
Plasma cholesterol ↔ ↔ ↔
HDL cholesterol ↓ ↔ ↔
Plasma triglyceride ↑ ↔ ↔
References (6, 11) (5, 26, 27)
simple reduction in PPARγ expression. For example, mutant PPARγ
may sequester RXRα and other cofactors in a dominant negative fashion and exert effects different from those resulting from a sim-ple reduction in PPARγ.
Our results obtained with PpargP465L/+ mice demonstrate that
vis-ceral fat and subcutaneous fat are biologically distinct and suggest that the roles of PPARγ may differ in different depots. Considerable evidence of marked differences in gene expression between visceral and subcutaneous fats also support the idea of intrinsic differences between visceral and subcutaneous adipose cells (38, 39). Given that the transcriptional activity of PPARγ is mediated by complex interac-tions with cofactors, heterodimeric RXR, and ligands, depot-specific differences in their availability likely influence the sensitivity to and dependency on PPARγ action in different adipose tissues. Consistent with this, the P465L mutation exerted depot-specific effects on gene expression. The selectively increased expression of LPL in inguinal adipose tissue promotes the delivery of FFA into the inguinal depot. The decreased expression of aP2 and Glut4 in gonadal adipose tis-sue limits fuel uptake and storage by intra-abdominal fat depot. Combined alterations in PPARγ target genes may account for the partition of lipid preferentially to extra-abdominal subcutaneous fat rather than to the intra-abdominal fat depot in PpargP465L/+ mice.
A majority of human diabetics suffer from both hyperglycemia and mild hypertension (40), and enhanced insulin sensitivity is associated with lower BP both in diabetic animals (41) and humans (19). The PPARγ agonist TZD has an antihypertensive effect that may result from a concurrent improvement in insulin sensitivity (19, 41). However, PpargP465L/+ mice are hypertensive from a young
age without being insulin resistant, and the genotype effect on BP persists regardless of age or diet. Thus, PPARγ must have a role in BP regulation that is distinct from and independent of its role in the regulation of insulin sensitivity.
BP is ultimately determined by the filtration of blood in kidney glomeruli and the reabsorption of the filtrate in renal tubules. In the kidney, PPARγ is expressed mainly in the inner medulla (23), where sodium and water reabsorption takes place. However, our data indicate that the elevated BP of PpargP465L/+ mice is not salt
sensitive, suggesting that the role of PPARγ in the renal medulla on hypertension is not significant, at least in conditions we tested. No detectable increase in the systemic and kidney RAS is consis-tent with the absence of salt sensitivity. These results exclude the possibility of increased salt and water reabsorption in the kidney as a mechanism of hypertension in PpargP465L/+ mice. Given that
PPARγ is expressed in vasculature (20–22), further studies are nec-essary to determine the underlying mechanisms that affect BP in
PpargP465L/+ mice, including potential involvement of PPARγ in the
maintenance of vascular tone.
Adipose tissue is now recognized as an important endocrine organ that expresses genes encoding a large variety of bioactive molecules. Transgenic mice expressing AGT in adipose tissue have higher BP and increased fat mass (17). Our data show that the P465L mutation selectively increases expression of AGT in inguinal fat and of AT1R in gonadal fat, but does not affect expression of AGT in gonadal fat and of AT1R in inguinal fat. Angiotensin II (ATII) has been shown to act as a potent growth factor and plays a role in adipogenic growth and differentiation (15). The balance between the two ATII receptors, AT1R and AT2R, may influence adipocyte hypertrophy and adipose tissue hyperplasia (15).This raises the possibility that in the absence of proper adipogenesis mediated by PPARγ, other default pathways, including the paracrine action of ATII, can help maintain
differen-tiation of preadipocytes into mature adipocytes and/or hypertrophy of differentiated adipocytes. It is thus tempting to speculate that the increased RAS action in adipose tissues may in turn contribute to the elevated BP of PpargP465L/+ mice by influencing the secretion of
adipocytokines even if the adipose RAS does not directly affect the systemic RAS. Clearly, the mechanism underlying the differential regulations of AGT and AT1R in inguinal and gonadal adipose tis-sues in PpargP465L/+ mice merits further studies.
In conclusion, our PpargP465L/+ mice provide genetic evidence for
an important link between PPARγ and the regulation of BP and fat distribution that is independent of any alteration in insulin sensitivity. Like human patients, PpargP465L/+ mice are hypertensive.
The mutation alters body fat storage in both human and mice, although the pattern of fat distribution in mice differs from that in humans. Finally, unlike human patients, PpargP465L/+ mice are
not insulin resistant. These similarities and differences in the phe-notypes caused by an identical mutation in two species provide an opportunity to further dissect the role of PPARγ in the pathogen-esis of the metabolic syndrome.
Methods
Generation of mice with the P465L mutation in PPARγ. A missense mutation in the mouse Pparg gene that replaces proline (CCC) at position 465 in exon 6 with leucine (CTG) was produced by PCR-based site-directed mutagenesis. This fragment was cloned into the targeting vector, which contains a 6.5-kb XhoI/XbaI 5′
homology fragment, the ACN (testis-specific Ace promoter, Cre recombinase, and Neo-resistance gene) cassette (42), a 1.3-kb
XbaI/StuI 3′ homology fragment, and a thymidine kinase gene. Electroporation of the NotI-linearized vector into 129/SvEv ES cells (TC-1) and selection with G418 and ganciclovir were per-formed as described (43). ES cell clones with a successfully tar-geted Pparg locus were identified by PCR and confirmed by South-ern blot analysis. Six male chimeras generated from targeted ES cells transmitted the mutated Pparg allele through the germline, and the lines were maintained on 129/SvEv genetic background. Studies were carried out using both male and female F1 offspring
(129/SvEv and C57BL/6) that were heterozygous and wild-type for PPARγ. Mice were fed ad libitum either a regular chow diet (LabDiet 5P76; PMI Nutrition International, Richmond, Indiana, USA) or a high-fat diet (58% of calories as fat and 26% as carbo-hydrate; D12330; Research Diets, New Brunswick, New Jersey, USA). Animals were handled following procedures approved by the Institutional Animal Care and Use Committees.
Culture of adipose tissue explants. Gonadal fat pads were removed from mice at 8 weeks of age (n =4 each), cut into pieces 0.2–0.3 cm3
in size, and agitated for 30 minutes in DMEM (Cellgro, Herndon, Virginia, USA) supplemented with 1% BSA. Tissues were washed in PBS and were incubated at 37°C in six-well plates containing 3 ml of DMEM supplemented with 10% FBS (Atlanta Biologicals, Norcross, Georgia, USA), 100 IU/ml penicillin, 100 µg/ml strep-tomycin (Sigma-Aldrich, St. Louis, Missouri, USA), and various concentrations of rosiglitazone (Cayman Chemical, Ann Arbor, Michigan, USA) (44). After 6 h, tissues were collected and stored in RNAlater (Ambion, Austin, Texas, USA) for RNA analysis.
RNA analysis. Tissue RNA from 8- to 10-week-old mice was extracted using the RNAeasy kit (Qiagen, Valencia, California, USA), and mRNA was analyzed with TaqMan (Applied Biosystems, Foster City, California, USA) real-time quantitative RT-PCR, with
research article
248 The Journal of Clinical Investigation http://www.jci.org Volume 114 Number 2 July 2004
Morphological analysis. Paraffin sections (6–10 µm in thickness) of adipose tissues isolated from female mice (n =4 each) at 10 weeks of age were cut and stained with H&E. Adipocyte size was measured in 500 cells per mouse in several parts of the gonadal, inguinal, retroperitoneal, mesenteric, and pectoral fat pads using NIH Image. Pancreatic islet morphometry was analyzed using 14- to 16-week-old male mice fed either regular chow or a high-fat diet (D12330) for 4 weeks. Serial paraffin sections 5
µm in thickness from five different levels of pancreas (100 µm apart) were stained with H&E. The mean islet area and endo-crine mass were morphometrically determined by using four overlapping images (45).
IPGTT and IPITT. After mice had fasted for 5 h, they were injected intraperitoneally with glucose (1 g/kg) or insulin (Humulin; 0.5 U/ kg; Eli Lilly, Indianapolis, Indiana, USA). For the high-fat group, mice were fed a high-fat diet (D12330) for 4 or 22 weeks, beginning at 12 weeks of age. Blood was collected before and at indicated times after injections, as shown in Figures 3A and 3B. Plasma levels of glucose, total cholesterol, triglyceride, and FFA were determined using the appropriate reagent kits (Sigma-Aldrich). Insulin con-centration was measured with rat insulin ELISAs (Crystal Chemi-cal, Chicago, Illinois, USA). The insulin resistance index was cal-culated as the product of the areas under the glucose and insulin curves in the IPGTT as previously described (46).
Hyperinsulinemic-euglycemic clamp. After an overnight fast, a 2-hour hyperinsulinemic-euglycemic clamp was established with primed-continuous infusion of insulin (15 pmol/kg/min; Humulin) and [3-3H]glucose (0.1 µCi/min; NEN, Boston, Massachusetts, USA) in
10- to 12-week-old male mice. Whole-body glucose turnover and glucose metabolic flux in PpargP465L/+ mice (n =5) and wild-type
littermates (n =5) were assessed as described previously (47). The effects of diet-induced alteration on insulin sensitivity were exam-ined in PpargP465L/+ mice (n =8) and wild-type littermates (n =5) fed
a high-fat diet (55% of calories from fat and 7% from sucrose; TD 93075; Harlan Teklad, Madison, Wisconsin, USA) for 3 weeks.
BP measurements. BP and pulse rate were measured by the tail-cuff method and were calculated as the average from three trials of five to ten measurements each day for 6 consecutive days (48). For continuous BP recording, a PA-C20 telemetric device (Data
Sci-ences, St. Paul, Minnesota, USA) was implanted via the left carotid artery into the aortae of 24-week-old mice (49). Continuous BPs were recorded every 5 minutes for 14 days beginning 10 days after surgery to allow mice to regain normal diurnal rhythms.
Salt loading. Mice were fed a high-salt diet (8% NaCl; TD 92012; Harlan Teklad) for 4 weeks, beginning at 10 weeks of age, and BP was measured by the tail-cuff method. Sodium balance dur-ing changes in dietary salt intake was assessed in mice housed in metabolic cages and fed a normal salt diet (0.7% NaCl; LabDiet 5P76) for 7 days followed by a high-salt diet (8% NaCl; TD 92012) for 7 days. Body weight, food and water intake, urine output, and urinary sodium excretion were measured each day (50).
Data analysis. Values are reported as mean ± SEM. Statistical analysis was conducted using multifactorial ANOVA with geno-type, gender, age, and diet as factors. Student’s t test was used for comparisons between mutant and wild-type within each group, and differences were considered to be statistically significant with
P values less than0.05.
Acknowledgments
We thank L. James, K. Caron, M. Kakoki, R. Coleman, J. Harp, K. Brown, C. Ammala, C.-J. Edgell, and O. Smithies for discussion and critical reading of the manuscript; R. Bagnell for assistance with microscopy and imaging; and S. Hiller, K. Kluckman, C. Wil-helm, L. Xu, E. Riggs, and A. Staton for technical assistance. The hyperinsulinemic-euglycemic clamp experiment was conducted at the NIH-Yale Mouse Metabolic Phenotyping Center. This work was supported by grants from the NIH (HL42630, HL70523 [N. Maeda], and DK 59635 [J.K. Kim]) the American Heart Association (0215270U [Y.S. Tsai]), and the American Diabetes Association (7-01-JF-05 [J.K. Kim]).
Received for publication January 5, 2004, and accepted in revised form May 20, 2004.
Address correspondence to: Nobuyo Maeda, 710 Brinkhous-Bul-litt Building, University of North Carolina, Chapel Hill, North Carolina 27599, USA. Phone: (919) 966-6914; Fax: (919) 966-8800; E-mail: [email protected].
1. Reaven, G.M. 1988. Role of insulin resistance in human disease. Diabetes. 37:1595–1607. 2. Berger, J., and Moller, D.E. 2002. The mechanisms
of action of PPARs. Annu. Rev. Med. 53:409–435. 3. Tontonoz, P., Hu, E., and Spiegelman, B.M. 1994.
Stimulation of adipogenesis in fibroblasts by PPAR gamma 2, a lipid-activated transcription factor.
Cell. 79:1147–1156.
4. Barak, Y., et al. 1999. PPAR gamma is required for placental, cardiac, and adipose tissue development.
Mol. Cell. 4:585–595.
5. Kubota, N., et al. 1999. PPAR gamma mediates high-fat diet-induced adipocyte hypertrophy and insulin resistance. Mol. Cell. 4:597–609.
6. Savage, D.B., et al. 2003. Human metabolic syn-drome resulting from dominant-negative mutations in the nuclear receptor peroxisome proliferator-acti-vated receptor-gamma. Diabetes. 52:910–917. 7. Agarwal, A.K., and Garg, A. 2002. A novel
heterozygous mutation in peroxisome proliferator-activated receptor-gamma gene in a patient with familial partial lipodystrophy. J. Clin. Endocrinol. Metab. 87:408–411.
8. Hegele, R.A., Cao, H., Frankowski, C., Mathews, S.T., and Leff, T. 2002. PPARG F388L, a transactivation-deficient mutant, in familial partial lipodystrophy.
Diabetes. 51:3586–3590.
9. Deeb, S.S., et al. 1998. A Pro12Ala substitution in PPARgamma2 associated with decreased receptor activity, lower body mass index and improved insu-lin sensitivity. Nat. Genet. 20:284–287.
10. Ristow, M., Muller-Wieland, D., Pfeiffer, A., Krone, W., and Kahn, C.R. 1998. Obesity associated with a mutation in a genetic regulator of adipocyte dif-ferentiation. N. Engl. J. Med.339:953–959. 11. Barroso, I., et al. 1999. Dominant negative
muta-tions in human PPARgamma associated with severe insulin resistance, diabetes mellitus and hypertension. Nature. 402:880–883.
12. Stamler, R., Stamler, J., Riedlinger, W.F., Algera, G., and Roberts, R.H. 1978. Weight and blood pres-sure. Findings in hypertension screening of 1 mil-lion Americans. JAMA. 240:1607–1610. 13. Bonora, E., et al. 1998. Prevalence of insulin
resis-tance in metabolic disorders: the Bruneck Study.
Diabetes. 47:1643–1649.
14. Ginsberg, H.N. 2000. Insulin resistance and cardio-vascular disease. J. Clin. Invest. 106:453–458. 15. Engeli, S., Negrel, R., and Sharma, A.M. 2000.
Physiology and pathophysiology of the adipose tissue renin-angiotensin system. Hypertension. 35:1270–1277.
16. Hainault, I., et al. 2002. Adipose tissue-specific increase in angiotensinogen expression and secre-tion in the obese (fa/fa) Zucker rat. Am. J. Physiol. Endocrinol. Metab. 282:E59–E66.
17. Massiera, F., et al. 2001. Adipose angiotensinogen is involved in adipose tissue growth and blood pressure regulation. FASEB J. 15:2727–2729. 18. Dubey, R.K., Zhang, H.Y., Reddy, S.R., Boegehold,
M.A., and Kotchen, T.A. 1993. Pioglitazone atten-uates hypertension and inhibits growth of renal arteriolar smooth muscle in rats. Am. J. Physiol. 265:R726–R732.
19. Ogihara, T., Rakugi, H., Ikegami, H., Mikami, H., and Masuo, K. 1995. Enhancement of insulin sensi-tivity by troglitazone lowers blood pressure in dia-betic hypertensives. Am. J. Hypertens. 8:316–320. 20. Marx, N., Schonbeck, U., Lazar, M.A., Libby, P., and
Plutzky, J. 1998. Peroxisome proliferator-activated receptor gamma activators inhibit gene expression and migration in human vascular smooth muscle cells. Circ. Res. 83:1097–1103.
22. Marx, N., Bourcier, T., Sukhova, G.K., Libby, P., and Plutzky, J. 1999. PPARgamma activation in human endothelial cells increases plasminogen activa-tor inhibiactiva-tor type-1 expression: PPARgamma as a potential mediator in vascular disease. Arterioscler. Thromb. Vasc. Biol. 19:546–551.
23. Yang, T., et al. 1999. Expression of peroxisomal pro-liferator-activated receptors and retinoid X recep-tors in the kidney. Am. J. Physiol. 277:F966–F973. 24. Takeda, K., et al. 2000. Peroxisome
proliferator-activated receptor gamma activators downregulate angiotensin II type 1 receptor in vascular smooth muscle cells. Circulation. 102:1834–1839. 25. Matsubara, H. 1998. Pathophysiological role of
angiotensin II type 2 receptor in cardiovascular and renal diseases. Circ. Res. 83:1182–1191.
26. Miles, P.D., Barak, Y., He, W., Evans, R.M., and Olef-sky, J.M. 2000. Improved insulin-sensitivity in mice heterozygous for PPAR-gamma deficiency. J. Clin. Invest. 105:287–292.
27. Asakawa, M., et al. 2002. Peroxisome proliferator-activated receptor gamma plays a critical role in inhibition of cardiac hypertrophy in vitro and in vivo. Circulation. 105:1240–1246.
28. Kulkarni, R.N., et al. 2003. Impact of genetic background on development of hyperinsulinemia and diabetes in insulin receptor/insulin receptor substrate-1 double heterozygous mice. Diabetes. 52:1528–1534.
29. Kido, Y., Philippe, N., Schaffer, A.A., and Accili, D. 2000. Genetic modifiers of the insulin resistance phenotype in mice. Diabetes. 49:589–596. 30. Savage, D.B., et al. 2002. Digenic inheritance of
severe insulin resistance in a human pedigree. Nat. Genet. 31:379–384.
31. Zhang, C.Y., et al. 2001. Uncoupling protein-2 nega-tively regulates insulin secretion and is a major link between obesity, beta cell dysfunction, and type 2
diabetes. Cell. 105:745–755.
32. Tuttle, R.L., et al. 2001. Regulation of pancreatic beta-cell growth and survival by the serine/threo-nine protein kinase Akt1/PKBalpha. Nat. Med. 7:1133–1137.
33. Medvedev, A.V., Snedden, S.K., Raimbault, S., Ric-quier, D., and Collins, S. 2001. Transcriptional reg-ulation of the mouse uncoupling protein-2 gene. Double E-box motif is required for peroxisome proliferator-activated receptor-gamma-dependent activation. J. Biol. Chem. 276:10817–10823. 34. Montague, C.T., and O’Rahilly, S. 2000. The perils
of portliness: causes and consequences of visceral adiposity. Diabetes. 49:883–888.
35. Kelly, I.E., Han, T.S., Walsh, K., and Lean, M.E. 1999. Effects of a thiazolidinedione compound on body fat and fat distribution of patients with type 2 diabetes. Diabetes Care. 22:288–293.
36. Arioglu, E., et al. 2000. Efficacy and safety of tro-glitazone in the treatment of lipodystrophy syn-dromes. Ann. Intern. Med. 133:263–274.
37. Laplante, M., et al. 2003. PPAR-gamma activation mediates adipose depot-specific effects on gene expression and lipoprotein lipase activity: mecha-nisms for modulation of postprandial lipemia and differential adipose accretion. Diabetes. 52:291–299. 38. Montague, C.T., et al. 1998. Depot-related gene
expression in human subcutaneous and omental adipocytes. Diabetes. 47:1384–1391.
39. Atzmon, G., et al. 2002. Differential gene expres-sion between visceral and subcutaneous fat depots.
Horm. Metab. Res. 34:622–628.
40. Ferrari, P., and Weidmann, P. 1990. Insulin, insu-lin sensitivity and hypertension. J. Hypertens. 8:491–500.
41. Walker, A.B., Chattington, P.D., Buckingham, R.E., and Williams, G. 1999. The thiazolidinedione rosi-glitazone (BRL-49653) lowers blood pressure and
protects against impairment of endothelial func-tion in Zucker fatty rats. Diabetes. 48:1448–1453. 42. Bunting, M., Bernstein, K.E., Greer, J.M.,
Capec-chi, M.R., and Thomas, K.R. 1999. Targeting genes for self-excision in the germ line. Genes Dev. 13:1524–1528.
43. Piedrahita, J.A., Zhang, S.H., Hagaman, J.R., Oliver, P.M., and Maeda, N. 1992. Generation of mice car-rying a mutant apolipoprotein E gene inactivated by gene targeting in embryonic stem cells. Proc. Natl. Acad. Sci. U. S. A. 89:4471–4475.
44. Glorian, M., et al. 2001. A single element in the phosphoenolpyruvate carboxykinase gene mediates thiazolidinedione action specifically in adipocytes.
Biochimie. 83:933–943.
45. Pende, M., et al. 2000. Hypoinsulinaemia, glucose intolerance and diminished beta-cell size in S6K1-deficient mice. Nature. 408:994–997.
46. Yamauchi, T., et al. 2001. The fat-derived hormone adiponectin reverses insulin resistance associ-ated with both lipoatrophy and obesity. Nat. Med. 7:941–946.
47. Kim, J.K., et al. 2000. Redistribution of substrates to adipose tissue promotes obesity in mice with selective insulin resistance in muscle. J. Clin. Invest. 105:1791–1797.
48. Krege, J.H., Hodgin, J.B., Hagaman, J.R., and Smith-ies, O. 1995. A noninvasive computerized tail-cuff system for measuring blood pressure in mice.
Hypertension. 25:1111–1115.
49. Butz, G.M., and Davisson, R.L. 2001. Long-term telemetric measurement of cardiovascular param-eters in awake mice: a physiological genomics tool.
Physiol. Genomics. 5:89–97.