A calpain-10 gene polymorphism is associated
with reduced muscle mRNA levels and insulin
resistance
Leslie J. Baier, … , Graeme I. Bell, Clifton Bogardus
J Clin Invest.
2000;
106(7)
:R69-R73.
https://doi.org/10.1172/JCI10665
.
Previous linkage studies in Mexican-Americans localized a major susceptibility locus for
type 2 diabetes, NIDDM1, to chromosome 2q. This evidence for linkage to type 2 diabetes
was recently found to be associated with a common G
®
A polymorphism (UCSNP-43)
within the
CAPN10
gene. The at-risk genotype was homozygous for the UCSNP-43 G
allele. In the present study among Pima Indians, the UCSNP-43 G/G genotype was not
associated with an increased prevalence of type 2 diabetes. However, Pima Indians with
normal glucose tolerance, who have a G/G genotype at UCSNP-43, were found to have
decreased rates of postabsorptive and insulin-stimulated glucose turnover that appear to
result from decreased rates of glucose oxidation. In addition, G/G homozygotes were found
to have reduced
CAPN10
mRNA expression in their skeletal muscle. A decreased rate of
insulin-mediated glucose turnover, or insulin resistance, is one mechanism by which the
polymorphism in
CAPN10
may increase susceptibility to type 2 diabetes mellitus in older
persons.
Rapid Publication
Introduction
Type 2 diabetes mellitus is a metaboli-cally complex disease with major genet-ic determinants (1). Linkage studies in Mexican-American affected sib pairs living in Starr County, Texas, localized a major susceptibility locus for type 2 diabetes, NIDDM1, to chromosome band 2q37.3 (2). The CAPN10 gene, which encodes calpain-10, a nonlyso-somal cysteine protease expressed in many tissues, including skeletal mus-cle, liver, and pancreas, was positional-ly cloned within the NIDDM1 region (3). UCSNP-43, a common G→A tran-sition within intron 3 of the CAPN10 gene, was associated with the evidence for linkage in the NIDDM1 region in Mexican-American sib pairs concor-dant for the at-risk genotype (G/G)(3).
The Pima Indians of Arizona have the world’s highest reported inci-dence and prevalence of type 2 dia-betes mellitus (4). Their diadia-betes is prototypic of this disease and is char-acterized by obesity, insulin resist-ance, insulin secretory dysfunction, and increased rates of endogenous glucose production (5). In prospective studies of prediabetic Pima Indians, insulin resistance and insulin secre-tory dysfunction are major predictors of the disease, whereas increased rates of endogenous glucose production are not (6). Insulin resistance results, in part, from obesity, but some deter-minants of impaired insulin action are independent of fatness (7). These determinants aggregate in families (8), indicative of genetic effects.
Vari-ation in insulin secretion, independ-ent of body fatness and insulin action, also aggregates in families (9). In this study we investigated whether these familial prediabetic metabolic abnormalities are associated with, and therefore may result from, variation at UCSNP-43. Results of clinical studies on full-heritage Pima Indians, or closely related Tohono O’Odham Indians, who have been part of our ongoing longitu-dinal and prospective studies of the eti-ology of type 2 diabetes mellitus, were analyzed. Tests included measures of body composition, a 75-g oral tolerance test, an intravenous glucose-tolerance test to determine the acute insulin response as a measure of insulin secretory function, and measures of postabsorptive glucose appearance and insulin-stimulated glucose-disappear-ance rates using the euglycemic insulin clamp technique with simultaneous indirect calorimetry to estimate insulin action on total glucose disposal and oxi-dation. Most individuals were also stud-ied in a respiratory chamber for 24 hours to measure sleeping and 24-hour rates of energy expenditure, as well as substrate oxidation rates, while eating a weight-maintaining diet. Only data from people with normal glucose toler-ance (10) were analyzed since deteriora-tion to impaired glucose tolerance or diabetes is associated with secondary changes in insulin secretory function and glucose metabolism due to
increas-A calpain-10 gene polymorphism is associated
with reduced muscle mRNA levels and
insulin resistance
Leslie J. Baier,
1Paskasari A. Permana,
1Xiaolin Yang,
1Richard E. Pratley,
1Robert L. Hanson,
1Gong-Qing Shen,
1David Mott,
1William C. Knowler,
1Nancy J. Cox,
2,3Yukio Horikawa,
4Naohisa Oda,
2Graeme I. Bell,
2,3,4and Clifton Bogardus
11Phoenix Epidemiology and Clinical Research Branch, National Institute of Diabetes and Digestive and Kidney Diseases,
NIH, Phoenix, Arizona, USA
2Department of Medicine,
3Department of Human Genetics, and
4Howard Hughes Medical Institute and Department of Biochemistry and Molecular Biology, The University of Chicago,
Chicago, Illinois, USA
Address correspondence to: Leslie Baier, National Institutes of Health, 4212 N. 16th Street, Phoenix, Arizona 85016, USA. Phone: (602) 200-5240; Fax: (602) 200-5225; E-mail: lbaier@phx.niddk.nih.gov.
Received for publication June 28, 2000, and accepted August 28, 2000.
Previous linkage studies in Mexican-Americans localized a major susceptibili-ty locus for susceptibili-type 2 diabetes, NIDDM1, to chromosome 2q. This evidence for linkage to type 2 diabetes was recently found to be associated with a common G→A polymorphism (UCSNP-43) within the CAPN10gene. The at-risk geno-type was homozygous for the UCSNP-43 G allele. In the present study among Pima Indians, the UCSNP-43 G/G genotype was not associated with an increased prevalence of type 2 diabetes. However, Pima Indians with normal glu-cose tolerance, who have a G/G genotype at UCSNP-43, were found to have decreased rates of postabsorptive and insulin-stimulated glucose turnover that appear to result from decreased rates of glucose oxidation. In addition, G/G homozygotes were found to have reduced CAPN10mRNA expression in their skeletal muscle. A decreased rate of insulin-mediated glucose turnover, or insulin resistance, is one mechanism by which the polymorphism in CAPN10
may increase susceptibility to type 2 diabetes mellitus in older persons.
J. Clin. Invest.106:R69–R73 (2000).
Rapid
es in plasma glucose concentration (1) and therefore may not reflect primary or genetic determinants.
Methods
Subjects. Volunteers were recruited from the Gila River Indian Commu-nity and written informed consent was obtained before participation. All studies were approved by the Tribal Council and the Institutional Review Board of the National Institute of Diabetes and Digestive and Kidney Diseases. For detailed metabolic test-ing, individuals were admitted to our clinical research ward for 7–10 days, and only persons found to be healthy by medical history, physical examina-tion, and routine laboratory tests, and not taking medications, were
studied. The association analysis of metabolic characteristics (Table 1) included data from 158 Pima Indians with normal glucose tolerance (2-hour glucose < 7.8 mM). If data on an individual was available from more than one yearly study, only the data from the first study was used in these analyses. The association analysis of type 2 diabetes (Table 2) included data on 720 Pima Indians selected randomly from participants in our ongoing longitudinal epidemiologic study (4). Individuals were classified into groups according to sex and six decades of age, and 60 individuals were selected for genotyping from each group. Diabetes was defined according to the criteria of the World Health Organization (10).
Clinical tests. Until January, 1996, body composition was estimated by under-water weighing and by dual-energy x-ray absorptiometry (DPX-1; Lunar Radia-tion Corp., Madison, Wisconsin, USA) thereafter. A conversion equation derived from comparative analyses was used to make estimates of body compo-sition comparable between methods (11). Oral glucose tolerance was meas-ured after 2–3 days on a weight-main-taining diet of mixed composition. Sub-jects ingested 75 g of glucose, and blood for plasma glucose and insulin concen-trations was drawn before ingesting the glucose and at 30, 60, 120, and 180 min-utes. Glucose tolerance was classified according to the criteria of the World Health Organization (10). Subjects also received a 25-g intravenous injection of glucose over 3 minutes to measure the acute insulin response. Blood samples were collected before infusion and at 3, 4, 5, 6, 8, and 10 minutes after infusion to determine plasma glucose and insulin concentrations. The acute insulin response was calculated as half the mean increment in plasma insulin concentrations from 3–5 minutes.
For the insulin clamp studies, both basal glucose appearance and insulin-stimulated glucose disappearance (uptake) rates were determined, as described in detail elsewhere (6, 8). Briefly, insulin was infused to achieve physiologic and maximally stimulat-ing plasma insulin concentrations (137 ± 3 and 2,394 ± 68 µU/ml, respec-tively) for 100 minutes for each step. Plasma glucose concentrations were held constant at ∼100 mg/dl by a vari-able 20%-glucose infusion. Tritiated glucose was infused for 2 hours before the insulin infusion to calculate rates of postabsorptive glucose appearance rates and to calculate glucose disap-pearance rates during the lower dose of insulin infusion. Ventilated-hood indirect calorimetry was used to esti-mate rates of glucose and lipid oxida-tion before and during the insulin infusions (7). Glucose appearance, dis-appearance, oxidation, and lipid oxi-dation rates were normalized to esti-mated metabolic body size (fat-free mass + 17.7), as described (6–8).
[image:3.612.55.362.78.355.2]The measurement of energy expendi-ture and substrate oxidation in the res-piratory chamber has been described
Table 1
Metabolic characteristics of subjects by UCSNP-43 genotypes
UCSNP-43 G/G UCSNP-43 G/A + A/A PvalueB
Number of subjects (M/F) 41/21 65/31 Oral glucose-tolerance test
Fasting glucose (mg/dl) 92 ± 1 89 ± 1 0.01
2-hour glucose (mg/dl) 115 ± 2 111 ± 2
Fasting insulin (µU/ml) 41 ± 3 37 ± 2
2-hour insulin (µU/ml) 165 ± 14 143 ± 11 0.05
Postabsorptive (basal)A
Endogenous glucose output 1.84 ± 0.03 1.95 ± 0.02 0.0004
Carbohydrate oxidation 1.38 ± 0.06 1.43 ± 0.04
Lipid oxidation 0.69 ± 0.03 0.68 ± 0.02
Low insulin clampA
Glucose disposal 2.61 ± 0.13 2.77 ± 0.10 0.006
Carbohydrate oxidation 1.97 ± 0.07 2.10 ± 0.05 0.04
Nonoxidative glucose disposal 0.64 ± 0.12 0.67 ± 0.08
Lipid oxidation 0.56 ± 0.04 0.49 ± 0.03
High insulin clampA
Glucose disposal 8.92 ± 0.24 9.31 ± 0.02 0.05
Carbohydrate oxidation 3.35 ± 0.07 3.55 ± 0.07 0.009
Nonoxidative glucose disposal 5.57 ± 0.22 5.77 ± 0.17
Lipid oxidation 0.00 ± 0.04 –0.08 ± 0.04
Acute insulin response(µU/ml) 263 ± 25 269 ± 19 Respiratory chamberC
Sleeping metabolic rate (kcal/d) 1,622 ± 40 1,682 ± 29 0.01
24-hour metabolic rate (kcal/d) 2,334 ± 55 2,382 ± 41
24-hour respiratory quotient 0.846 ± 0.004 0.850 ± 0.003
Carbohydrate oxidation (kcal/d) 1,037 ± 35 1,075 ± 26
Lipid oxidation (kcal/d) 994 ± 44 958 ± 33 0.03
Protein oxidation (kcal/d) 282 ± 16 306 ± 12 0.01
Data are given as mean ± SE. Only Pvalues of 0.05 or less are given. ARates of postabsorptive glucose
pro-duction, substrate oxidation, and insulin-stimulated glucose disposal are expressed as milligrams per minute per kilogram of estimated metabolic body size. Insulin-stimulated glucose disposal and oxidation rates were determined using a two-step hyperinsulinemic euglycemic clamp technique with simultaneous indirect calorimetry (see Methods). BGlucose, insulin, postabsorptive, and insulin-stimulated glucose
appearance/disappearance and substrate oxidation rates were adjusted for age, sex, percentage of body fat, and nuclear family membership. Metabolic rates were adjusted for age, sex, fat-free mass, fat mass, and nuclear family membership. Substrate oxidation rates in the respiratory chamber were adjusted for age, sex, percentage of body fat, and energy balance. Plasma insulin concentrations and low-insulin clamp glucose-disposal rates were log transformed before analysis. The Pvalues were not corrected for multiple testing, although three main effects (glucose turnover, insulin secretion, and energy/substrate metabo-lism) were tested. CThe two groups of subjects studied in the respiratory chamber (UCSNP-43-G/G = 33
previously (11). Briefly, volunteers entered the chamber after an overnight fast and remained in the chamber for 23 hours. Subjects were fed calories to maintain energy balance according to previously determined equations, and the rate of energy expenditure was measured continuously, calculated for each 15-minute interval within the chamber, and then extrapolated to 24 hours (24-EE). The sleeping metabolic rate was calculated between 2300 hours and 0500 hours as the mean metabolic rate of all 15-minute periods during which spontaneous physical activity was detected by radar less than 1.5% of the time. Carbon dioxide production (VCO2) and oxygen consumption (VO2)
were calculated for every 15-minute interval. The 24-hour respiratory quo-tient (24-RQ) was calculated as the ratio of 24-hour VCO2 and 24-hour VO2.
Based upon 24-RQ, 24-EE, and 24-hour urinary nitrogen excretion, the 24-hour oxidation rates of fat, carbohydrate, and protein were determined (11).
Genotyping. Genomic DNA extracted from peripheral blood lymphocytes was genotyped for UCSNP-43 (CAPN10-g.4852G/A) (3) by sequenc-ing a PCR-amplified fragment. PCR primers were forward 5′- GCTGGCTG-GTGACATCAGTG-3′ and reverse 5′
-TCAGGTTCCATCTTTCTGCCAG-3′. PCR was performed with 60 ng of genomic DNA in a buffer containing 1.5 mM MgC12, 0.25 mM dNTPs, and 0.15 µl
of AmpliTaq Gold (Applied Biosys-tems Inc., Foster City, California, USA) DNA polymerase. PCR conditions were 94°C for 10 minutes, followed by 33 cycles of 94°C for 30 seconds, 60°C for 30 seconds, and 72°C for 30 sec-onds, followed by a final extension at 72°C for 10 minutes. DNA was sequenced with the primer 5′
-AGC AGGGTTGG-AGCTTGAGAG-3′. DNA-cycle sequencing was carried out using the Big Dye Terminator on an automated DNA sequencer (model 377; Applied Biosystems Inc.).
Preparation of total RNA from human skeletal muscle biopsies and real-time quan-titative RT-PCR. Percutaneous muscle biopsies were obtained from the quadriceps femoris muscle after local anesthesia of skin and fascia with 2% lidocaine. Biopsies were immediately frozen in liquid nitrogen, and RNA was
extracted using ToTALLY RNA kit (Ambion, Austin, Texas, USA). The cDNA was synthesized using the Advantage RT-for-PCR kit (CLON-TECH Laboratories, Palo Alto, Califor-nia, USA). Quantitation of reverse-transcribed CAPN10 mRNA (and
β-actin mRNA as an endogenous refer-ence) was done as a real-time measure-ment in an ABI PRISM 7700 Sequence Detection System (Applied Biosystems Inc.), according to the manufacturer’s instructions. The sequences of the PCR primers and probe for CAPN10 detec-tion were forward: 5′- CACCTACCTGC-CGGACACA-3′, reverse: 5′- TGCCAT-GACGGAGACCTCTT-3′, and probe: 5′(Fam)- CAACCAGGATTGACAGGC-CATCCATT-(Tamra)p-3′. This CAPN10 probe recognized seven of the eight iso-forms of CAPN10(excluding the g iso-form). The sequences of PCR primers and probe for β-actin detection were forward: 5′- TCACCCACACTGTGCC-CATCTACGA-3′, reverse: 5′- CAGCG-GAACCGCTCATTGCCAATGG-3′, and probe: 5′(Vic)- ATGCCCCCCCCATGC-CATCCTGCGT(Tamra)p-3′. For each probe and primer set, a standard curve was generated by serial dilution (done in triplicate) of cDNA from a skeletal muscle biopsy of a healthy Pima sub-ject. All samples were run in duplicate. The data were calculated using the
standard curve method and expressed as a ratio to the β-actin reference.
Statistical analyses. Statistical analyses were performed using the statistical analysis system of the SAS Institute (Cary, North Carolina, USA). For con-tinuous variables, the general estimat-ing equation procedure (GEE) was used to adjust for covariates — age, sex, percentage of body fat, energy balance, fat-free mass, fat mass, and nuclear family membership, as indicated. Plas-ma insulin concentration and rates of glucose disappearance during the low-dose insulin infusion were log-trans-formed before analyses to approximate a normal distribution. The association of CAPN10genotype with diabetes was assessed by analysis of contingency tables. The Mantel-Haenszel proce-dure was used to calculate the age- and sex-adjusted odds ratio (OR) compar-ing individuals with the UCSNP-43 G/G genotype with those with the A/G or the A/A genotype.
Results
[image:4.612.219.538.487.696.2]UCSNP-43 has allelic frequencies of G = 0.62 and A = 0.38 in Pima Indians. Since the evidence for linkage in the NIDDM1 region in Mexican-Ameri-cans was attributable to the affected sib pairs homozygous for the high-fre-quency G allele (3), the data for Pima
Table 2
Association of UCSNP-43 genotypes with diabetes mellitus
UCSNP-43 Frequency of
genotype n n Diabetic (%) G allele ORGG (95% CI) Pvalue
10–19 GG 43 2 (5)
AG 51 2 (4)
AA 21 0 (0) 0.60 1.72 (0.24–12.4) 0.59
20–29 GG 44 6 (14)
AG 54 12 (22)
AA 16 4 (25) 0.62 0.43 (0.14–1.25) 0.12
30–39 GG 41 15 (37)
AG 47 17 (36)
AA 21 8 (38) 0.59 0.94 (0.41–2.15) 0.89
40–49 GG 41 22 (54)
AG 58 34 (59)
AA 13 7 (54) 0.63 0.83 (0.38–1.84) 0.65
50–59 GG 61 46 (75)
AG 39 27 (69)
AA 17 14 (82) 0.69 1.06 (0.45–2.47) 0.72
60+ GG 41 34 (83)
AG 50 35 (70)
AA 19 13 (68) 0.60 2.07 (0.78–5.53) 0.15
Summary 0.62 0.98 (0.67–1.43) 0.91
ORGGrepresents the sex-adjusted odds ratio for diabetes comparing individuals with the GG genotype
with those with the AG and AA genotypes. The numbers in parentheses represent the 95% confidence intervals (CI) for ORGG, and the Pvalue is that associated with the null hypothesis of no association
Indians were analyzed similarly. Indi-viduals homozygous for the UCSNP-43 G allele (GG) were compared with individuals not homozygous for the UCSNP-43 G allele (i.e., A/A and G/A). The two groups had similar ages (mean ± SE = 26 ± 1, 27 ± 1 years) and per-centage of body fat (mean ± SE = 31 ± 1 for both groups). Metabolic character-istics of the two groups were compared after adjusting for age, sex, percentage of body fat, and nuclear family mem-bership, since many of the subjects were siblings (Table 1). People homozy-gous for the G allele had a higher mean fasting plasma glucose (P = 0.01). In contrast, the mean fasting rate of cose appearance, or endogenous glu-cose production, was lower in the G/G group (P = 0.0004). The mean plasma insulin concentration 2 hours after ingesting 75 g glucose was higher in the G/G group (P = 0.05), indicative of insulin resistance. The results of the euglycemic clamp studies confirmed this with lower mean glucose-disposal rates in the G/G group during the low-dose (physiologic) insulin infusion (P = 0.006) and the high-dose (maxi-mal) insulin infusion (P = 0.05). The lower rate of glucose disposal appeared to be the result of a lower glucose-oxi-dation rate, since differences in carbo-hydrate oxidation were more signifi-cant (P = 0.04 and P = 0.009 for the low-and high-dose insulin infusion, respec-tively) than differences in nonoxidative
glucose disposal (P = 0.26 and P = 0.23 for the low- and high-dose insulin infu-sion, respectively).
Differences in substrate oxidation rates between the genotype groups were also observed in data from the respira-tory chamber (Table 1). People homozy-gous for the UCSNP-43 G allele oxi-dized more lipid (P = 0.03) and less protein (P = 0.01) over 24 hours than people with the G/A or A/A allelic com-binations (after adjusting for age, sex, percentage of body fat, and energy bal-ance). The G/G group also oxidized less carbohydrate, but this difference (P = 0.81) did not reach statistical signifi-cance. The differences in substrate oxi-dation rates occurred despite all indi-viduals having eaten a diet of similar energy and substrate content during the indirect calorimetric measurements. These results indicate significant differ-ences in nutrient partitioning between the groups. In addition, the mean sleep-ing metabolic rate was lower in the G/G group (P = 0.01, after adjusting for age, sex, fat-free mass, fat mass, and nuclear family membership), most likely as a result of the lower rate of endogenous glucose production, which is an energy-costly process to the extent that it is due to gluconeogenesis. Note that whenever multiple phenotypes are analyzed, some may differ significantly by chance. The Pvalues in this study were not adjusted for multiple testing, although three main effects were tested (glucose
turnover, insulin secretion, and ener-gy/substrate metabolism). To examine whether the effects of the UCSNP-43 G/G genotype on glucose turnover and nutrient partitioning might lead to an increased risk of type 2 diabetes, a ran-dom sample of 720 full-heritage Pima Indians was genotyped. Overall, there was no statistically significant associa-tion between the UCSNP-43 genotype and prevalence of diabetes (Table 2).
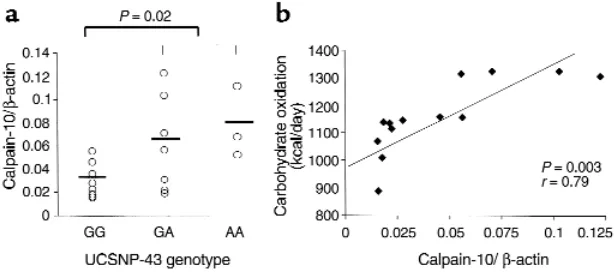
In vitro evidence suggests that the nucleotide sequence encompassing UCSNP-43 may be involved in regulat-ing CAPN10expression (3). Therefore, we investigated the in vivo expression of CAPN10mRNA in skeletal muscle, a major target for insulin action, in 18 male nondiabetic Pima subjects. Indi-viduals homozygous for the G allele had 53% lower mean CAPN10transcript lev-els compared with heterozygotes, where-as A/A homozygotes had the highest mean levels (Figure 1a). As predicted from the larger data set, individuals with lower CAPN10transcription (G/G genotype) had reduced basal and insulin-stimulated carbohydrate oxida-tion rates, but perhaps due to small sample size (n = 18), this association did not reach statistical significance. How-ever, a significant correlation (r = 0.79; P = 0.003) was observed between the level of CAPN10expression in skeletal muscle and the rate of carbohydrate oxidation measured in the respiratory chamber over 24 hours (Figure 1b).
Discussion
[image:5.612.62.369.55.192.2]The results from our metabolic tests show that Pima Indians with a UCSNP-43 G/G genotype have reduced rates of endogenous glucose production, which, in the presence of an increased fasting plasma glucose concentration, is indica-tive of a decreased rate of peripheral glu-cose disappearance. The lower rate of glucose disappearance in the presence of both physiologic and maximally stimu-lated plasma insulin concentrations apparently results from decreased glu-cose oxidation. When provided with exogenous substrate, including lipid and protein in addition to carbohydrate, G/G homozygotes preferentially oxidize lipids. No difference was observed between the groups in insulin secretory function as measured by the acute insulin response; however, since
Figure 1
CAPN10is expressed in pancreatic islets and insulinoma cell lines, a deficit in glucose oxidation would be predicted to affect insulin secretion since it depends on glucose metabolism. Therefore, addi-tional studies of insulin secretory func-tion using graded glucose infusions to measure insulin responses will be need-ed to more accurately assess the conse-quences of the UCSNP-43 genotype on insulin secretion.
The UCSNP-43 G/G phenotype in Pima Indians is strikingly similar to the phenotype proposed to aid in the sur-vival of famines in early humans, orig-inally described by Cahill (12) and recently revisited by Reaven (13). In times of famine, Cahill hypothesized, “…if tissues are better able to exclude glucose… then gluconeogenesis and, in turn, body protein should be spared...” (12). Preservation of body protein stores maintains the skeletal muscle mass essential for flight responses and hunting (12). We would extend Cahill’s proposed phenotype based on our present data. The tissues of UCSNP-43 G/G individuals “exclude” glucose oxi-dation, but not glucose storage. This preserves not only skeletal muscle pro-tein, but also skeletal muscle glycogen, which is necessary to fuel high-energy muscle contraction for flight or hunt-ing. A decreased rate of gluconeogene-sis, evidenced by a decreased sleeping metabolic rate, further serves to reduce caloric requirements during food dep-rivation. Preferential oxidation of lipid, as is also observed among UCSNP-43 G/G individuals, enables an easier switch to ketone production to fuel the brain when carbohydrate supply is lim-ited. However, in times of ample food supply, the UCSNP-43 G/G phenotype would favor positive carbohydrate bal-ance, which may lead to expansion of glycogen stores and secondary insulin resistance, as we have reported previ-ously in subjects overeating 1,000 kcal/day for only 1 week (14).
In conclusion, these studies indicate that people homozygous for the UCSNP-43 G allele have reduced mus-cle CAPN10mRNA and insulin
resist-ance, apparently due to lower rates of insulin-stimulated glucose oxidation. When eating a diet of mixed composi-tion they preferentially oxidize fat. These phenotypic differences are indicative of altered nutrient partition-ing. Postabsorptively, there is also a lower rate of glucose turnover and endogenous glucose production, result-ing in a lower metabolic rate. The mag-nitude of the difference in the preva-lence of diabetes in the older Pima Indians (60+ years) is consistent with what would be predicted by the small but significantly lower rate of glucose turnover among nondiabetic UCSNP-43 G/G homozygotes. The phenotypic effects of UCSNP-43 are detectable even though little evidence for linkage between type 2 diabetes (and prediabet-ic/preobese phenotypes) and markers from this region of chromosome 2 was observed in our genomic scan in Pima Indians (11, 15, 16). This discordance is not surprising, since a number of fac-tors may affect the power to detect link-age differently than they affect the power to detect association and sug-gests that phenotypic effects of UCSNP-43 may be detected in other populations, as well. Indeed, in two European populations, as well as in Mexican-Americans, an increased risk of diabetes was observed in individuals with a specific CAPN10 haplotype, which included UCSNP-43 as well as two additional polymorphisms within this gene (3), although this haplotype did not increase the risk of diabetes in the Pima population. These combined molecular genetic and physiologic stud-ies are the early stages of unraveling the complex, oligogenic basis of this com-mon metabolic disease.
Acknowledgments
We thank the members of the Gila River Indian Community without whose continuous cooperation these studies would not be possible. We grate-fully acknowledge the technical assis-tance of Christopher Wiedrich, Kim Cray, Michael Traurig, Jeff Sutherland, Bonnie Cooper, Pam Thuillez, Angie
Dobberfuhl, Pam O’Connor, and Jeff Bunkelmann. We also thank Linda Phillips and other members of the Dia-betes and Arthritis Epidemiology Sec-tion for obtaining DNA samples. Final-ly, we thank Michael Milner, Carol Massengill, and the nurses of the Clini-cal Research Ward, and Arline Salbe and the staff of the Metabolic Kitchen for the care of the research volunteers.
1. DeFronzo, R.A., Bonadonna, R.C., and Ferrannini, E. 1992. Pathogenesis of NIDDM. A balanced overview. Diabetes Care.15:318–368.
2. Hanis, C.L., et al. 1996. A genome-wide search for human non-insulin-dependent (type 2) diabetes genes reveals a major susceptibility locus in chro-mosome 2. Nat. Genet. 13:161–166.
3. Horikawa, Y., et al. 2000. Genetic variation in the gene encoding calpain-10 is associated with type 2 diabetes mellitus. Nat. Genet. 26:163–175. 4. Knowler, W.C., Bennett, P.H., Hamman, R.F., and
Miller, M. 1978. Diabetes incidence and prevalence in Pima Indians: a 19-fold greater incidence than in Rochester, Minnesota. Am. J. Epidemiol. 108:497–505.
5. Bogardus, C. 1996. Metabolic abnormalities in the development of non-insulin dependent diabetes mellitus. In Diabetes mellitus: a fundamental and clin-ical text. D. LeRoith, S.I. Taylor, and J.M. Olefsky, editors. Lippincott-Raven. Philadelphia, Pennsyl-vania, USA. 459–467.
6. Lillioja, S., et al. 1993. Insulin resistance and insulin secretory dysfunction as precursors of non-insulin-dependent diabetes mellitus. Prospective studies of Pima Indians. N. Engl. J. Med. 329:1988–1992.
7. Lillioja, S., and Bogardus, C. 1988. Obesity and insulin resistance: lessons learned from the Pima Indians. Diabetes Metab. Rev.4:517–540. 8. Lillioja, S., et al. 1987. In vivo insulin action is a
familial characteristic in non-diabetic Pima Indi-ans. Diabetes.36:1329–1335.
9. Sakul, H., Pratley, R., Ravussin, E., Mott, D., and Bogardus, C. 1997. Familiality of physical and metabolic characteristics that predict the develop-ment of non-insulin dependent diabetes mellitus in Pima Indians. Am. J. Hum. Genet. 60:651–656. 10. 1985. Diabetes mellitus. World Health Organiza-tion. Geneva, Switzerland. Technical Report Series, No. 727.
11. Norman, R.A., et al. 1998. Autosomal genomic scan for loci linked to obesity and energy metabo-lism in Pima Indians. Am. J. Hum. Genet. 62:659–668.
12. Cahill, G.F., and Owen, O.E. 1967. Starvation and survival. Trans. Am. Clin. Climatol. Assoc.79:13–20. 13. Reaven, G.M. 1998. Hypothesis: muscle insulin resistance is the (“not-so”) thrifty genotype. Dia-betologia.41:482–484.
14. Mott, D.M., Lillioja, S., and Bogardus, C. 1996. Overnutrition induced decrease in insulin action for glucose storage: in vivo and in vitro in man. Metabolism.35:160–165.
15. Hanson, R.L., et al. 1998. An autosomal genomic scan for loci linked to type II diabetes mellitus and body-mass index in Pima Indians. Am. J. Hum. Genet. 63:1130–1138.