© 2016, IRJET | Impact Factor value: 4.45 | ISO 9001:2008 Certified Journal
| Page 1078
Grape Leaf Disease Detection using Embedded Processor
Prathamesh.K. Kharde
1, Mrs.Hemangi.H.Kulkarni
21
Student, Dept of Electronics and Telecommunication, GES R.H Sapat College of Engineering, Nashik-5,
Maharashtra, India
2
Assistant professor, Dept of Electronics and Telecommunication, GES R.H Sapat College of Engineering, Nashik-5,
Maharashtra, India
---***---Abstract -
Plant disease detection is a tedious task; Grape isimportant crop which yields high income to the farmer if any disease found on the grape plant then it will very disasters to the farm yield. Grape leaf disease detection is carried out using an embedded processor known as Raspberry pi. Digital image processing algorithm like color transformation, edge detection, segmentation are used to implement. Due to change in weather conditions, there is a rise in different diseases which grow on the plant. It is very difficult to identify the disease in limited resources. Raspberry pi will store input & output data on inbuilt memory cards. This system is used for automatic detection of various diseases in grapevine leaves & it will show the result as the name of the disease which present on the leaf along with its intensity and suggests the remedies accordingly.
Key Words: Grape leaf disease, Raspberry Pi, Leaf
disease detection and classification, Farm yield, resources
1.INTRODUCTION
Leaf diseases are economically critical as they can be a matter of a loss of yield. Intial and trustworthy detection of leaf diseases has an important practical application, especially in the background of precision farming for confined treatment with fungicides. Amid the last few years, image categorization has proved increasingly effective in biology, as numerous tasks have been simplified with the Support of automated snapshot classification. Conventional master frameworks particularly those utilized as a part of diagnosing maladies in agricultural domain depend only on textual information. Generally, abnormalities for a given crop are manifested as symptoms on various parts of the plant. To implement a specialist system to produce right results, end clients must be capable of mapping what they see in a form of unusual manifestations to answers to questions asked by that master framework. This mapping may be inconsistent if a full Knowledge of the anomalies on any plant. Contingent upon the client’s level of comprehension of the unusual Perceptions, the professional system can reach the correct diagnosis. The unusual scrutinization in a incorrect way and selects a wrong textual answer to a given question, and then the expert framework will achieve a wrong reply. We set up one technique where irregularities are mechanically perceived, would diminish the threat of human blunder and
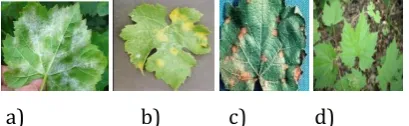
would in like manner lead to a more detailed analysis. Image processing will play a vital role in an agricultural field. The master framework can come to a right and precise determination through extracting indications from those deserted images and apply the thinking process while considering the extricated indications. We group three diverse grape diseases like powdery mildew, downy mildew and black rot. The pictures of these three ailments are as follows
[image:1.595.308.513.330.393.2]a) b) c) d)
Fig -1: a) Powdery mildew b) Downy mildew c) Black rot d) Normal leaf
1.1 Literature Survey
© 2016, IRJET | Impact Factor value: 4.45 | ISO 9001:2008 Certified Journal
| Page 1079
sicknesses like copper burn, greasy spot, melanose, wind scar, cankar [4]. Pre-processing used histogram equalization; features are extracted from wavelet decomposition and at last categorized by Euclidean distance method [5]. Automatic categorization of leaf diseases is done based on high resolution stereo and multispectral images [6]. Color and textures features are extracted and categorization is done using neural networks [7-8]. Wayne Wilcox presented grape disease control thesis and different fungicides for respected diseases [9]. A. Meunkawjin et al detected grape color by a self-organizing feature map (SOFM) with back-propagation neural network. Segmentation & optimization is done by modified SOFM with genetic algorithm. With the help of SVM & Gabor wavelet grape color feature classify & analyze [10].
2. Proposed System
After analyzing different research carried out by different authors, it is clear that the task of plant disease identification and classification is of greater importance in the field of agriculture. Therefore, evolving automated mechanism for plant disease classification has gained much interest in the field of research now days. To analyze the disease, an image processing system has been cultured to automate the recognition and categorization of various disorders.
Fig-2: Overall System Architecture
The image processing algorithm is processed on raspberry pi. The basic procedure started with capturing image of a grape leaf using the camera
.
Fig-3: Basic procedure for the grape leaf disease detection
A. Image Acquisition
The image acquisition can be done by USB webcam which we attached to Raspberry pi or another way the send image through email via internet. Iball Usb camera with up to 20 megapixel resolution used for capturing images of diseased grape leaf & these images are save in jpeg format.
B. Color Transformation Structure
Hue Saturation Intensity (HSI) color space representation of the RGB images of leaves are done initially. The desire of the color space is to promote the specification of colors in some standard, generally in accepted way. This HSI (hue, saturation, intensity) color model is a very famous color model because it is based on human recognition. Electromagnetic emission in the range of wavelengths of about 400 to 700 nanometers is termed visible light because the human visual system is responsive to this range. Hue is generally corresponds to the wavelength of a light Hue is a color virtue that refers to the leading color as recognized by an observer. Saturation point out to the relative purity or the number of white light added to hue and amplitude of the light refers to intensity. Conversion of color spaces from one space to another can be done easily. After the transformation process, further analysis is carried out with the assitance of H part. S and I are dropped since it does not give extra information [8]. Converting colors from RGB to HSI The hue H is given by,
(1)
Where,
= cos-1[ (R - ½G - ½B)/√R² + G² + B² - RG –
RB- GB ]
The saturation S is given by,
S (R+G+B) (2)
The intensity I is given by,
I =
(R+G+B) (3)C
.Masking Green Pixels
In this stage, the mostly green colored pixels are identified. After that, based on specific and changing threshold value means Otsu's method is used that is computed for these pixels, these for most part of green pixels are masked as follows: if the pixel intensities of green component are less than the pre-computed threshold value, zero value is assigned to the red, blue and green components. This is done in the sense that these pixels have no valuable significance to User
Camera captured or mail sent images (Fungal Disease leaves image)
Raspberry Pi System
Result
WAP SMS with Remedy
Image Acquisition
Image Pre-processing
Image Segmentation
Feature Extraction
© 2016, IRJET | Impact Factor value: 4.45 | ISO 9001:2008 Certified Journal
| Page 1080
the malady distinguishing proof and order steps, and areas in the leave which is in good shape represented by those pixels. Moreover, the image processing time should become significantly cut down. In next step, zero values of red, green and blue pixels were finally eliminated. More authentic disease identification and classification results with satisfied performance and the total estimation time should become very much less with the use of this phase. After that the image is converted into binary image i.e. Black (0) & white (1).
D.
Segmentation
From the previous steps, the infected section of the leaf is extracted. The affected part is then segmented into proportionate size of many patches. The size of the patch is chosen in such a way that the important data is not lost. In this phase we took patch size of 32 X 32. The next stage is to extract the useful segments. Some of the segments incorporate rich amount of information. So the patches which have more than half percent of the information are taken into account for the further analysis. We used watershed segmentation method.
The watershed algorithm steps are given below
Read in the color image & convert it to grayscale.
Use gradient magnitude as the segmentation function. The gradient defined by the first partial derivative of an image & contains a measurement for the change of gray levels.
Next step is to calculate the Foreground Markers. These are related blobs of pixels inside each of the articles in the picture. A variety of methods could be applied to find the Foreground Markers. In the present work, morphological procedures called "opening-by reconstruction" and "closing-by-reconstruction" are applied to "clean" up the picture. These operations will make level maxima innermost region of each object. Opening-by-reconstruction is erosion trailed by a morphological reconstruction whereas closing-by-reconstruction is dilation succeeded by morphological recreation. These operations will evacute little blemishes without changing the overall shapes of the articles. Good Foreground Markers can be acquired by processing the local maxima of the resulting Gradient Image. Next the background areas shuld be marked. In the cleaned-up picture, the dark pixels associate to the background, so thresholding is a suitable operation to start with.
The background pixels will be in dark, yet in perfect world the background markers shouldn’t be excessively near edges of the articles that are being fragmented. So the following stage is to "thin" the background by figuring the "skeleton by influence zones", or SKIZ, of the foreground. This can be performed by calculating the watershed transform of the distance transform of threshold image, and then searching for the watershed ridge lines of the result.
The next step is to modify the Gradient Image so that it has local minima only in certain suitable locations i.e. at the Foreground and Background Marker pixels.
The final step is to give this adjusted Gradient Image as input to the Watershed Transform Algorithm. E. Feature Extraction
The succeeding step is to extract texture features of the extracted diseased segments. This is carried out by using Gray Level Co-occurrence Matrix (GLCM) calculating. Spatial gray-level dependence matrices (SGDM’s) are used to develop the color co-occurrence texture analysis method. Co-occurrence matrices measure the probability that pixels at one particular gray-level will appear at a specific distance and orientation from any pixel given that pixel has a second means other distant gray-level. The SGDM’s are described by the function P (i, j, d, θ) where the gray-level of location (x, y) in the image represented by i and j represents the gray-level of the pixel from location (x, y) at an orientation angle of θ, & at a distance d, where i is the row indicator and j is the column indicator in the SGDM matrix P (i, j, d, θ). The adjacent neighbor mask, where the reference pixel (x, y) is shown as an asterisk. The one pixel distance from the reference pixel ‘*’ are maintain by all eight neighbors and they are numbered as one to eight in clockwise direction as shown in the figure. The neighbors at positions 1 and 5 are both examined to be at an direction angle equal to 00, at the
same time locations eight and four are considered to be at an angle of 450[12].
1350 900 450
Fig-5: Nearest neighbor mask for calculating spatial
gray-level dependence matrices (SGDM’s) After the change forms, we figured the element set for
Hue and Saturation, we discarded (I) since it does not give extra information. However, we use GLCM function in java to create gray-level co-occurrence matrix; the number of gray levels is set to 8, and the equal value is fix to “true”, and finally, offset is given a” 0” value.
The CCM matrices are then normalized using Equation 4.
(4)
P(i,j) is the image attribute matrix(i,j,1,0) represents the intensity co-occurrence matrix (CCM)& Ng total number of
intensity levels. Different texture features are extracted using glcm methodology. These features are given below.
Energy= (5) 6 7 8
© 2016, IRJET | Impact Factor value: 4.45 | ISO 9001:2008 Certified Journal
| Page 1081
Where i, j are the dimensional coordinates of the function p (i, j), Ng is gray tone.
Entropy = (6)
Correlation = (7)
F.
Detection
Artificial Neural Network has been an inspiring methodology for training and classification purposes. In this paper, neural networks are used in the automatic exposing of leaves diseases. Neural network is picked as a grouping apparatus because of its surely understood procedure as a fruitful classifier for many real applications. The training and validation processes are among the significant stages in developing a precise process model using NNs. The dataset for preparing and approval forms comprises of two parts; the training component set which are used to prepare the NN model; while a testing highlights sets are used to justify the accuracy of the trained NN model. Kohonen neural network is used to train the images. The number of neurons in the input layer complements to the number of information highlights and the quantity of neurons in the yield layer corresponds to the number of classes. The number of nodes in the hidden layer is calculated using the Equation 8.
n = y0.5 (8)
Where n= number of nodes in hidden layer, I= number of inputs highlight,
O= number of yields, and
y= number of inputs pattern in the training set. Once the weight of learning database has been
ascertained then ANN can test for any query image which is not already in learning database.
3
.
Result & discussion
We applied normal as well as Powdery mildew, Downy mildew, Black rot infected leaves of grape as input images to this device for testing. We used OpenCV libraries for this. The remedy of the detected disease isalso shown to user. Thesimulated images of the diseased leaves of grape given below
(a)Powdery mildew(b)segmented (c)Feature extracted
affected leaf
image
image
Fig-6: Result of Powdery mildew disease detected
(a) Downy mildew (b) segmented (c) feature extracted
affected leaf image image
Fig-7:Result of Downy mildew disease detected
(a) Black Rot affected (b) segmented image (c)Feature extracted Leaf image
Fig-8: Result of Black Rot disease detected
© 2016, IRJET | Impact Factor value: 4.45 | ISO 9001:2008 Certified Journal
| Page 1082
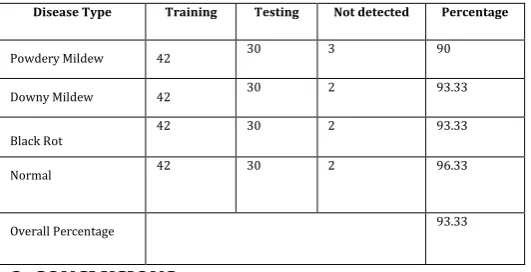
Table -1: The Result tableDisease Type Training Testing Not detected Percentage
Powdery Mildew 42 30 3 90
Downy Mildew 42 30 2 93.33
Black Rot 42 30 2 93.33
Normal 42 30 2 96.33
Overall Percentage 93.33
3. CONCLUSIONS
In this paper, identifying the disease is prime objective of this proposed method. The images of grape leaf are processed & if it is infected by any disease then the system detects the disease. Thus, the proposed Algorithm was tested on three diseases which influence on the plants; they are Powdery mildew, Downy mildew & Black rot.
Kohonen neural network is used for classifying disease on grape leaves according to their features. Overall accuracy of 93.44 has been found with this methodology.
ACKNOWLEDGEMENT
The authors are thankful to Prof. S.P Agnihotri, Head of the Department (Electronics and Telecommunication), Prof. M. P. Joshi ME coordinator. Dr. P. C. Kulkarni, Principal, Mr. P. M. Deshpande, Project Director, Sir M. S. Gosavi, Director, G.E.S. R.H .Sapat College of Engineering, Management Studies and Research Nashik, Maharashtra, India.
REFERENCES
[1] Camargo-Rodriguez , A V & Smith , J S 2009 , ' An
image-processing based algorithm to automatically identify plant disease visual symptoms ' Biosystems Engineering ,vol 102,no.1,pp.9-21.,10.1016/j.biosystemseng.2008.09 .030.
[2] Husin, Z.B.; Shaka A.Y.B.M.; Aziz, A.H.B.A.; Farook
R.B.S.M., "Feasibility Study on Plant Chili Disease Detection Using Image Processing Techniques," in Intelligent Systems, Modelling and Simulation (ISMS), 2012 Third International Conference on , vol., no., pp.291-296, 8-10 Feb. 2012 M. Young, The Technical Writer’s Handbook. Mill Valley, CA: University Science, 1989.
[3] Bashish D., M. Braik and S. Bani-Ahmad, “Detection and
classification of leaf diseases using K-means-base segmentation and neural networks based classification.” Inform.Technol.J.,10:267-275.
DOI:10.3923/itj.2011.267.275,January,2011.
[4] Revathi P., Hemalatha M., "Advance computing
enrichment evaluation of cotton leaf spot disease detection using Image Edge detection, 2012 Third International Conference on Computing Communication & NetworkingTechnologies (ICCCNT) pp.1-5, 26-28 July2012 .
[5] DaeGwan Kim, Jianwei Qin ,Thomas F. Burks, Duke M.
Bulanon, “Classification of grapefruit peel diseases using color texture featureb analysis”,International Journal on Agriculture and Biological Engineering, Vol: 2, No: 3, September 2009.
[6] Muhammad Hameed Siddiqi, SuziahSulaiman, Ibrahima
Faye and Irshad Ahmad, “A Real Time Specific Weed Discrimination System Using Multi-Level Wavelet Decomposition,” International Journal of Agriculture & Biology, ISSN Print: 15608530; ISSN Online: 1814- 9596
[7] Sabine D. Bauer, FilipKorc, Wolfgang Forstner, “The
Potential of Automatic Methods of Classification to identify Leaf diseases from Multispectral images,” Published online: 26 January 2011, Springer Science+Business Media, LLC 2011, Precision Agric, DOI 10.1007/s11119-011-9217-6.
[8] H. Al-Hiary, S. Bani-Ah Mad, M. Reyalat, M. Braik and Z. A
L rahamneh, “Fast and Accurate Detection and Classification of Plant Diseases”, IJCA, 2011, 17(1), 31-38, IEEE-2010
[9] Bashir, S. and N. Sharma, 2012. "Remote Area Plant
Disease Detection Using Image Processing," (CiSE). Journal of Electronics and Communication Engineering, 2: 31-34.
[10] Wayne F. Wilcox, Grape disease control2013
Department of Plant Pathology, Cornell University, NY State Agricultural Experiment Station, Geneva NY 14456.
[11] A. Meunkaewjinda, P. Kumsawat, K. Attakitmongcol, and
A. Srikaew, “Grape leaf disease detection from color imagery using hybrid intelligent system”, in Proceedings of the 5th International Conference on Electrical Engineering/Electronics Computer, Telecommunications and Information Technology (ECTI-CON '08, IEEE, May 2008, ), pp. 513-516
[12] S. S. Sannakki, V. S. Rajpurohit, V. B. Nargund and P.
Kulkarni, "“Diagnosis and classification of grape leaf diseases using neural networks”," Computing,
Communications and NetworkingTechnologies
(ICCCNT),2013 Fourth International Conference on,Tiruchengode,2013,pp.1-5.doi:
10.1109/ICCCNT.2013.6726616
[13] Gonzalez, R. C. and Woods, R. E. [2008]. Digital Image
Processing, 3rd ed., Prentice Hall, Upper Saddle River, NJ.