© 2016, IRJET | Impact Factor value: 4.45 | ISO 9001:2008 Certified Journal | Page 1913
Vibration Analysis of Cracked Cantilever Beam for Varying Crack Size
And Location
Mr.Vikram S. Yendhe
1, Prof.V.L. Kadlag
2,Prof.R.S Shelke
31
PG Student, M.E. Mechanical (Design Engineering), Sir Visvesvaraya Institute of Technology, Nashik,422102
2,3
Professor Department of Mechanical Engineering, Sir Visvesvaraya Institute of Technology, Nashik,422102
---***---Abstract
- Early detection of damage is of special concernfor engineering structures. The traditional methods of damage detection include visual inspection or instrumental evaluation. A crack in a structural member introduces local flexibility that would affect vibration response of the structure. Damage detection is one of the important aspects in structural engineering for safety reasons. Main problem is to detect existence of a crack together with its location and depth in the structural member. Cracks in vibrating system can lead to a sudden and total failure from which recovery is impossible. This results in change inthe physical characteristics of a structure which in turn changes its dynamic response. Therefore there is need to know dynamics of cracked components. Depth of the crack and its location from fixed end are the main parameters for the vibrationanalysis. Therefore it becomes very important to have a watch on the changes in these parameters of the structure in order toaccess its reliability, performance and safety & to study the effect of the parameters on the natural frequency of beams. Thepurpose of this work is to monitor the vibration behavior of beams both experimentally and using FEM software ANSYS. Inthe present work, vibration analysis is carried out on different cantilever beams with transverse cracks and with differentboundary conditions. In future this analysis can be extended by considering different cross sections of the beam such ascircular, rectangular or trapezoidal with different materials.
Key Words: Rectangular Beam, Transverse cracks, Free Vibrations, Natural Frequencies, Vibration analysis.
1.
INTRODUCTION
Beams are widely used as structural element in civil, mechanical, naval, and aeronautical engineering. Damage is one of the important aspects in structural analysis and engineering. Damage analysis is done to promise the safety as well as economic growth of the industries. During operation, all structures are subjected to degenerative effects that may cause initiation of structural defects such as cracks which, as time progresses, lead to the catastrophic failure or breakdown of the structure. To
avoid the unexpected or sudden failure, earlier crack detection is essential. Taking this ideology into consideration crack detection is one of the most important domains for many researchers. Many researchers to develop various techniques for early detection of crack location, depth, size and pattern of damage in a structure. Many nondestructive methodologies for crack detection have been in use worldwide. However the vibration based method is fast and inexpensive for crack or damage identification. In this paper efforts have been made to present various cost effective reliable analytical numerical and experimental techniques.
Many researchers have been carried out in an attempt to find methods for non-destructive crack detection in structural members. Vibration-based methods have been proved as a fast and inexpensive means for crack identification. A crack in a structure induces a local flexibility which affects the dynamic behavior of the whole structure to a considerable degree. It results in reduction of natural frequencies and changes in mode shapes. The objective is to carry out vibration analysis on a cantilever beam having rectangular cross sections with and without crack. Here, depth of the crack and its distance from fixed end are varying parameters. The results of frequency are calculated by FEA software ANSYS and then it is compared with experimental results using FFT Analyzer.
2.
LITERATURE REVIEW
Pankaj charan jena et.al (2012)[1] concluded that faults detection of a single cracked beam by theoretical and experimental analysis using vibration signatures. The results of theoretical analysis and experimental analysis are compared and are found to be good correlation in between them.
Harish and Parhi, 2009[2] have performed analytical studies on fuzzy inference system for detection of crack location and crack depth of a cracked cantilever beam structure using six input parameters to the fuzzy membership functions
© 2016, IRJET | Impact Factor value: 4.45 | ISO 9001:2008 Certified Journal | Page 1914
Norhisham et al. 2007 [4] applied Artificial NeuralNetwork for damage detection. The developed approach was applied to detect simulated damage in a numerical steel portal frame model and also in a laboratory tested concrete slab.
Saridakis,2008[5] applied neural networks, genetic algorithms and fuzzy logic for the identification of cracks in shafts by using coupled response measurements. H. Nahvi et al. (2005)[6] finds results that the finite element model of the cracked beam is constructed and used to determine its natural frequencies and mode shapes.
Prashant M. Pawar et al. (2003)[7] studied the genetic fuzzy logic is one of the alternatives for NDT techniques in the areas where results are not predictable. The genetic fuzzy system greatly reduces the time needed to develop the rule base by optimally selecting the fuzzy sets. S.Orhan et al.[8] studied the order to identify the crack in a cantilever beam. Single- and two-edge cracks were evaluated. The study results suggest that free vibration analysis provides suitable information for the detection of single and two cracks.
F. Leonard et al.[10] proposed a study on spectrograms of the free-decay responses showed a time drift of the frequency and damping: the usual hypothesis of constant modal parameters is no longer appropriate, since the latter are revealed to be a function of the amplitude. Karthikeyan et al.[11] studied and establish an identification procedure for the detection, localization, and sizing of a flaw in a beam based on forced response measurements.
1.
MATERIAL AND METHODS
[image:2.595.84.549.200.806.2]Structural steel specimens are cut to size from ready-made rectangular bars. Total 5 specimens were cut to the size as length 700 mm and cross section area is 32mm×5mm. The modulus of elasticity and densities of beams have been measured to be 210 GPa and 7850 Kg/m3. The width of the Crack obtained there by is 0.25mm using wire cut EDM.
Table.1 Different Beam models with dimensions.
Beam No.
Cross section dimension
(mm)
Cracked/ Uncracked
Position and location of crack
Crack depth (mm)
Crack location
(mm)
1 32×5 Uncracked 0 0
2 32×5 Cracked 1 175
3 32×5 Cracked 2 175
4 32×5 Cracked 3 175
5 32×5 Cracked 1 350
6 32×5 Cracked 2 350
7 32×5 Cracked 3 350
8 32×5 Cracked 1 525
9 32×5 Cracked 2 525
10 32×5 Cracked 3 525
3.1
Analytical Method
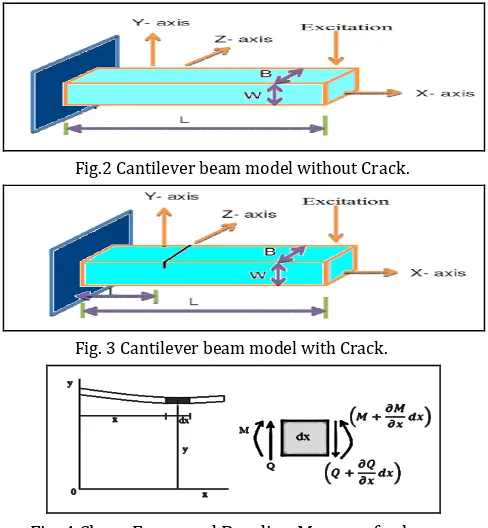
[image:2.595.314.558.212.476.2]Governing Equation For Free Vibration Of Beam .The Euler- Bernoulli beam model is used for the theoretical formulation. The crack in this particular case is assumed to be an open surface crack and the damping is not being considered in this theory. small element dx of beam is subjected to shear force Q and bending moment M, as shown in Fig. 4
Fig.2 Cantilever beam model without Crack.
Fig. 3 Cantilever beam model with Crack.
Fig. 4 Shear Force and Bending Moment for beam . The net force acting on the element,
(Equation 1)
Considering the moments about A, we get
or (Equation2)
From the above two equations 1 and 2, we get
(Equation 3)
We know from strength of materials that
So (Equation 4)
© 2016, IRJET | Impact Factor value: 4.45 | ISO 9001:2008 Certified Journal | Page 1915
(Equation 5). Thus the natural frequency can be calculated by this general equation,
(Equation 6)
Where,
C= Constant depending mode of vibration,
C1=0.56 for first mode,
C2= 3.52 for second mode,
C3= 9.82 for third mode.
Where, b= width of the beam, d= depth of the beam. Due to presence of crack, moment of inertia of the beam changes and correspondingly the natural frequency also changes. For a constant beam material and cross section the reduced moment of inertia will be found by relation below.
(Equation 7) Where,
I1=Moment of inertia of a cracked beam,
I=Moment of inertia of Uncracked beam, Ic=Moment of inertia of cracked beam element.
Table.2 Theoretical natural frequencies for the beam.
Beam Model
No. RCD RCL
First Natural Frequenc (fnf) Second Natural Frequency (snf) Third Natural Frequency (tnf)
1 0 0 8.53 53.62 149.61
2 0.2 0.25 8.49 53.40 148.98 3 0.4 0.25 8.25 51.88 144.24 4 0.6 0.25 7.54 47.46 132.39 5 0.2 0.5 8.49 53.40 148.98 6 0.4 0.5 8.25 51.88 144.24 7 0.6 0.75 7.54 47.46 132.39 8 0.2 0.75 8.49 53.40 148.98 9 0.4 0.75 8.25 51.88 144.24 10 0.6 0.75 7.54 47.46 132.39
3.1
Finite Element Modal Analysis of A Beam
Models
Finite element analysis has been carried out by ANSYS15.0 software. ANSYS is a general-purpose finite-element modeling package for numerically solving a wide variety of mechanical problems. Following steps show the guidelines for carrying out Modal analysis.
1.Set material preferences. (Structural steel)
2.Define constants & material properties. (Density, Young’s modulus, Poisson’s ratio)
3.Follow bottom up modelling and create/import the geometry.
4.Define element type. (Default mesh of element size 2mm.
5.Mesh the area.
6.Apply constraints to the model. (Fixed support at the end of beam)
7.Specify analysis types modal and options. 8. Solve
The ANSYS 15 finite element program was used for free vibration of the cracked beams.
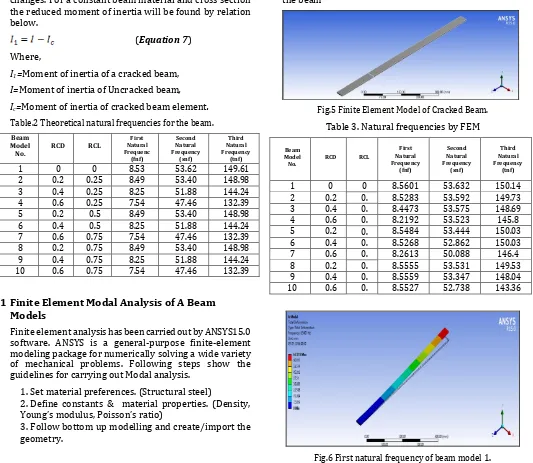
[image:3.595.33.566.310.773.2]For this purpose, the total 10 models are created at various crack positions in CAD software (Creo) and imported in ANSYS (.igs file). The beam model was discretised into no. of elements with N nodes. Cantilever boundary conditions can also be modelled by constraining all degrees of freedoms of the 4790 nodes and 588 elements located on beam. The subspace mode extraction method was used to calculate the natural frequencies of the beam
Fig.5 Finite Element Model of Cracked Beam. Table 3. Natural frequencies by FEM
Beam Model
No. RCD RCL
First Natural Frequency (fnf) Second Natural Frequency (snf) Third Natural Frequency (tnf)
1 0 0 8.5601 53.632 150.14 2 0.2 0.
25
8.5283 53.592 149.73 3 0.4 0.
25
8.4473 53.575 148.69 4 0.6 0.
25
8.2192 53.523 145.8 5 0.2 0.
5
8.5484 53.444 150.03 6 0.4 0.
5
8.5268 52.862 150.03 7 0.6 0.
75
8.2613 50.088 146.4 8 0.2 0.
75
8.5555 53.531 149.53 9 0.4 0.
75
8.5559 53.347 148.04 10 0.6 0.
75
8.5527 52.738 143.36
© 2016, IRJET | Impact Factor value: 4.45 | ISO 9001:2008 Certified Journal | Page 1916
Fig.7 Second natural frequency of beam model 1.
Fig. 8 Third natural frequency of beam model 1.
3.2
Experimental Modal Analysis
Experimental analysis was performed to find out the three modal transverse natural frequencies of a cracked cantilever beam. Experimental setup for performing the experiments is as shown in Fig.9. Several tests were conducted on cantilever beam specimens with single crack. It consist of following units.
1.FFT Analyzer with data handling unit
This is the main part of FFT analyzer system. It consists of function generator ,data processing unit, A/D converter, memory unit together called as FFT analyzer. The function generator generates the sine function required as per the input signal. The analyzer for experimentation is four-channel spectrum analyzer data collector and balance with software along with acceleration sensor sensitivity 100 m V/g (g=9.81 m/s2)
2.Impact Hammer
It is used to provide an impact on beam for excitation. The impact is positioned such that the mode cannot present at impact position.. It has Measuring range up to 2000N with cable and other accessories and sensitivity at 100 Hz=2mV/N. the overload capacity is 500N with Resonance frequency = 27 KHz, hammer mass=100 gm, Rigidity=0.8 KN/Micron, temperature range = - 20 to 70 0c.
3.Accelerometer with cable arrangement
The microphone type sensor with cable arrangement is used to measure the input signal. The sensitivity of sensor is 46.17 mV/Pa. The Sensor senses the exciting signal i.e.
acoustic sound and amplitude of input signal and transferred to FFT unit for further processing to obtain the appropriate results.
Fig.9 Experimental setup for measuring Natural Frequency.
4.FFT Analyser
Specifications of the FFT Analyser:
Model - OR34 (4 Channel)
Power - <15VA
External Power Supply- 100 to 240VAC
Frequency- 47 to 63 Hz
UPS- Internal NiMH
Battery
5.Software interfacing module
The processing and results of experiment are stored in the memory unit of FFT analyzer. Such results can obtain for hard copy by use of software interfacing module. The software interfacing module converts results in a graphical interface and use for windowing and hard copy from computers and hardware.
Table.4 Experimental natural frequencies for the beam
Beam Model
No. RCD RCL
First Natural Frequency
(fnf)
Second Natural Frequency
(snf)
Third Natural Frequency
(tnf)
1 0 0 8.6 55.75 151.25
2 0.2 0.25 8.5 55 146
3 0.4 0.25 12.5 53.75 145.25 4 0.6 0.25 8.5 53.5 141.5 5 0.2 0.5 8.75 57.5 155 6 0.4 0.5 8.5 52.5 146.25
7 0.6 0.75 7.5 50 140
8 0.2 0.75 10 55 157.5
© 2016, IRJET | Impact Factor value: 4.45 | ISO 9001:2008 Certified Journal | Page 1917
4.
RESULTS AND DISCUSSION
[image:5.595.44.562.269.793.2]The natural frequency decreases as the crack depth increases in a structural part. Firstly determination of natural frequency of different modes of vibration is done for un-cracked beam theoretically (then FEA analysis in ANSYS and by using FFT analyzer in experimental work. Here total 10 models have been used taking different combinations of relative crack location and relative crack depth. Certain steps are followed to carry on analysis by FFT analyzer for experimentation. It is clear from analysis that the natural frequency of different modes of vibration can be precisely obtained from these methods and tabulated in tables. A comparison is made in between theoretical values of natural frequencies with the ANSYS values of natural frequencies and experimental values of natural frequencies. The result shows that all the values obtained by three methods are closed to the agreement.
Table.5 FEM & Experimental First natural frequency.
RCD RCL FNF(Hz)
FEM Experimental % Error
0 0 8.5601 8.6 -0.47
0.2 0.25 8.5283 8.5 0.33
0.4 0.25 8.4473 12.5 -47.98
0.6 0.25 8.2192 8.5 -3.42
0.2 0.5 8.5484 8.75 -2.36
0.4 0.5 8.5268 8.5 0.31
0.6 0.5 8.2613 7.5 9.22
0.2 0.75 8.5555 10 -16.88
0.4 0.75 8.5559 8.75 -2.27
0.6 0.75 8.5527 6.25 26.92 Table.6 FEM & Experimental Second natural frequency.
RCD RCL SNF(Hz)
FEM Experimentall % Error
fhEError
0 0 53.632 55.75 -3.95
0.2 0.25 53.592 55 -2.63
0.4 0.25 53.575 53.75 -0.33
0.6 0.25 53.523 53.5 0.04
0.2 0.5 53.444 57.5 -7.59
0.4 0.5 52.862 52.5 0.68
0.6 0.5 50.088 50 0.18
0.2 0.75 53.531 55 -2.74
0.4 0.75 53.347 46.25 13.30
0.6 0.75 52.738 45 14.67
Table.7 FEM & Experimental Third natural frequency RC
D RCL FEM Experimentall SNF(Hz) % Error
fhEError
0 0 150.1
4 151.25 -0.74
0.2 0.2
5 149.73 146 2.49
0.4 0.2
5 148.69 145.25 2.31 0.6 0.2
5 145.8 141.5 2.95
0.2 0.5 150.0
3 155 -3.31
0.4 0.5 150.0
3 146.25 2.52
0.6 0.5 146.4 140 4.37
0.2 0.7
5 149.53 157.5 -5.33 0.4 0.7
5 148.04 148.75 -0.48 0.6 0.7
5 143.36 147.5 -2.89
Figure shows curve fitting for natural frequency versus Relative crack depths and natural frequency versus Relative crack location.
Fig.10 Variation of First Natural Frequency(RCL=0.25).
Fig.11 Variation of First Natural Frequency(RCL=0.5).
Fig.12 Variation of First Natural Frequency (RCL=0.75).
© 2016, IRJET | Impact Factor value: 4.45 | ISO 9001:2008 Certified Journal | Page 1918
Fig.14 Variation of Second Natural Frequency (RCL=0.5).
Fig.15 Variation of Second Natural Frequency (RCL=0.75).
Fig.16 Variation of Third Natural Frequency (RCL=0.25)
Fig.17 Variation of Third Natural Frequency(RCL=0.5).
Fig.18 Variation of Third Natural Frequency(RCL=0.75).
Fig.19 Variation of First Natural Frequency with RCD=0.2
Fig.20 Variation of First Natural Frequency with RCD=0.4
Fig.21 Variation of First Natural Frequency with RCL=0.6
Fig.22 Variation of Second Natural Frequency(RCD=0.2)
© 2016, IRJET | Impact Factor value: 4.45 | ISO 9001:2008 Certified Journal | Page 1919
Fig.24 Variation of Second Natural Frequency with RCD=0.6.
Fig.25 Variation of Third Natural Frequency with RCD=0.2.
Fig.26 Variation of Third Natural Frequency with RCD=0.4.
Fig.27 Variation of Third Natural Frequency with RCD=0.6.
6.CONCLUSIONS
The present investigation based on the theoretical, FEA and experimental analysis draws the following conclusions.
Inputs for FEA and FFT are crack location and crack depth and outputs are natural frequency for different modes.
The results show that the values of natural frequencies by theory, ANSYS and FFT are close to the agreement. It has been observed that the change in frequencies is not
only a function of crack depth, and crack location, but also of the mode number.
As largest effects are observed at the Centre for simply supported beam and at the fixed end for the cantilever beam we can say, decrease in frequencies is more for a crack located where the bending moment is higher. In actual practice structural members such as beams are
highly susceptible to transverse cross sectional cracks due to fatigue. Therefore this study can be further extended to beams with multiple cracks
When the crack location is constant but the crack depth increases, the natural frequency of the beam decreases. When the crack depth is constant and crack location from
the cantilever end varied, Natural frequencies of first, second and third modes are also increased.
REFERENCES
[1]Pankaj Charan Jena, Dayal R. Parhi, Goutam Pohit, Faults
detection of a single cracked beam by theoretical and experimental analysis usingvibration signatures, IOSR Journal of Mechanical and Civil Engineering (IOSR-JMCE), Volume 4, Issue 3,pp. 01 -18,2012
[2]Parhi DR K, Amiya KD(2009). ‘Analysis of methodologies
applied for diagnosis of fault in Vibrating structures’ , Int. J. Vehicle Noise Vib., 5(4):271- 286.
[3]Mohammad T, Vakil B(2008). ‘ Crack detection in beam-
like structures using genetic algorithms’ , Appl. Soft Comput.,8(2):1150- 1160.
[4]Norhisham B, Hong H, Andrew JD(2007). ‘ Damage
detection using artificial neural network with consideration of uncertainties’ ,Eng. Struct., 29(11):2806- 2815.
[5]Saridakis KM(2008). ‘ Applying neural networks, genetic
algorithm and fuzzy logic for the identification of cracks in shafts by using coupled response measurements’ , Comput. Struct., 86(11- 12):1318- 1338.
[6]H. Nahvi and M. Jabbari (2005).”Crack detection in beams
using experimental modal data and finite element model”. International Journal of Mechanical Sciences Volume 47, Issue 10, Pages 1477-1497.
[7]Prashant M. Pawar and Ganguli (2003) "Strucrural heath
monitoring using fuzzy logic technique International Journal of Mechanical Sciences Volume 41, Issues 3-4 Pages 742-749.
[8]S a d e t t i n Orhan(2007).”Analysis of free and
forced vibration of a cracked cantilever beam”. NDT & E International Volume 40, Issue 6, Pages 443-450.
[9]F Leonard,J Lanteigne, S Lalonde and Y