© 2015, IRJET ISO 9001:2008 Certified Journal
Page 861
1-D Flow Predictions in Compound Channel using MATLAB
Jarmina Nake
1, Dr. Mimi Das Saikia
2M.Tech student, Civil engineering, Assam downtown University, Guwahati, Assam, INDIA
1Professor, Civil engineering, Assam downtown University, Guwahati, Assam, INDIA
2---***---Abstract -
Most of the rivers have cross sectionalgeometry of a compound section where a deep main channel is bounded by shallow adjacent floodplains. Suitableestimation of discharge in compound channels is truly necessary for the design, operation and maintenance of the channels, utmost to prediction of flood. Generally compound channels have been analyzed by dividing the compound cross-section into relative sub-areas which are easier to analyze. In this paper the traditional one dimensional (1-D) method for estimating discharge capacity of straight compound channels are reviewed and applied to overbank flows in straight fixed compound channels. The predictive accuracy of these formulae was analysed by developing software using MATLAB with the help of experimental data obtained from the compound channel section of University of Birmingham. The accuracy of these methods to predict the total cross-section discharge is evaluated.
Key words:
Flow prediction, Compound channel, 1-D methods, Single Channel Method (SCM), Divided channel Method (DCM), Coherence Method (COHM).1.
INTRODUCTION
In general, rivers or artificial channels are composed of a deep main channel and shallow flood plains which are very important for environmental and design issues. Therefore, it is essential to understand the flow mechanism of rivers in both their in-bank and overbank conditions. During heavy rainfall, both natural and manmade channels often overtop their banks, such that enormous discharge in a particular river may reach the bank-full condition rapidly and the flow passes over onto the floodplain resulting in extensive damage. In this case, the prediction of discharge is more complex than that when the river is flowing just in-bank. In
the past years, many methods for computing prediction of flow have been developed based on either one-dimensional (1-D), or two (2-D) and three-dimensional (3-D) hydrodynamic approaches. The 1-D approach remains most efficient from the computational effectiveness, less data requirement and especially for real-time operation point of view.
In the scientific-technical years, MATLAB has evolved into an indispensable tool because it allows a great advantage by processing the data superficially effective. It provides an extensive treatment of methods and techniques required to generate graphics of curves and surfaces by coding which is an effective tool for presentation and aid to application development.
2.
LITERATURE REVIEW
Many practical problems in river engineering require accurate prediction of discharge capacity in compound channels as it is extremely essential to imply in flood mitigation schemes. (Sellin, 1964) showed that Large-scale turbulence associated with significant momentum transfer leads to the decrease in total conveyance of the section. Several attempts have been made at quantifying the interaction between the main channel and floodplain Sellin, 1964; Zheleznyakov, 1971; Myers, 1978; Rajaratnam and Ahmadi 1979; Knight and Demetriou, 1983; Ackers, 1991; 1993. Sellin (1964), Zheleznyakov (1965), Van Prooijen (2005) noted experimental studies indicating that lateral momentum transfer occurs between the main channel and flood plain and generally slows down the flow in the main channel while accelerating the flow into the flood plain. Knight and Brown, 1999; Lyness
© 2015, IRJET ISO 9001:2008 Certified Journal
Page 862
design purposes due to calibration requirements. GalipSeckin et al., (2008; revised in 2009) analyses two-dimensional (2-D) formulae for estimating discharge capacity of straight compound channels. Zhonghua Yang Wei Gao et al., (2011) based on the energy concept developed a model to estimate discharge in which energy loss and the transition mechanism were analyzed. Md. Abdullah Al Amin et al., (2013) concluded that that the discharge always increases with the increase of depth ratio in compound meandering channel i.e. At low depth ratio, discharge decreases with the increase of width ratio but for higher depth ratio, discharge increases with the increase of width ratio. J.N. Fernandes et al., (2015) assessed the accuracy of 1-D methods by comparing their predictions with a large experimental dataset and thus concluded that those methods that account for the momentum transfer between the main channel and the floodplains shows considerably better results than the traditional methods.
3.
METHODOLOGY
3.1. Governing Equations for 1-D method
3.1.1 Single Channel Method (SCM)
Cross sections of these compound channels are generally characterized by deep main channel bounded by one or both sides by a relatively shallow flood plain. SCM includes assuming only one section taking into account average roughness coefficient and velocity for the whole section. Chow (1959) suggested that, Manning's equation (1) is used to predict discharge capacity at low depths when the flow is only in main channel.
2 1 3 2 1 S R n
Q (1)
Where, Q = Overall discharge of the compound channel, A = cross-sectional area, R is hydraulic radius, S = Slope of the main channel, and n = composite Manning’s coefficient.
3.1.2. Divided Channel Method (DCM)
The usual practice of calculating discharge in a compound channel is the use of DCM. Assumed vertical, horizontal or diagonal interface planes running from the main channel-floodplain junctions are used to divide the compound section into subsections and the discharge for each
subsection is calculated.
2 1 0 3 2 1 S A R n Q
Q i i
i i i i
(2)
Where, i = indicating each sub-areas.
3.1.3. Coherence Method (COHM)
The coherence method uses two empirical coefficients for the adjustment of the sub- section discharges, basic conveyance by treating the channel as a single unit to that calculated by summing the basic conveyance of the separate zones. DCM SCM Q Q COH (3)
The coefficient closest to 1, it is most appropriate to treat the channel as a single one. When this coefficient is less than 1 it is necessary to apply a different coefficient, called DISADF so as to correct the discharge in each sub-section. The formulas for computing the DISADF in each flow region Ackers (1993).
DISDEF Q
Q DCM for flow region 1
(4)
DISADF Q
Q DCM for flow region 2 to 4
(5)
where, DISDEF is called Discharge Deficit factor.
4.
EXPERIMENTAL DETAILS FOR ANALYSIS
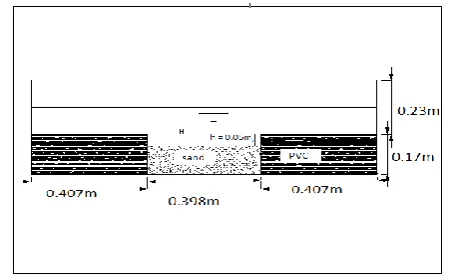
[image:2.595.320.547.587.727.2]The experiment data available in literature (Galip Seckin, et al., December, 2009) acquired from channel facility of Hydraulics laboratory of Birmingham University have been taken here for analysis of the developed 1D models of flow prediction for compound channel in MATLAB. Six series of experimental data were considered for analysis in this paper. The flume consist of test length 18m and 1.213m wide comprising a 50 mm depth, 398mm width main channel and two rigid side channels of 407.3mm width as shown in Fig.1. The slope of the channel was adjusted to 2.024103as to produce a uniform flow conditions. PVC material was used as cover for smooth main channel and flood plain. And for roughened main channel and flood plain A-frames of aluminum wire grids were used during the experiment.
© 2015, IRJET ISO 9001:2008 Certified Journal
Page 863
Table – 1: Depth-Discharge Relationship for each test.Test No Discharge (m3/s)
R2
F 1 F 2 F 3 F 4 F 5
F 6 0.9971
0.015-0.035 0.062-0.104 H = 0.8363Q0.6197 0.9985 0.015-0.050 0.065-0.168 H = 1.7909Q0.7995 0.9921
Depth (m) Equation
0.011-0.027 0.071-0.141 H = 2.2867Q0.7698
FLOW CONDITIONS
0.010-0.035 0.071-0.163 H = 1.58Q0.6829 0.9929 0.015-0.050 0.061-0.106 H = 0.0474 Q0.4489 0.9969 0.015-0.055 0.060-0.095 H = 0.267Q0.3672 0.9973
STAGE - DISCHARGE RELATIONSHIP FOR EACH TEST CASE
smooth smooth rough rough
rough rough rough rough smooth smooth Boundary Conditions
Main Channel Flood plains
smooth smooth
where ‘F’ denotes fixed bed experimental data. Depth-discharge predictions for the above mentioned six experimental data has been represented in section 4.1 graphically using the 1-D flow prediction software developed in MATLAB.
4.1 Flow Predictions in Compound Channel by 1-D
methods.
In this paper flow prediction for the above mentioned laboratory channel have been presented using the methods presented in section 3. In this particular paper SCM, DCM, and COHM methods have been taken for analysis of flow prediction and the computed discharges are then compared with the experimental data.
4.1.1 Single Channel Method (SCM).
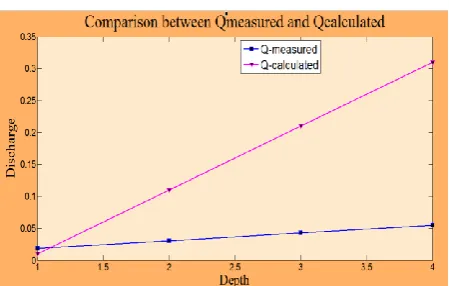
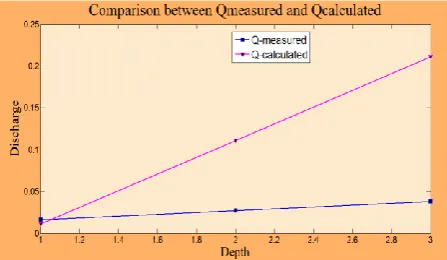
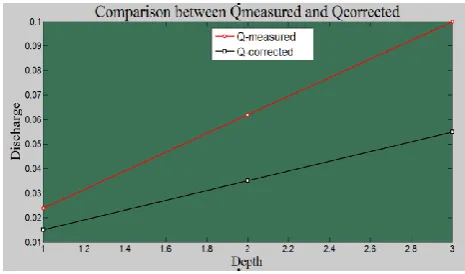
The Computed discharges by SCM method using MATLAB has been compared and presented graphically in figures 2 to 7 for the entire six test cases.
[image:3.595.311.546.269.408.2]Fig - 2: Flow predictions by SCM for Test no. F1
[image:3.595.311.549.437.567.2]Fig - 3: Flow predictions by SCM for Test no. F2
Fig - 4: Flow predictions by SCM Test no. F3
Fig - 5: Flow predictions by SCM for Test no. F4
[image:3.595.41.277.542.681.2] [image:3.595.313.538.597.740.2]© 2015, IRJET ISO 9001:2008 Certified Journal
Page 864
Fig - 7: Flow predictions by SCM for Test no. F64.1.2 Divided Channel Method (DCM).
The Computed discharges by DCM method using MATLAB has been compared and presented graphically in figures 8 to 13 for the entire six test cases.
[image:4.595.319.556.259.398.2]Fig - 8: Flow predictions by DCM for Test no. F1
[image:4.595.49.280.383.526.2]Fig - 9: Flow predictions by DCM for Test no. F2
[image:4.595.320.557.432.565.2]Fig - 10: Flow predictions by DCM for Test no. F3
Fig - 11: Flow predictions by DCM for Test no. F4
Fig - 12: Flow predictions by DCM for Test no. F5
[image:4.595.50.280.558.699.2] [image:4.595.324.550.595.732.2]© 2015, IRJET ISO 9001:2008 Certified Journal
Page 865
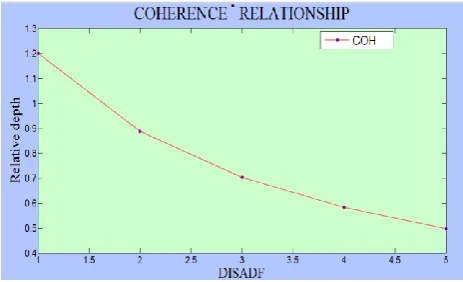
4.1.3 Coherence Method (COHM) [image:5.595.322.558.97.220.2]The Computed coherence ratio using MATLAB has been presented graphically in figures 14 to 19 for the entire six test cases.
[image:5.595.42.274.167.295.2]Fig - 14: Coherence ratio computation for Test no. F1
Fig - 15: Coherence ratio computation for Test no. F2
[image:5.595.324.556.251.374.2]Fig - 16: Coherence ratio computation for Test no. F3
[image:5.595.42.279.353.486.2]Fig - 17: Coherence ratio computation Test no. F4
Fig - 18: Coherence ratio for Test no. F5
Fig - 19: Coherence ratio computation for Test no. F6
[image:5.595.317.556.407.525.2] [image:5.595.49.281.543.684.2]© 2015, IRJET ISO 9001:2008 Certified Journal
Page 866
Fig - 20: Flow predictions by COHM for Test no. F1Fig - 21: Flow predictions by COHM for Test no. F2
Fig - 22: Flow predictions by COHM for Test no. F3
[image:6.595.318.553.264.400.2]Fig - 23: Flow predictions by COHM for Test no. F4
Fig - 24: Flow predictions by COHM for Test no. F5
Fig - 25: Flow predictions by COHM for Test no. F6
5.
ACCURACY OF 1-D COMPOUND CHANNEL
FLOW PREDICTION METHODS
Different papers and journals have been brought forward by various researchers on the discharge computation using 1-D methods taking into consideration the complexities in an open channel flows .In this paper the accuracy of 1-D methods (SCM, DCM, COHM) is evaluated by comparing their predictions with experimental data in MATLAB.
The accuracy by each method is based on the calculation errors computed by equation (6)
100
(%)
measured calculated measured
Q Q Q
Error (6)
Where, Measured
[image:6.595.46.280.429.560.2] [image:6.595.46.279.592.729.2]© 2015, IRJET ISO 9001:2008 Certified Journal
Page 867
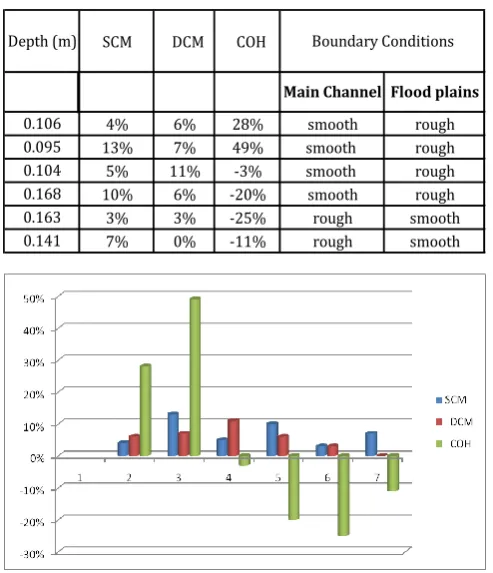
The complete results of these errors are presented in [image:7.595.39.286.155.442.2]Table 2.
Table – 2: Errors obtained by applying 1-D method.
SCM DCM COH
4% 6% 28%
13% 7% 49% 5% 11% -3% 10% 6% -20%
3% 3% -25%
7% 0% -11% rough smooth smooth rough
smooth rough rough smooth 0.104 0.168 0.163 0.141
Depth (m) Boundary Conditions
0.106 0.095
Main Channel Flood plains
smooth rough smooth rough
Fig – 26: Graphical presentation of errors in the calculation of discharges
When the channel is smooth along the entire perimeter DCM shows error of 0.001% implying possibility accurate accuracy of flow prediction. However, error is even bigger with rough flood plains up to 11%. The errors decrease with the relative depth for smooth flood plains and increase with roughness in the flood plains. Among these three 1-D methods (SCM, DCM, and COHM) after computation, DCM shows the least error even up to 0.001% for the calculation in total discharge.
The results of the smooth floodplain condition are observed to give appreciable agreement with the experimental data. However unavoidable discrepancies still occur when the channel bottom constitutes different roughness.
6.
CONCLUSION
This paper comprises detail study of flow prediction of 1-D methods and its graphical demonstration using experimental data acquired from channel facility of Hydraulics laboratory of Birmingham University. Softwares have been developed using MATLAB and depth- discharge curves has been presented graphically. In this
study an attempt has been made to address the prediction of discharge to make proper discharge such that it can predict the flood appropriately.
Based on computation of experimental data, evaluating the effectiveness Discharge Channel Method (DCM) is more reliable in proper flow prediction compared to other 1-D methods studied in this paper. The 1-D approach remains the most efficient because of the data requirement and computational effectiveness, especially for real time operation.
ACKNOWLEDGMENTS
The research was done as part of the project Analytical study and modeling of prediction of flow and resistance on compound channel flow. The authors convey their sincere gratitude to Birmingham University for enabling to acquire the experimental data for analysis. The authors also wish to acknowledge the support and research facilities to Assam Downtown University, Guwahati, India.
REFERENCES
[1] Ackers P 1993 Flow formulae for straight two-stage channels. J. Hydraulic Res. 31(4): 509–531
[2] Chow V. T. Open Channel Hydraulics, Mc Graw-Hill, 1959.
[3] Galip Seckin
,
Mustafa Mamak, Serter Atabay And Mazen Omran 2009 Discharge in compound channelswith fixed and mobile beds Vol.34, Part 6, pp.923– 945. Indian Academy of Sciences[4] J.N. Fernandes, J.B. Leal, A.H. Cardoso 2015 Assement of stage-discharge predictors for compound open- channels Vol.45, pp. 62-67
[5] Knight D W, Demetriou J D 1983 Floodplain and main channel flow interaction. J.Hydraulic Eng.109: 1073– 1092.
[6] Knight D W, Brown F A, Ayyoubzadeh S A, Atabay S 1999 Sediment transport in river models with overbank flow. Proc. Of 7th International Symposium on River
Sedimentation, Hong Kong: 19–25
[7] Md. Abdullah Al Amin, Dr. Md. S. M. Khan 2013 Experimental Study of Discharge in a Characteristics Compound Meandering River American Journal of Engineering Research (AJER) e-ISSN : 2320-0847 p-ISSN : 2320-0936 Volume-02, Issue-07, pp-136-140 www.ajer.org
© 2015, IRJET ISO 9001:2008 Certified Journal
Page 868
compound river channels. Journal of HydraulicResearch,Vol.39,N°3, pp. 311-319.
[9] Myers W R C 1978 Momentum transfer in a compound channel.J. Hydraulic Res. 16: 139-150
[10] Rajaratnam N and Ahmadi R M 1979 Interaction between main channel and floodplain flows, Jour. Hyd. Div., Amer. Soc.Civ.Engrs., Vol. 105 pp. 573-588.
[11] Sahu Mrutyunjaya, Prediction of flows and resistance in compound open channel, 2011, National Institute of Technology Rourkela, India
[12] Seckin G 2004 A comparison of one-dimensional methods for estimating discharge capacity of straight compound channels. Canad. J. Civil Eng. 31: 619–631
[13] Sellin R H J 1964 A laboratory investigation into the interaction between flow in the channel of a river and that of its floodplain. La Houille Blanche 7: 793–801
[14] Van Prooijen B C et al., 2005 Momentum exchange in straight uniform compound channel flow. J. Hydraulic Eng. 131: 175-183
[15] Zheleznyakov G V 1971 Interaction of channel and flood plain flows. Proc. of the 14th International Conference of the International Association for Hydraulic Research, Paris : 144–148
[16] Zhonghua Yang, Wei Gao Wenxin Huai 2011 Estimation of discharge in compound channels based on energy concept. pp 105-113
BIOGRAPHIES
Jarmina Nake completed her B.E degree in Civil engineering from
Visvesvaraya Technological
University, Belgaum (Karnataka, India) in 2014. And presently she is pursuing M.tech degree from Assam Down town University, Guwahati, Assam, India.
Prof.(Dr.) Mimi Das Saikia, B.E.(Civil
Engg.)(AEC,GU), M.E. (Water
Resources Engg.) (AEC, GU), Ph.D. (IIT Guwahati
Professor in the Department of Civil Engineering, Assam down town University, Guwahati, Assam, India.