Munich Personal RePEc Archive
India’s Increased International
Integration and the Financial Crisis: Has
India Become More Prone to External
Shocks?
Sircar, Jyotirmoy
Centre for Development Studies (Jawaharlal Nehru University),
India
18 June 2010
India’s
Increased
International
Integration
and
the
Financial
Crisis:
Has
India
Become
More
Prone
to
External
Shocks?
Jyotirmoy Sircar1
1
Centre for Development Studies, Trivandrum, India. s_jyotirmoy@yahoo.com I am greatly indebted to Prof. Sunil Mani for his various inputs and suggestions.
Abstract:
This paper looks at the impact of the global financial crisis on the Indian Economy via the three potential channels of contagion namely the trade channel, the financial channel and the confidence channel. We do so by analyzing the quarterly data of India’s Balance of Payments (BOP) for the time period 2007-2008 to 2009-2010. We come to the conclusion that India has become more prone to external shocks which is but natural with increased integration with the world economy and particularly financial integration. However the economy was already experiencing a downturn two quarters before the onset of the effects of the crisis on the Indian Economy and hence, at best, we can say that due to the crisis the downturn got accentuated for a few more quarters. The economy also seems to have recovered within a short period of time.
Introduction:
The starting point of the global financial crisis can be pinned down to the U.S. subprime mortgage2 market in Aug 2007. The complex credit instruments (Mortgage Backed Securities) backed by these mortgages turned illiquid as the homeowners were unable to repay their mortgage payments. Soon it spread to markets for other complex securities which in turn were backed by the Mortgage Backed Securities and turned those markets illiquid as well. The crisis spread very quickly from the U.S. to other western developed nations and resulted in a complete meltdown of the western economies.3 For nearly a year or so it was thought that that the big Asian economies like India and China would remain insulated from the global financial crisis. This kind of unwarranted optimism was based on the so called “Decoupling Hypothesis” which was quite fashionable even during the first year of the crisis4. The hypothesis basically stated that even if the advanced western economies went into a downturn the Emerging Market Economies (EMEs) in Asia would be unaffected due to their substantial foreign exchange reserves, improved policy framework, robust corporate balance sheets and relatively healthy banking sector. Further these economies alongwith the ASEAN-5 would also act as shock absorbers and might even pull the western economies out of the recession (Nachane, 2009). However ever since the effects of the crisis started percolating to the Indian economy in around September 2008 the many shortcomings of the theory have been laid threadbare.
That India is increasingly getting more and more integrated (especially in the last decade) with the world economy is a stylized fact. If we take an expanded measure of globalization, that is the ratio of total external transactions (gross current account flows plus gross capital flows) to GDP, this ratio has more than doubled from 46.8 per cent in 1997-98 to 117.4 per cent in 2007-08 (Subbarao, 2009). The crisis affected India through all the three potential channels of contagion namely the trade channel (comprising of both merchandise and invisibles), the financial channel and the confidence channel (Subbarao, 2009). Here it must be mentioned that the financial channel and confidence channel are intertwined in the sense that higher levels of confidence among investors leads to higher inflow of capital and vice versa. Here an essential fact about the nature of the spreading of the crisis must be pointed out. In the western economies the crisis spread from the financial sector to the real sector whereas in the case of India it was the exact opposite. The Indian economy was initially affected through a reversal of capital flows, rupee depreciation and stock market decline. Thereafter, especially after the collapse of Lehman Brothers, the real sector was affected through a fall in exports and general risk aversion.
Quite a few studies have been undertaken to examine the impact of the crisis on the Indian Economy. Rakshit (2009) points out that the decline in Economic performance of the country
2
By subprime mortgages we mean mortgages which have a very high risk of default.
3
For a detailed account as to how the crisis unravelled see Panic: The Story of Modern Financial Insanity.
was not entirely due to the crisis although the crisis did have an impact especially from the Q3 of 2007-08. Also Mohan (2009) opines that India will not escape from the crisis as overseas finance had become increasingly important for Indian corporate and its drying up would definitely affect India; there was a broader impact too arising from declining stock prices and tightening of liquidity. Further Nachane (2009) posits that there was a significant decline in exports and FII flows as well as a slight contamination of the financial system. Also Indian equity and currency markets have exhibited considerable volatility. Finally Ghosh & Chandrasekhar (2009) point out that there has been a considerable slowdown in exports plus the financial sector has been badly hit especially capital flows.
Impact on the Indian economy:
In order to understand the impact of the crisis on the economy and how it is currently coping with the crisis, we will go in for an extensive Balance of Payments (BOP) analysis at the disaggregated level. We will be analyzing the data of 10 quarters from Q1 of 2007-2008 to Q2 of 2009-2010. We consciously include two quarters before the crisis actually hit India (Q3 of 2007-08) so that we can see how badly the crisis affected the economy. However in case of merchandize we will have to make do with annual data of the specified time period. We will first analyse the current account, then the capital account and finally proceed to the changes in foreign exchange reserves.
Table 1: Gems & jewellery5
Time line Exports (US $
Billion)
Imports ( US $ Billion)
2006-2007 16.7 7.5
2007-2008 19.7 8.0
2008-2009 28.0 16.6
Source: DGCI & S
From table 1 we can clearly see that gems & jewellery sector seems to have completely recovered from the setbacks it suffered due to the crisis as imports increased by a staggering 100 percent and exports surged by almost 42 percent in 2008-09. In 2007-08 the increase in imports was 6 percent and that in exports was nearly 18 percent.
Next we move to table 2 which depicts exports of cotton and textiles. Here we can see that growth in exports has stagnated in 2008-09 because of the crisis. While exports grew by 11 % in 2007-08, it increased by a meager 3% in 2008-09.
Table 2: Cotton & textiles
Time line Exports (US $
Billion)
2006-2007 17.4
2007-2008 19.4
2008-2009 20.0
Source: DGCI & S
Finally we look at leather and leather products which is given in table 3.
[image:6.612.177.422.460.620.2]
Table 3: Leather & leather products
Time line Exports (US $ Million)
2006-2007 3059.43
2007-2008 3548.51
2008-2009 3598.64
Source: DGCI&S
Here in table 3 we can see that the exports of leather and leather products have remained more or less the same in 2007-08 and 2008-09 due to the crisis. The annual growth in exports in 20007-08 was around 13.8 % as compared to a measly 1.3 % in 2020007-08-09.
With respect to all the three sectors we are not focusing on the employment dimension which is beyond the scope of the paper. However one can argue that growth in employment is directly related to growth in exports because during the time when exports of these commodities went down, the employment in these sectors also shrinked.
Next we come to invisibles which comprises of services, transfers and income6. The overall trend of invisibles and its three components is given in chart 1 in the next page:
Chart 1: INVISIBLES (NET US $ Million)
Source: RBI Database
At the aggregate level invisibles has increased from 15130 US $ Million in Q1 of 2007-08 to 19576 US $ Million in Q2 of 2009-10 i.e. an increase of around 22.7%. However it also important to notice that it fell from a high of 26546 US $ Million in Q2 of 2008-09 to 19576 US $ Million in Q2 of 2009-10. At the aggregate level services also seems to experience sharp rise and fall on two occasions. It fell from 12026 US $ Million in Q3 of 2007-08 to 7567 US $ Million in the subsequent quarter and again rose to 14400 US $ Million in Q2 of 2008-09 and has been on a declining trend ever since. Overall services have declined from 8974 US $ Million to 6273 US $ Million from Q1 of 2007-08 to Q2 of 2009-10. On the other hand transfers has increased from 8974 US $ Million in Q1 of 2007-08 to 13702 US $ Million. However the exact effects of the crisis on invisibles can only be found out at a further disaggregated level.
First we analyse services whose important disaggregated items are travel, transportation and miscellaneous7. Chart 2 shows miscellaneous for the 10 quarters we are considering for our analysis. Again it can further disaggregated into 4 items8 of which miscellaneous services of
7
We can ignore insurance & GNIE in the Indian context.
8
Here we exclude miscellaneous of which financial services and of which communication services as they are not important.
0 5000 10000 15000 20000 25000 30000
which software services and miscellaneous services of which business services are the significant items to be considered in our analysis.
Chart 2: Miscellaneous (NET US $ Million)
Source: RBI Database
In chart 2 we can clearly see that at the aggregate level miscellaneous items has declined from 9628 US $ Million in Q1 of 2007-08 to 5787 US $ Million in Q2 of 2009-10 which is a huge decline of 41.4%. Here we can clearly see the effects of the crisis as miscellaneous declined sharply from 11202 US $ Million in Q3 of 2007-08 when the crisis hit India to 6758 US $ Million in the following quarter. At the disaggregate level we can see that software services actually increased from 8756 US $ Million in Q3 of 2007-08 to 12080 US $ Million in the next quarter. Now this seems to be quite counterintuitive as the effects of the crisis hit India in around the third quarter of 2007-08. However it is not so because there is a time dimension associated with software services in the sense that contracts are typically signed for two to three years. Thus this increase was on account of the contracts which had already been signed and the effect of the crisis would logically be on the renewal of contracts and signing of new ones. As the crisis started getting worse in the west, these companies didn’t sign any new contracts as a result of which software services have been coming down ever since the Q4 of 2007-08. Overall (however) it has increased from 8157 US $ Million to 10207 US $ Million in Q2 of 2009-2010
‐4000
‐2000 0 2000 4000 6000 8000 10000 12000 14000 16000
i.e. an increase is of about 25% which is not all bad considering the severity the crisis. As far as business services are concerned they declined by a huge 254% from 595 US $ Million to -2109 US $ Million due to the crisis!
Next we come to chart 3 which shows travel and transportation:
Chart 3: Travel & Transportation (NET US $ Million)
Source: RBI Database
Although both these components contribute very little to the Indian economy they are nevertheless important as they got affected by the crisis. As far as travel is concerned it came down sharply from 876 US $ Million in Q3 of 2007-08 when the crisis hit India US $ Million to 75 US $ Million in Q2 of 2008-09.9 Overall it declined slightly by around 30% from 182 US $ Million in Q1 of 2007-08 to 126 US $ Million in Q2 of 2009-10. On the other hand transportation actually increased from -543 US $ Million in Q1 of 2007-08 to 346 US $ Million in Q2 of 2009-10. One of the primary reasons for this increase (around 163%) is that due to the
9
Here one might bring in the issue of cyclicality which is indeed present. However it is beyond doubt that travel also declined due to lesser arrival of foreign tourists which can be directly attributed to the crisis.
‐1000
‐800
‐600
‐400
‐200 0 200 400 600 800 1000 1200
financial crisis global transportation costs and especially global freight rates in shipping have drastically come down. Another reason must be the lower volume of imports.
Finally we look at disaggregated level of transfers in chart 4:
Chart 4: TRANSFERS (NET US $ Million)
Source: RBI Database
Here we look at the two components of transfers namely private and official transfers. We can clearly see that official transfers have remained more or less the same throughout the ten quarters. What we need to focus on is private transfers which has actually increased by about 67.6 % from 8208 US $ Million in Q1 of 2007-08 to 13757 US $ Million in Q2 of 2009-10. This increase is basically due to an increase in private remittances from abroad. Now the increase in private remittances from abroad despite of the crisis can be explained by the fact there was an oil boom in the midst of the crisis as result of which the countries of the Middle East garnered a lot of profit. Hence the remittances of the Indian workers working there also increased.
Now we move to the Capital Account which comprises of Foreign Investment (FI) both in India and abroad, Loans and Banking Capital. Of the three we focus primarily on the first two. First we
‐2000 0 2000 4000 6000 8000 10000 12000 14000 16000
consider Foreign Investment in India and abroad separately. Now FI can be subdivided into Foreign Direct Investment (FDI) and Foreign Portfolio Investment (FPI). Here let us first look at FDI in India which can be further disaggregated into Equity, Reinvested earnings and Other capital. Of the three10, Equity dominates FDI in India. The chart below will help us to understand better:
Chart 5: FDI in India (NET US $ Million)
(Source: RBI Database)
Here we can see that, strangely enough, FDI in India rose from 4709 US $ Million in Q2 of 2007-08 to a staggering 14197 US $ Million in Q4 of 2008-08. After that there was a decline till the Q3 of 2008-09 when FDI in India was 6323 US $ Million. Ever since then it has been steadily increasing and was 11326 US $ Million in Q2 of 2009-10. Hence overall there has been an increase of around 50 % through the ten quarters under consideration which is not at all bad considering the magnitude of the crisis. Now the rise in FDI in India at the time when the crisis hit India can be explained by the fact that there is a time lag associated with it in the sense that the investor cannot withdraw his funds immediately. Further it can be argued that the investors
10 Quarterly data for reinvested earnings is not available. 0
2000 4000 6000 8000 10000 12000 14000 16000
had confidence in the Indian economy in the long run.11 Now we move on to FDI abroad which is not at all important for India as its negative throughout the period as seen below:
Chart 6: FDI abroad (NET US $ Million)
(Source: RBI Database)
Next we come to another very important component of Foreign Investment namely FPI which is given in chart 7 in the next page. Here we can clearly see the effect of the crisis as it fell from a high of 14751 US $ Million in Q3 of 2007-08 to a low of -3764 US $ Million in Q4 of the same year. The decline continued till the Q3 of 2008-09 when it reached -5787 US $ Million. After that it has steadily risen in the next three quarters and was 9701 US $ Million in Q2 of 2009-10. Overall there was slight increase by 29.5 % in FPI inflow in India. Since these are short term funds they were the first to have been affected by the crisis. Now one might argue that the funds should have stayed on as their prospects here was much better than in the western economies. However the point is that the outflow was basically to augment the balance sheets of the western country’s financial firms in the light of the staggering operational and mark to market losses suffered by them and also meet their immediate cash commitments.
11 This resilience of FDI was also noticed during the Asian and Latin American crises.
‐7000
‐6000
‐5000
‐4000
‐3000
‐2000
‐1000 0
Chart 7: FPI in India (NET US $ Million)
Source: RBI Database
Now this surge of capital outflow had two effects. First was the collapse of the Bombay Stock Exchange (BSE) as it is dominated by FIIs. Ghosh & Chandrasekhar (2009) have found a “high degree of correlation” between BSE’s level of Sensitive Index (Sensex) and cumulative FII investments.i Here it must be further mentioned that bullish sentiments prevailed in the stock market for a short while even after the reversal of FPI flows began in November 2007; however a whopping $ 3.2 billion FII (equity) outflow in January 2009 triggered a relentless bear run and as a result the BSE plunged by 52% from 19827 points to 9350 points (Rakshit, 2009). Secondly there was Rupee depreciationii which resulted in a significant increase in India’s foreign exchange earnings between October 2007 & August 2008. During this period India’s earnings from merchandize trade in terms of dollar increased by 33.3% y-o-y (Rakshit, 2009). Here the confidence channel also comes into play because as the Sensex turned bearish many companies put off or postponed their public listing fearing that they will not be able to raise adequate capital.
Next we analyze FPI abroad which is given in the chart in the following page:
‐10000
‐5000 0 5000 10000 15000 20000
Chart 8: FPI abroad (NET US $ Million)
Source: RBI Database
Overall there has been a decline in FPI abroad from 52 US $ Million in Q1 of 2007-08 to -24 US $ Million in Q2 of 2009-10 i.e. a decline of around 142 %. This decline follows conventional economic logic as no Indian investor in his right frame of mind would risk investing in the recession prone markets of the west. Since the Q3 of 2007-08 there has been a steady decline in FPI abroad from 100 US $ Million to -104 US $ Million in Q4 of 2008-09. However it seems to be improving in the last two quarters.
Now let us look at loans which can be subdivided into External Assistance, Short Term Borrowing and Commercial Borrowing to India. Chart 9 gives us the picture at the disaggregated level. We can clearly see that external assistance to India which is not a big factor has remained more or less constant throughout the ten quarters. However the other two are. As far as short term loans are concerned, overall, it has declined by around 56.93 % from 1962 US $ Million in Q1 of 2007-08 to 845 US $ Million in Q2 of 2009-10. Short term loans actually rose till Q4 of 2007-08 (6464 US $ Million) and then declined continuously till Q4 of 2008-09 to -5492 US $ Million. Since then they have been increasing for two subsequent quarters. As far as Commercial borrowings to India or External Commercial Borrowings (ECBs) are concerned the trend has been quite similar. ECBs registered a decline from a sharp decline from 6268 US $ Million in Q3
‐150
‐100
‐50 0 50 100 150
of 2007-08 to -267 US $ Million in Q1 of 2009-10. Overall there was a huge decline from 6939 US $ Million in Q1 of 2007-08 to 1195 US $ Million in Q2 of 2009-10 i.e. a reduction of around 82%!
Chart 9: Loans (disaggregated) US $ million
Source: RBI Database
Now these reductions in both short term loans and ECBs can be directly attributed to the crisis. The most important reason behind drying up of the two components was the huge financial meltdown in the developed economies and the associated credit crunch, with a widening spread on the yield on private bonds and that on government securities (Rakshit, 2009). They also contributed to a temporary credit crunch in the Indian Economy which in turn affected the real estate and manufacturing sectors. At the onset of the crisis, the Indian corporate sector had short-term dollar liabilities of several kinds. A large part of it was in the form of trade finance (normal trade credit as well as suppliers’ credit and other deferred finance arrangements). After the bankruptcy of Lehman on September 15, 2008, trade finance collapsed globally as international banks became wary of accepting even letters of credit issued by other large banks. The Indian corporate sector found itself having to repay a large amount of trade credit that would normally have been rolled over. Meanwhile foreign branches of Indian banks had funded themselves in the short-term inter-bank market (largely in US dollars) as their deposit base in those countries was only a small fraction of their balance sheet. A significant part of the lending was to Indian
‐8000
‐6000
‐4000
‐2000 0 2000 4000 6000 8000
companies. The collapse of the inter-bank market after the failure of Lehman left the Indian banking system in the position of having to repay large dollar liabilities that could no longer be rolled over. The Reserve Bank of India could have nipped this crisis in the bud by lending dollars to Indian banks out of its ample foreign exchange reserves. In the absence of dollar liquidity from the RBI, Indian banks and companies were forced to raise dollar resources by borrowing in rupees and converting the rupees into dollars. This process created a dramatic liquidity squeeze in the rupee money market and inter-bank interest rates shot up well outside the rate band set by the RBI. The impact of the crisis on the confidence channel also came to play as shortterm mutual funds facing redemption pressures found it difficult to sell even high quality assets and investors in these funds suffered heavy losses. Banks were reported to have blocked companies from drawing down sanctioned credit limits (Varma, 2009).
Now the short term loans can be disaggregated further into short term loans upto 180 days and short term loans for more than 180 days as seen in chart 10.
Chart 10: Loans (disaggregated) NET US $ Million
We can easily see that short term loans upto 180 days was more severely affected by the crisis than short term loans for more than 180 days. The former fell from 2216 US $ Million in Q4 of 2007-08 to -4276 US $ Million in Q4 of 2008-09 whereas the latter fell from 4248 US $ Million in Q4 of 2007-08 to -1642 US $ Million in Q4 of 2008-09.
‐8000
‐6000
‐4000
‐2000 0 2000 4000 6000 8000
st loans
Next we go to Banking Capital in which we only need to consider non Resident Deposits of Commercial Banks. This is shown in chart 11.
Chart 11: Banking Capital US $ million
(Source: RBI Database)
Here we can see that Non Resident Deposits of Commercial Banks have actually increased throughout the crisis. Several reasons can be attributed for this. First there has been a considerable improvement in the investment climate in India. Secondly the interest rates are much higher compared to global ones which were at a historic low. Third due to the crisis NRIs had more confidence in the Indian Economy.
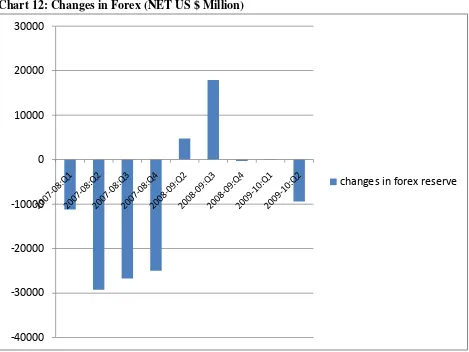
We finally come to the last component of BOP that we need to look at namely changes in foreign exchange reserves which is depicted in chart 12. Here negative implies accretion to Foreign Exchange reserves and positive implies the opposite. We can clearly see that there has been a decline in foreign exchange reserves from Q2 of 2007-08. It fell from -29236 US $ Million in Q2 of 2007-08 to 17881 US $ Million in Q3 of 2008-09. After that it has subsequently improved over the quarters. Overall it has declined slightly from -11200 US $ Million in Q1 of 2007-08 to 9418 US $ Million in Q2 of 2009-10.
‐6000
‐4000
‐2000 0 2000 4000 6000 8000
Chart 12: Changes in Forex (NET US $ Million)
Source: RBI Database
[image:19.612.74.543.74.426.2]Now having completed the BOP analysis at the disaggregated level we summarize our findings in the following two way table:
TABLE 4: SUMMARY RESULTS
IMPROVEMENT NEARLY NO CHANGE DISIMPROVEMENT CURRENT ACCOUNT Private Transfers, Transportation,
Export of Gems & Jewellery , Import of precious and semi precious stones
Travel, Official Transfers, export of textiles & leather products.
Services of which misc of which SS.
CAPITAL ACCOUNT
FDI (India), FPI (India), Non -resident deposits of CB.
External Assistance. ECB, Short Term
Loans, FPI abroad.
CHANGES IN
RESERVE ‐40000 ‐30000 ‐20000 ‐10000 0 10000 20000 30000
A Twist in the Tale:
[image:20.612.165.434.196.485.2]From the above analysis it seems indeed that the impact of the crisis on the Indian Economy was quite severe albeit for a few quarters. However the crisis struck India in Q3 of 2007-08 and if look at real GDP of India at market price it is declining from Q1 of 2007-08 as shown in table 5 below.
Table 5:
Time Line Real GDP at mkt prices (Quarterly
growth rates)
2007-08:Q1 9.3
2007-08:Q2 8.8
2007-08:Q3 8.5
2007-08:Q4 8.6
2008-09:Q1 7.8
2008-09:Q2 8.0
Source: Rakshit, 2009
Chart 13: Quarterly Growth & GDP rates
Conclusion:
Thus from the present analysis we can at best assert that India was indeed affected by the financial crisis; however the Indian economy was clearly facing a downturn two quarters before the crisis actually hit India. Hence what this crisis actually did was it accentuated the downturn for a few quarters. Another striking feature seems to be the fact that the Indian Economy is back on track as most of the items which showed disimprovement over the ten quarters of our analysis are actually showing a rising trend in the last two quarters. In other words increased integration with the world economy has indeed made India more prone to external shocks but the critical point is that India seems to have the resilience to bounce back within a short span of time (at least in the context of this crisis) and the most important reasons for this are:
1) Strict Banking Regulations:
million6. These losses as compared to the size of the balance sheet of Indian banks appear to be quite small, e.g. ICICI has a balance sheet of $100 billion and that of SBI is $200 billion.
2) Fiscal Stimulus:
The most important factor in helping India counter the financial crisis was the three doses of fiscal stimulus by the government alongwith monetary policy. The Government of India announced three successive fiscal stimuli packages during December 2008-Feburary 2009 amounting to a total of Rs. 80,100 crore (US $16.3 billion) to the exchequer. The government’s first fiscal package, announced on December 2008, a day after the central bank cut the Repo and Reverse Repo rates, had Rs 20,000 crore as additional expenditure, an across-the-board 4% excise duty cut amounting to Rs 8,700 crore and benefits worth Rs 2,000 crore for exporters. The second fiscal stimulus package dose ( 2nd Jan, 2009) combined with significant monetary measures from the RBI announcing further cuts in key benchmark interest rates, both being aimed at kick starting investments and stimulating demand in the economy which has seen a significant slowdown in demand. It had five elements namely a strong focus on interest rate reduction, additional liquidity enhancement to productive sectors, export sector being offered financial aid, a boost being given to the Infrastructure Sector and finally easier access to ECBs and FIIs. The stimulus package announced had an additional plan expenditure of Rs. 20,000 crore during the current year, mainly for critical Rural, Infrastructure and Social Security sectors and measures to support Exports, Housing, Micro, Small & Medium Enterprises (MSME) and Textile sectors. In this package, government focused on the Infrastructure needs wherein the India Infrastructure Finance Company Limited (IIFCL) would be raising Rs. 10,000 crore to refinance infrastructure projects worth Rs 25000 crore. It has also envisaged funding of additional projects worth Rs 75000 crore at competitive rates over the next 18 months. The third fiscal stimulus package comprised of further tax cuts costing Rs 29,100 crore or about 0.5 per cent of GDP. The service tax was cut by two points from the prevailing level of 12 per cent and excise duty was reduced by a similar magnitude for items presently subject to 10 per cent.
3) Restrictions on full capital account convertibility:
These restrictions resulted in a lot of less financial turmoil in the economy12. It seems that the natural follow up to current account convertibility is capital account convertibility. However the markets for the two are fundamentally different. The market for goods and services is generally predictable and fairly efficient whereas financial markets are afflicted by asymmetric information, herd mentality of managers and a mismatch between short term liabilities and long term assets (Rodrik, 1998). Further Williamson (2006), one of the founding fathers of the Washington Consensus, suggests that historically developed nations have taken around 20 to 30 yrs for implementing capital account convertibility after current account convertibility while satisfying the following conditions: Fiscal discipline, inflation between 2-5 %, increased efficiency of banks and trade liberalization. The first two are certainly not satisfied by India currently.
12
i
This can be easily seen from the charts below:
Source: (Ghosh & Chandrasekhar, 2009)
Source: (Singh, 2009)
ii
Source: (Varma, 2009)
REFERENCES:
(2009‐10). Economic Survey. New Delhi: GOI.
Ghosh, J., & Chandrasekhar, C. (2009). The Global Crisis and the Indian Economy. Cambridge Journal of
Economics , 33 (Special Issue), 725‐739.
http://dbie.rbi.org.in/InfoViewApp/listing/main.do?appKind=InfoView&service=%2FInfoViewApp%2Fco mmon%2FappService.do. (n.d.). Retrieved March 6, 2010, from rbi.org.in:
http://dbie.rbi.org.in/InfoViewApp/listing/main.do?appKind=InfoView&service=%2FInfoViewApp%2Fco mmon%2FappService.do
Lowenstein, R. (2008). Triple‐A Failure. In M. Lewis (Ed.), Panic: The Story of Modern Financial Insanity (pp. 316‐329). London: Penguin Books.
Mishkin, F. S. (2005). Is Financial Globalization Beneficial? NBER WORKING PAPER (Working Paper 11891).
Mohan, T. R. (2009). The Impact of the Crisis on the Indian Economy. In Gloabal Economic & Financial
Crisis (pp. 171‐190). Hyderabad: Orient Blackswan & Sameeksha Trust.
Nachane, D. M. (2009). The Fate Of India Unincorporated. In Global Economic and financial Crisis (pp. 191‐212). Hyderabad: Orient Blackswan & Sameeksha Trust.
Rakshit, M. (2009). India Amidst the Global Crisis. In Global Economic and financial Crisis (pp. 137‐170). Hyderabad: Orient Blackswan & Sameeksha Trust.
Rodrik, D. (1998). Who needs capital account convertibility?
Singh, D. S. (2009). Global Financial Crisis and Indian Economy: Impact Assessment, Policy Responses and Recovery.
Subbarao, D. (2009, Februray 18). Impact of the Global Financial Crisis on India: Collateral Damage and Response.
Subramanian, A. (2009, March 28). Preventing and Responding to the Crisis of 2018. Economic and
Political Weekly .
Varma, J. R. (2009). Indian Financial Sector and the Global Financial Crisis. Vikalpa , 34 (3), 25 ‐ 34.
Williamson, J. (2006, May 13). Why capital account convertibility in India is still premature? Economic &
Political Weekly , 1848‐1850.