Economic Implications of International
Tourism on Turkish Economy
Akal, Mustafa
University of Sakarya
3 April 2009
Online at
https://mpra.ub.uni-muenchen.de/25197/
ECONOMIC IMPLICATIONS OF INTERNATIONAL
TOURISM ON TURKISH ECONOMY
Mustafa Akal1 University of Sakarya
This study outlines, with a review of earlier studies, the effects of international tourism by showing developments in tourism-related economic parameters and discusses the implications of such tourism on the economy of Turkey. It asks how far international tourism contributes to the economic growth and development of Turkey; how far the country fully values its tourism potential by varying the focus of tourism facilities beyond the sun-sea-sand type of tourism, in order to lead to development of the industry countrywide and contribute further to economic growth; and other positive and negative effects of international tourism on the economy.
Keywords: International tourism, economics, implications, Turkey.
INTRODUCTION
Like other countries Turkey gives special emphasis to international tourism due to its contributions to the economy. International tourism generates both macro and micro economic effects. Among the latter, international tourism improves the quality of labour employed in the industry, uses sources efficiently under high competition, benefits from scale economies and develops new facilities adapted to international standards and demand and supply in the tourism sector. The macroeconomic effects of international tourism are a weightier consideration: these include foreign export demand for domestic goods and services, generating foreign currency earnings, new employment opportunities within the country, contributing to the repayment of foreign debt, improving the country’s international standing as well as its people’s living standards, increasing national income, generating new economic sources, accumulating investment and thus increasing domestic output, etc.
Since many developing countries have insufficient domestic savings and capital formation for development, insufficient international reserves to repay international borrowing and pay for the import of production goods and transfer of new technologies for domestic production, they view international tourism receipts as a rapid way to overcome these problems. It is calculated that in the less developed countries, one percent of GDP (gross domestic product) allocated to debt repayment reduces investment by 0.3 percent of GDP, which inhibits investment (Cohen 1993: 446). This implies that additional receipts from international tourism as a proportion of national income increases investment by 0.3 percentage, as well as saving foreign currency expenses.
Turkey has been experiencing heavy international debt and debt repayment problems since the middle of the 1970s. The country’s foreign debt was USD 1.93 billion in 1970, 79.33 billion in 1996, and 161.80 billion in 2004 (State Planning Office, 2006). These statistics are important as an indicator of the need for receipts from tourism to help with foreign debt payments over the years. Furthermore, plans to invest in tourism, to increase international reserves and create new jobs, fit well with Turkey being labour abundant and having tourism potentials.
ECONOMIC IMPACT OF INTERNATIONAL TOURISM
Benefits from tourism are measured in two stages as direct and indirect effects on an economy. The first step involves the measurement of the level of tourism foreign expenditures and their immediate employment effects. The second involves the measurement of the effects induced on national income, such as salaries and tax revenues.1
Developing countries do not benefit as much as developed countries do from international tourism due to the higher opportunity cost of tourism investment in developing countries. In other words, developing countries often have to redirect funding from other areas such as education and health services toward tourism-related infrastructure development. These investments are usually clustered around coastal regions, where returns from tourism development accrue faster. Furthermore, tourism earnings are linked to inflationary pressures at local levels, as tourists have higher income and expenditure capacities than residents. Demand for goods and services increases locally as operators and establishments raise their selling prices of goods and services during tourism seasons. On the other hand, developed countries, which enjoy stronger economies and more developed infrastructures, also enjoy higher returns and multiplier effects from tourism investments, compared with developing countries. This principle is demonstrated by global tourism receipts recorded in Table 1 for the years 2006 and 2004. Developed countries are listed among those receiving the highest tourism receipts and include the U.S.A., Spain, France, Italy, Germany, and England. While this has been the case for a number of years, Turkey, China, and Mexico have recently begun to rank at the higher levels, and have been identified as the most successful, among developing and less developed countries, in increasing their tourism revenues. According to the tourism data compiled by the Statistical Institute of Turkey (1994), in 1970, Turkey recorded a USD 4 million surplus in net tourism revenues, deficits of USD 27 millions and USD 64 million in 1976 and 1977 respectively, while, since 1980 it has been recording an increasing surplus in net tourism receipts.
Contribution to the economic growth
for tourism in these countries creates net positive income effects. As another Mediterranean country with significant sun-sand-sea attractions along long coastlines as well as numerous historical, cultural, geographical, and environmental attractions and facilities, Turkey’s tourism development and tourism policies have contributed to Turkey’s economic growth, especially since 1980.
At the same time, Turkey has followed export-led industrialization and outward-looking development policies since 1980, similar to South Korea. In the context of this similarity, one may consider the effects of international tourism on South Korea’s economic growth. Oh (2005) rejects the tourism-led economic growth hypothesis in favour of the economy-driven tourism growth hypothesis for South Korea: export-driven economic growth in the South Korean economy may be a strong causal component of tourism growth. In fact, Oh argues that the tourism-led growth occurs in economies where tourism demonstrates a spillover effect. Oh’s finding implies that the share of tourism earnings in the GDP must be high in order to validate the tourism-led economic growth hypothesis. The proportion of tourism receipts in relation to manufacturing in the Korean GDP is too low, arguably, to accept the tourism-led economic growth hypothesis. One may consider that South Korean government policies might not be as rational as those in Spain and Greece, to match international tourism demand for goods and services, thereby leading to spillover effects.
national income. Additionally, Turkey needs to strengthen its tourism infrastructure, which also benefits local communities.
The tourism sector in Turkey is backward and forward linked to the thirty-eight sectors (Kasman and Kırbas, 2004), which implies higher multiplier effect–close to 3.5 compared to many other sectors. The long-run growth elasticity, with respect to international tourism revenues equals 0.326, representing a 0.326 percentage growth in GDP as a result of an average of one percentage increase in international tourism revenues. In this context, some regulations, such as increasing the effectiveness of government tourism promotions, development of tourism-sector training programs and certificates for firms and members of the labour force, and effective solutions to various environmental problems are recommended in order to assure the contribution of tourism to the country’s future economic growth (Kasman and Kırbas, 2004). Turkey can increase its labour productivity by employing new management and operation strategies, importing advanced technologies and new inputs in the tourism industry, and thereby increase economic growth further.4
Positive and negative impacts
International tourism has positive and negative effects on economies at macro and micro levels. The tourism industry affects the host country as well as source country; benefits to the source country can be viewed as leakages experienced by the host country. In addition, there are hidden import and export costs of tourism activity for the host country (UNEP, 2005). As more tourists visit Turkey the bed capacity and thus tourism receipts have increased over the years. Revenues from international tourism are as important as international funds from world organizations such as IMF (International Monetary Fund), WB (World Bank) and other private financial organizations for Turkey’s good standing.
infrastructure, including water and sewage systems, roads, electricity, telephone, and public transportation networks. For some, domestic or internal tourism is not considered to be a complete substitute for international tourism, primarily because of the foreign currency earnings that accrue from international travel, particularly for developing countries (Tosun, 1998). International tourism generates employment, foreign currency earnings and other revenue sources for GNP, provides income to local people, reduces inequalities among classes under appropriate tourism support policies, and reduces balance of payment deficits, finances import, and helps to repay outstanding national debt etc. (Tosun
et al., 2003: 138).
On the other hand, there exist unfavourable economic effects of international tourism on the host county and its local communities. These are import and export leakages, reducing the receipts of local businesses and workers’ earnings. Import leakage is the import expenses on equipments, foods, drinks and other products that the host country cannot supply to match the standards of international tourism demand. Export leakage is outflows of profits taken by the overseas investors who finance the resorts and hotels. Foreign investors transfer tourism revenues or profits out of the community area or host country, and the exclusion of local business and products by foreign investors reduces local communities’ profits. Today, in the world, about 40 to 80% of travellers' expenditures goes to foreign-owned tour operators, airlines, hotels, imported drinks and food, etc. companies (UNEP, 2005). The magnitudes of these leakages ratios depend on governmental policies and domestic supply of tourist needs in a country.
Another unfavourable effect is the restriction of benefits to local people arising from inclusive’ tourist services. The existence of ‘all-inclusive’ vacation packages in the tourism industry, in which everything is provided, including where all expenditures will be made is defined for international tourists, and leaves fewer opportunities for local people to profit from tourism. The ‘enclave tourism’ or ‘internal colonialism’ in which the types of facilities and their physical location do not or only marginally consider the needs and wishes of surrounding communities (Britton, 1982). Natural resources benefit outsiders, whereas local people or entrepreneurs are marginalized financially when facilities are characterized, owned and controlled by outsiders and when they are designed to meet the needs and interests of foreign tourists. As a consequence, tourism development may harm locals.5
decision making, in employment and business and participation opportunities to locals. Tosun (1998: 596-97) suggests integrating objectives and priorities at national and local level to sustain tourism development in Turkey. He highlights the case of Urgup, where the local people used to live in a traditional manner, but some of them either moved out of Urgup or lost their authentic culture as a result of tourism development and tourist immigration into Urgup. This has harmed the sustainability of local tourism in respect of failure to protect social and cultural values and the sustainability of other sectors such as agriculture and industry in Urgup. Thus, the development of international tourism can bring about unbalanced sectoral development and cause redistribution of resources and earnings in favour of an outsider owned and managed tourism sector.
It is important for Turkey to develop new tourist facilities and collaborate with tour operators to benefit local people and develop local economies via tourism. To reduce these leakages Turkey will need to continue to develop its tourist industrial facility supplies domestically and increase its competitiveness in the future. The higher the availability of domestically supplied tourist facilities the lower the hidden leakage costs and the higher the multiplier effect and domestic value added to Turkey.
There exist other negative impacts such as diversion of funds from education and health to tourism-orientated infrastructure investment, which increase local prices more than they increase the local community’s purchasing power, creating stress on the local community due to economic dependence on tourism industry. That vulnerability arises from economic recessions or changing tourism patterns as well as natural disasters, and entails job insecurity with absence of employment-related medical benefits, unsatisfactory accommodation conditions for workers due to the seasonal nature of jobs in the tourism industry. As a result, local communities and federal government need to take the responsibility of overcoming these problems.
difficulties of seasonality; excess demand for both resources and goods, unbalanced economic development in favour of sun-sand-coastal regions, etc. These problems exist in Turkey as in many countries.
DEVELOPMENTS IN ECONOMY RELATED TOURISM PARAMETERS
International tourism receipts
According to the World Tourism Organization (WTO Report, 2008), over 903 million people travelled internationally and spent USD 856 billion in 2007; among these, 22.2 million people visited Turkey and spent about USD 18.5 billion, placing Turkey in ninth and tenth position respectively with 2.4% share of international tourists and 2.2% share of global tourism receipts in 2007. On average, over 80% of Turkey’s total tourism revenues are generated by international tourism, which was USD 18.487 billion in 2007 of which USD 4.497 billion was spent by Turkish residents living outside Turkey.
According to Table 1 the most popular tourist destinations were ranked as France, Spain, America, Italy, Germany, England; Turkey being ranked tenth in 2007. The most developed countries receive the highest share of the world tourism receipts for the years. The world share of tourism receipts of developing countries has been around 27% since the late 1980s (Clancy, 1999: 1). It was 23% in 1991 (Vellas and Becherel, 1995: 314). Africa increased its share from 1.96 to 2.23%, Europe received around 50.16 to 61.99%, South Asia increased its world share of tourism receipts from 0.56 to 0.62, and America increased its world share from 25.11% to 29.48% between 1970 and 1993. However, the most significant increase was experienced by East Asia and the Pacific, which marked a 10.08 percentage increase from 1970 (6.15 %) to 1993 (16.23) based on WTO Statistics (Vellas and Becherel, 1995: 27-55).
International tourism receipts are more important for Turkey’s tourism development than for the developed G-8 countries. Turkey has tourism potentials as valuable as Spain’s. Indeed, Turkey may be able to increase its tourism revenues to the level of Spain’s. Turkey’s long term target is more than USD 70 billion in tourism revenues.
receiving a very low amount of direct foreign investment to finance development over the years.
Table 1. Rank of countries in tourism receipts and arrivals, 2006.
Countries World share in receipts
World share in arrivals
America
11.3 6.2Spain 6.8 6.6
France 6.3 9.1
Italy 5.0 4.8
China 4.9 6.1
England 4.4 3.4
Germany 4.2 2.7
Turkey 2.2 2.2
World USD 856 billion 903 million
Source: Turkish Tourism Investors Association (TYD, 2009), Tourism Statistics, http:// www.ttyd.org.tr: Table 11:Top 10 in the World Tourism in 2007.
.
Spending by regions and countries
According to Turkish Statistical Institution (TURKSTAT, 2005), an international tourist in Turkey spends on average USD 80 more than a domestic tourist does. The tourism receipt per tourist decreased by USD 12 between 1993 and 2002, as seen in the last column of Table 2. And the declining trend continued between 2005 and 2007. It declined to USD 599 from USD 659 between 2005 and 2007 (TYD, 2009).
Turkey will also need to generate new facilities that match the expectations of poorer country tourists, depending on tourism demand from those countries. Allocating resources to richer tourists means higher tourism receipts for Turkey than today’s receipts
.
Table 2. Average expenditure per tourist by region
Accommodation capacity and receipts per bed and per establishment
In evaluating the Accommodation Establishments licensed by the Ministry of Tourism (TYD, 2005), the number of operation licensed beds increased to 438296 from 16151 and the number of investment licensed beds increased to 247589 from 23807, and the number of operation licensed beds increased to 2325 from 165 and the number of investment licensed beds increased to 1138 from 291 between 1966 and the end of August 2004. These numbers indicate a significant development in Region 1993 1995 1998 2000 2001 2002
Europe total 672 721 776 725 623 592
-Germany 947 887 785 769 663 693
-Other Europe(OECD) 774 590 755 641 912 810
-ISC 352 494 499 502 498 455
-Other East Europe 446 489 675 562 469 606
America total 658 578 1159 1252 1193 900
-USA 666 572 1206 1268 1196 924
-Canada 658 603 772 1102 1167 750
Africa total 672 483 - 764 1689 979
Asia total 627 539 741 713 843 637
-Japan 910 855 1212 1122 1243 809
-Syria 464 367 465 628 1433 842
-Israel 733 817 677 612 719 428
General per tourist 668 684 808 764 718 656 Source: The Association of Turkish Travel Agencies, http:// www.tursab.org.tr. (2009)
tourism sector; increasing accommodation capacity, increasing employment and increasing value added of tourism in domestic output in Turkey over the years. Between 1988 and 1992 both the number of operation licensed and investment licensed beds increased consistently. However, the number of operation licensed beds and establishments increases while the number of investment licensed establishments and beds, tends to decrease.
Increases in accommodation capacity imply that tourism capacity, scales of firms, variety of tourism facilities, number of package tourism programs are increasing in the tourism industry. The increases in the scales of room and bed per establishment reduce supply costs per tourist. Table 3 indicates that bed number per operation establishment had reached 212 and bed number per investment establishment had reached 329 by 2005. This implies that both types of establishments are aware of international competitions to behave rationally in reducing management and operation cost per tourist by making scale economies. However, these ratios may change depending on the type of establishment such as hotels, motels, pensions, campings, inns, golf facilities, complexes, etc. For example, a scale ratio of investment licensed bed-establishments was 207.4 in hotels and 51.25 in motels, and they were 187.1 in hotels and 77.95 motels in operation licensed establishments in 2003.6
Table 3.Tourist accommodation capacity per establishment
Year
Number of operatio n establis hment
Room per operation establish ment
Bed per operation establish ment
Number of investment establishm
ent
Room per investment establishm ent
Bed per investment establishm ent
1966 165 - 98 291 - 82
1966-70 225.4 - 96.9 330.6 - 82
1975 421 12.5 100.1 202 13.1 123.9
1976-80 472.6 12.3 110 256.2 10.2 103.4
1981-85 608 13.6 112 381.2 17.97 123.4
1986-90 976.8 17.2 131 1276.2 24.5 170.5
1991-95 1601 16.9 150.8 1725 11.2 157.7
1996-00 1896.8 16.5 135.05 1337.4 16.96 36.4
2001-03 2114.7 89.6 186.26 1169.3 64.3 91.3
2001-05 2226.2 91.5 190.7 1139 99.86 197.7 2004 2357 92.3 192.5 1151 103.3 225.3 2005 2412 95.8 200.4 1039 123 267.8 2006 2475 97.7 205.5 869 141.9 316.1
2007 2512 - 211.85 775 - 328.84
Source: Authors calculations based on Turkish Tourism Investors Association (TTYD) data, http:// www.ttyd.org.tr. (2005, 2008, for 2007: 2009).
programs and increases in scale per establishment. In Table 4, the international tourist arrivals and receipts averages indicate that the receipts for both perbed and per establishment increased during the mass tourism period, especially after 1990. The average annual receipts per bed increased to USD 14920 between 2001-2004 from US D 2780 between 1966 and 1970.These statistics mean that new establishments bring about more tourism receipts per establishment and per bed alongside increases in the variety of facilities increased to match the expectations of international tourists.
Table 4. International tourism receipts on the averages
Year Average receipts per tourist (USD) Average receipts per bed (millions USD) Average receipts per operation establishme nt bed (millions USD) Average receipts per investmen t establishm ent bed (millions USD) Average receipts per establishm ent (millions USD) Average receipts per operation establishm ent (millions USD) Average receipts per investmen t establishm ent (millions USD) 1966-70
44.69 0.00278 0.00005 0.001 0.049 0.121 0.082
1971-75
122.5 0.002297 0.00015 0.006 0.252 0.382 0.742
1976-80
156.59 0.003110 0.00019 0.009 0.335 0.516 0.952
1981-85
380.68 0.00605 0.00041 0.015 0.704 1.146 1.828
1986-90
547.7 0.00906 0.00007 0.010 0.937 2.161 1.654
1991-95
720.13 0.00761 0.00065 0.014 1.174 2.440 2.264
1996-00
711.15 0.01187 0.00102 0.028 2.020 3.444 4.885
2001-04
680.81 0.01537 0.00152 0.042 2.926 4.531 8.259
2005 630.8 0.018289 0.02882 0.05005 4.03 5.8 13.4
2006 894 0.0327 0.03323 0.06152 5.05 6.8 19.4
Source: The Association of Turkish Travel Agencies, http:// www.tursab.org.tr. (2008), Note: By 2007 23341 million people visited Turkey and spent USD 18.487 millions, averaging receipt per tourist equals USD 792.
Employment in tourism
[image:15.420.59.365.245.501.2]Since tourism is a labour-intensive industry, it is seen as an employment creating industry by many labour abundant developing countries. Turkey is such a labour abundant country, able to allocate ordinary unemployed labour to the tourism sector at zero opportunity cost. However, its tourism labour force needs to be educated to increase the quality of tourism services. Also, there are some capital-intensive tourism activities such as air transportation, construction of airport facilities and hotels, which need a large amount of capital to establish. Although Turkey has been facing lack of capital it has more capability to establish air transportation facilities and comparative advantages in establishing tourist construction facilities, compared with many other developing countries such as Egypt, Albania, and Syria etc.
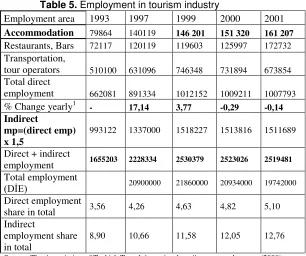
Table 5. Employment in tourism industry
Employment area 1993 1997 1999 2000 2001
Accommodation 79864 140119 146 201 151 320 161 207 Restaurants, Bars 72117 120119 119603 125997 172732 Transportation,
tour operators 510100 631096 746348 731894 673854 Total direct
employment 662081 891334 1012152 1009211 1007793 % Change yearly1 - 17,14 3,77 -0,29 -0,14
Indirect
mp=(direct emp) x 1,5
993122 1337000 1518227 1513816 1511689
Direct + indirect
employment 1655203 2228334 2530379 2523026 2519481 Total employment
(DİE) 20900000 21860000 20934000 19742000
Direct employment
share in total 3,56 4,26 4,63 4,82 5,10 Indirect
employment share in total
8,90 10,66 11,58 12,05 12,76
Table 5 indicates that the share of indirect employment was 12.76%, and the share of direct employment was 5.1% in the tourism sector in 2001. Both direct and indirect employment shares have increased since 1993. The tourism sector is, after the construction industry, the second largest job providing sector with 16% in total employment in the country. Also, the tourism sector links to 38 sectors back and forward, generating a high employment multiplier effect in Turkey (Kasman and Kırbas, 2004: 123).
Staff are generally employed mostly in hotels and restaurants, then in travel agencies and administration. In addition to direct employment, employment in tourism indirectly creates one and half times as much employment in other sectors. Thus employment in the tourism sector contributes significantly to reduce overall unemployment in Turkey – without entailing this allocation of labour from other sectors to the tourism sector – something that is seen as desirable by the unemployed, by firms and by governments.
Foreign investment in tourism
Table 6 indicates that the total foreign investment in tourism ranged between USD 40 and USD 240.2 millions, an annual average of USD 114 million between 1991 and 2002. We see the lowest foreign tourism investment in 1999. By the middle of 2003, it totals USD 1407.7 million.
The share of foreign investment in tourism has been increasing since 2000. The foreign investment share of tourism in services was 30% in 1992 and declined to 11.6% in 2003. Its share in services reached its highest level (31%) in 1997. Although the share of foreign investment in tourism sector has been low, its share has ranged above the mining and agricultural sectors as seen in the seventh and eighth columns of Table 6, over these years.
income multiplier effect. Local people do not have the same advantage in package tourist programs.
Table 6. Foreign investment in tourism industry and sectoral shares of foreign investment
Year Permitted total foreign investment in mil. USD Foreign investme nt in tourism mil. USD Tourism share of foreign investment Services share of foreign investment Manufact uring share of foreign investme nt Agricultu ral share of foreign investme nt Mining share of foreign investm ent
1991 1 967 240,2 12,2 41 56 1 2
1995 2 938 174,8 5,9 29 68 1 2
1999 1 700 40 2,4 33 66 1 0.0039
2000 3 474 50,2 1,6 66 32 2 0.0014
2001 2726 86,5 3,2 48 46 5 1
2002 2243 80,2 3,6 58 40 1 1
2003
(Jan-June) 1208 42.2 3.49
30 59 1 10
Share
(6.30.2003) 100 - 4 44 53 18 1.3
Total
(6.30.2003) 35203.7 1410 -
15542.93 18641.6 616.37 442.38
Source: Tourism foreign investment and shares: The Association of Turkish Travel Agencies, http:// www.tursab.org.tr. (2009).
Sectoral distribution statistics: Turkish Treasury, Foreign Investment Statistics, http:// www.treasury.gov.tr. (2008).
Developments in the share of international tourism receipts
Table 7. Share of tourism receipts in some macroeconomic parameters
Year
Share of tourism receipts in
GDP
Tourism receipts/ export
Tourism receipts/ import
Tourism receipts/debt
and interest repayments
Tourism receipts/ current account
balance
1963 0,1 2,1 1.0 4.7 -2.3
1970 0,5 8,8 5.4 24.9 -29.8
1980 0,6 11,2 4.1 11.8 -9.6
1990 2,1 24,9 12.1 37.6 -103
2000 3,8 27,5 14.0 34.9 -77.8
2001 6,9 32.1 19.5 32.8 +238.6
2002 6,6 33.9 16.5 29.4 -557
2003 5.5 28.2 13.9 34.8 -120.4
2004 5.0 25.2 12.4 39.8 -78
2005 5.3 24.7 15.5 38 -61.6
2006 4.2 19.8 12.07 34 -39.7
2007 2.8 17.3 11.09 38 -48.81
Source: http// www.treasury.gov.tr, for imports after 1992, The Turkish Tourism Investors Association (TYD), http://www.ttyd.org.tr. (2008), for shares. TURKSTAT, Statistical Indicators 1923-1992, Table XIII-5-12: Balance of Payments, pp.390-402. (1994) and http//www. treasury.gov.tr. (current account and debt payment service (interest + repayments): Treasury Statistics 1980-2003, Table 6.2: Balance of Payments, (2004), for export and import values, and treasury.gov.tr (2009): Treasury Statistics Yearbook 2007: Table 2.1 8: Gross External Debt Profile of Turkey.
Table 7 shows the shares of tourism receipts in important macroeconomic parameters. The share of international tourism receipts in GDP was highest in 2001. The ratio of international tourism revenues in closing the trade gap was 56.6 in 2003. It was 77% during the 2001 crises. All these are the fruits of the new governmental views and policies in regards to the tourism industry in Turkey.
Turkey needs to sustain international tourism earnings locally and domestically. International tourism revenue is a source of funds for local and domestic entrepreneurs to establish new tourism facilities. Turkey can reduce dependence on foreign tour operators and reduce the hidden cost
of international tourism (Cayır and Zengin, 1995).
countries. Austria’s trade with its trade partners, the USA, Japan, and the UK was found to have increased with increased international travel, and it is found that international travel Granger causes real export and real total trade for Japan (Wilson and Kulendran, 2000: 1007). This result may imply that Turkey may increase its export revenues further by encouraging international tourism.
THE PROBLEM OF UNBALANCED TOURISM DEVELOPMENT
According to Tosun et al. (2003: 143–148), Turkish tourism policies and historical and geographical factors caused tourism to grow in
particular regions, such as in Kusadası, Marmaris, Fethiye, etc. This
situation created regional inequalities in Turkey. Additionally, Tosun et al. consider that locally owned small establishments lost in competition against non-locally owned large-scale establishments, after the enactment of the Tourism Intensive Law No. 2634 in 1982. Since the government determines by law tourism regions, tourism zones and tourism centres, the inequality among regions has increased because most tourism facilities, employments and bed capacities have been placed in the sun-sea-coastal regions, as a result of earlier government allocation of sources to large scale tourism investment projects in relatively developed coastal regions – the Aegean, the Mediterranean and Marmura coasts. This situation led to large regional development gap, and social and economical inequalities in Turkey. It must be noted however, that the terror activities of PKK (the Kurdish Workers Party) have constituted significant obstacles to the development of tourism in East and South-eastern Anatolia, on account of the very high sensitivity of tourism demand to socio-cultural and political unrest (Tosun et al. 2003: 143–152).
There also exists an unbalanced number of visitors from the countries of origin and the regions of the world. Therefore, there is a need to develop a strategy to attract international incomings from other countries or nationalities and different regions of the world. Turkey will need to advertise itself to other regions such as Asia, Africa and Latin America in parallel to other tourism development strategies, rather than largely depending on rich EU and OECD countries.
CONCLUSION
International tourism receipts are an important foreign currency source for Turkey’s good standing internationally. They contribute to debt repayment and recover current account deficits as well as contributing to national income levels and employment. Although Turkey is a newly industrializing country – meaning that even industrial goods production has quite large share in Turkey’s GDP – trade, employment and other macroeconomic parameters international tourism still accelerates Turkish economic growth.
Turkey with various tourism potentials has the capacity to increase international tourism receipts to the level of Spain’s. To this end, Turkey should support domestic and local investments in the tourism sector further, because of its positive spillover effects and higher returns to the economy. Turkey should continue to match tourism demand for goods and services domestically to keep tourism revenues in the country and in local communities so as to enhance the multiplier effect or to increase domestically added value in the tourism industry. There are insufficiencies in tourism facilities alternative to the sun-sea-coastal tourism, which must be met so as to realize the countrywide tourism potential of Turkey. To move towards a better balanced development of tourism, and thus to benefit more people through tourism-based economic development, the government could support alternative tourism investments in the interior of Anatolia as soon as possible.
REFERENCES
Association of Turkish Travel Agencies (2008 & 2009). Tourism statistics. Http://www.tursab.org.tr. Accessed the 10th of March 2008 and Accessed the 16 th of January 2009, at 15:05.
Britton, S.G. (1982). The political economy of tourism in the third world. Annals of Tourism Research, Vol. 9, No.3, pp.331-358.
Cayır, C. & Zengin, B. (1995). Sahip oldukları turizm potansiyelibakımından
Turkiye ve Ispanya, Dunya Gazetesi, 7th July 1995.
Clancy, M.J. (1999). Tourism and development: Evidence from Mexico. Annals of Tourism Research, Vol. 26, No.1, pp.1-20.
Cohen, D. (1993). Low investment and large LDC debt in the 1980’s.
American Economic Review, Vol. 83, No.2, pp.437-449.
Dritsakis, N. (2004). Tourism as a long-run economic growth factor: An Empirical investigation for Greece using causality analysis. Tourism Economics, Vol. 10, No.3, pp.305-316.
Erdogan, H. (2005). Uluslararası Turizm (2nd ed). Bursa, Uludag University Press, No.18-003-0275.
Goeldner, C.R., Ritchie, J.R.B & McIntosh, R.W. (2000). Tourism: Principles, Practices, Philosophies (8th ed). New York, John Wiley & Sons, Inc. Grossman, G.M. & Helpman, E. (1991). Trade, knowledge spillovers and growth.
European Economic Review, Vol. 35, No.2-3, pp.517-526.
Gunduz, L. & Hatemi-J, A. (2005). Is the tourism-led growth hypothesis valid for Turkey. Applied Economics Letters, Vol. 12, No.8, pp.499-504.
Kasman, A. & Kırbas, K.S. (2004). Turizm gelirleri ve ekonomik bütünlesme ve nedensellik iliskisi. İktisat Isletme Finans Dergisi, Vol. 19, No.220, pp.122-131.
Keynes, J.M. (1964). The General Theory of Employment, Interest, and Money
(1st HB ed). Orlando, Harcourt Brace Jovanovich Inc.
Kırat, O. & Eris, E.D. (2005). A proposal to integrate Turkish marinas and hospitality industries in Development, Impacts and Management, pp.11-21. Paper Presented atCongress Proceedings of International Congress on Costal & Marine Tourism 2005, CMT. Izmir, Cesme, Turkey: November 15-18, 2005.
Mbaiwa, J.E. (2005). Enclave tourism and its socio-economic impacts in the Okavango Delta, Botswana. Tourism Management, Vol. 26, No.2, pp.157-172.
Oh, Chi-Ok (2005). The contribution of tourism development to economic growth in the Korean economy. Tourism Management, Vol. 26, No.1, pp. 39-44. Shaw, B.J. & Shaw, G. (1999). Sun, sand and sales: Enclave tourism and local
entrepreneurship in Indonesia. Current Issues in Tourism, Vol. 2, No.1, pp.66-81.
State Planning Office (2007). Economic and Social Indicators 1950-2005: Foreign Debt Statistics. Http//www.spo.gov.tr. Accessed the 10 th of November 2007, at 19:18.
Tosun, C. (1998.). Roots of unsustainable tourism development at the local level:The case of Urgup in Turkey. Tourism Management, Vol. 19, No.6, pp.595-610.
Turkish Ministry of Culture and Tourism (2005). Tourism Statistics, Http://www.turizm.gov.tr. Accessed the 17 th of May 2006, at 18:11. Turkish Statistical Institution (2005). Tourism Statistical Indicators. Http://
www.turkstat.gov.tr. Accessed the 5 th of January 2007, at 09:25.
Turkish Statistical Institution (1994). Statistical Indicators 1923-1992: Foreign Travel Receipts and Expenditures, pp.390-391, Ankara, TURKSTAT Press House.
Turkish Tourism Investors Association (2005, 2007, 2009). Tourism Statistics. Http:// www.ttyd.org.tr. Accessed the 29 th of January 2008 and Accessed the 16 th of January 2009, at 13:46.
Turkish Treasury. (2004). Treasury Statistics 1980-2003. Http://www.treasury.gov.tr, ISBN 975-3613-6. Accessed the 11 th of November 2006, at 16:10.
Turkish Treasury. (2008). Foreign Investment Statistics. Http://www.treasury.gov.tr. Accessed the 29 th of January 2008, at 17:33. Turkish Treasury (2009). Treasury Statistics Yearbook 2007. Accessed the 17 th
of January 2009, at 10:23.
United Nations Environment Programme (UNEP). (2005). Economic Impacts of Tourism. Http://www.uneptie.org/pc/tourism/sust-tourism/economi.htm. Accessed the 18 th of Appril 2006,at 11:40.
Unur, K. (2004). Turizmin ekonomik etkilerinin ölçülmesi. Dokuz Eylül Universitesi Sosyal Bilimler Enstitüsü Dergisi, Vol.6, No.4, pp. 114–142. Vellas, F. & Becherel, L. (1995). International Tourism: An Economic
Perspective. London, Macmillan Press Ltd.
Wilson, K. & Kulendran, N. (2000). Is there a relation between International trade and international travel. Applied Economics, Vol. 32, No.8, pp.1001-1009. World Tourism Organization (WTO). (2005, 2007). World tourism report.
Http//:www.unwto.org.tr. Accessed the 10 th of October 2007, at 15:13. World Tourism Organization. (2007). Tourism highlights. Http//:
www.unwto.org.tr. Accessed the 10 th of October 2007, at 16:55.
ENDNOTES
1. Unur (2004) pointed out the impossibility of exact measurement of tourism’s economic effects because of statistical obstacles in measurements.
2. Keynes (1964) theorized that each unit of expenditure injected into the economy creates income more than this spending and creates additional employment within and outside sectors despite leakages such as taxes, import, and savings.
3. For example, the tourism income multiplier was 2.43 in Canada in 1970, 0.97 in Mexico in 1977, compared to 1.4 in Greece in 1964 (Erdoğan, 1995).
5. For example, the widening of the existing economic, cultural and social gap between hosts and guests in the islands of Bali, Lombok and Pulau Bintan in the Riau Archipelago in Indonesia are mentioned in literature (J. Shaw and Shaw, 1999). Similarly, enclave tourism’s socio-economic advantages are relatively small compared to socio-economic disadvantages in the Okavango Delta, Botswana, and where “tourism depends on international tourists, foreign companies largely own tourism facilities, tourism is generally organized by developed countries, and domestic tourism and citizen participation in tourism are very low. The industry is also characterized by the repatriation of revenue from Botswana, failure to pay tax by tourism companies and that tourism has weak linkages with the domestic economy’’ Mbaiwa (2005, p.169). Tourism development officially promoted by the Mexican state can serve as an example of how not to experience ‘enclave tourism’. In the background of Mexican tourism development, the Mexican Tourism Ministry played an important role to increase the number of international tourists and tourism receipts as a Third World country, which used to benefit little from international tourism like other developing countries before 1960 (Clancy, 1999). Mexican state officials implemented their own tourism promotion and took the lead in the construction of infrastructure and several hotels, providing financial support to private investors and in taking on ownership of tourism enterprises. In market area, firstly foreign hotel chains were attracted and were permitted to form local partnerships with large scale Mexican business group. Mexican officials still control beach tourism and permit foreign firms to enter beach sector but only at high risk. As a result, Mexico has experienced a considerable development in tourism and largely national capital owned participation that has not closed off the structure of international tourism. 6. See Table 9: Distribution of Licensed Accommodation Establishments by Types and Classes (2003), Tourism Statistics, http:// www.ttyd.org.tr. (2005). 7. The scale ratio of investment licensed bed-establishments over the scale ratio of operation licensed bed-establishment increased to 1.14 in 2003 from 0.83 in 1966.
SUBMITTED: APRIL 2009
REVISION SUBMITTED: JUNE 2009 ACCEPTED: AUGUST 2009
REFEREED ANONYMOUSLY
Mustafa Akal (akal@sakarya.edu.tr) is an Associate Professor at University of Sakarya, Faculty of Economic and Administrative Sciences,
Department of Economics, Esentepe Kampusu, Adapazarı, 54187,