Munich Personal RePEc Archive
The underdevelopment of service
industry in China: an empirical study of
cities in Yangtze River Delta
Zheng, Jianghuai and Zhang, Lili and Wang, Yu
Yangtze River Delta Research Center on Economic and Social
Development, Nanjing University, Department of Industrial
Economics, Nanjing University, Department of Industrial
Economics, Nanjing University
July 2010
Online at
https://mpra.ub.uni-muenchen.de/33125/
1
The Underdevelopment of Service Industry in China: An
Empirical Study of Cities in Yangtze River Delta
Jianghuai Zheng
Department of Industrial Economics, Nanjing University
Yangtze River Delta Research Center on Economic and Social Development, Nanjing University
Lili Zhang Yu Wang
Department Industrial Economics, Nanjing University
Abstract: In contrast to the global average level, we find that service industry in China is underdeveloped. Its development level is rather low compared with not only developed countries at the same level of GDP per capita in the history, but also other similar developing countries at present. We define the phenomenon as “mystery of development deviation” between service industry and overall economy and set up a theoretical model to propose a hypothesis called “manufacturing cost disease” caused by service sector. This paper studies the influence of economic activity density on labor productivity in service industry by using the data of urban agglomerations in Yangtze River delta because of service industry’s concentration in the cities of. The results indicate that increase of labor productivity in service sector is driven by capital investment and “mystery of development deviation" is rooted in “manufacturing cost disease”. Service industry’s output increase exhibits significant characteristics of decreasing returns to scale. Therefore, productivities of both service and manufacturing sectors will remain low and the economy will fall into a complete stagnation, when manufacturing sector is unable to continue expanding. To eliminate this deviation, the pattern of industrialization and urbanization driven by capital investment must be changed. Expansion of producer services is also important, as well as increasing densities of human capital and foreign investment.
2
I. Introduction
Since World War II, the development of service sector in western countries has developed rapidly and it gradually exceeded secondary industry to become the leading industry. In 1970, service industry accounted for 61% of GDP in United States and this number rise to nearly 77% in 2006. Service industry developed more rapidly in big cities. Being the economic center of United States, New York is also the financial, trade, cultural and information center of the world. In 2005, New York's proportion of service industry in GDP was as high as 88.4%. In international metropolises like London and Tokyo, the proportions are all higher than 80%. The development degree of service industry is an important mark of economic modernization. Fast development of service industry can promote the persistent increase of total labor productivity, and it is an important means for the transformation of the economic growth mode.
Compared with service sector in developed countries, it is not difficult to find that there is a development deviation between service sector and overall economy in our country. In 2008, China's GDP per capita was $6,023 (based on the US dollars in 2000), which was achieved by most western countries in the 1970s. At the same time, the proportion of service industry’s added value in GDP was only 40.15% in 2008, far less than the proportion of United States (62%), Britain (57%), Germany (53%), France (59%) and Japan (53%). It also falls behind the average level of the emerging market economies (53%). In addition, it is lower than the world average level in 2007, which is 69%. It is even lower than the average level of the low-income countries in the world.① Compared with the other three countries of BRICs, service industry in China is developed insufficiently.② Among different regions of China, Yangtze River Delta is better than China's average level. In 2007, Yangtze River Delta's service industry contributed 41.7% of GDP, and this proportion in Shanghai was even as high as 52.6%. Nevertheless, Yangtze River Delta's service industry is still underdeveloped compared with those countries at the same level of economic development.③ If we regard proportion of GDP from service sector and GDP per capita as indicators of development level of service industry and overall economy respectively, this deviation phenomenon can be called the mystery of development deviation between China's service sector and its overall economy.
In the 1960s, service industry became the leading sector in western developed
①
According to the data of World Bank, China's GDP per capita was $5,083 in 2007 and $5,514 in 2008, based on purchasing power parity of international dollar in 2005. It is equivalent to Korea's development level in 1980. At that time, Korea's per capita GDP was $5,543, and Korea's service industry accounted for 47.28% of GDP, 7 percent higher than China. The proportions of GDP contributed by service industry in emerging market economies such as Russia, Brazil and India are 57%, 47% and 53% when they achieved the same GDP per capita. In 2008, the average level of this proportion in low-income courtiers was 47.5%. All of these are higher than China. The source of information is World Bank database.
②
See Zhang and Zheng (2010).
③
3
countries, but it decreased the total labor productivity, resulting in economic stagnation. Baumol (1967) proposed the hypothesis of "service cost disease" on the basis that labor productivity in service sector lags behind labor productivity in manufacturing sector. China's service industry was underdeveloped in the last thirty years. However, the manufacturing industry developed steadily as the leading sector and promoted the increase of GDP per capita. As to this phenomenon, the authors construct a theoretical model based on the development relationship between service industry and overall economy, putting forward the "manufacturing cost disease" on the basis that labor productivity is increased faster in service sector than manufacturing sector, which is a key reason for the development deviation between service industry and overall economy. This model can also be used to explain the "cost disease" that the western countries have met during their service sectors’ development, as well as the fact that "cost disease" has been cured in the recent twenty years. Based on the fact that service industry is mainly clustered in cities, this paper further examines how labor productivity is influenced by change of economic activities’ density. The results show that the increase of labor productivity in China's service industry is mainly driven by capital investment and restrained by decreasing returns to scale. Moreover, the excessive increases of manufacturing industry's density and non-agricultural population density have made the marginal growth rate of labor productivity in service industry decrease progressively. This is in accordance with the feature that "manufacturing cost disease" leads to the development deviation between service industry and overall economy. Finally, this paper indicates that the deviation is rooted in the industrialization and urbanization phase motivated by capital investment. In this phase, development of service industry is mainly driven by capital investment and urbanization featured with high-quality human capital is insufficient because manufacturing industry absorbs excessive labor force.
This paper chooses data from urban agglomerations in Yangtze River Delta, because of notable changes of economic activity density in this area and its leading position of service industry in China, even though it still has been quite low in the last twenty years. At present, Yangtze River Delta is undertaking industrial structure's transformation from manufacturing-dominance to service-dominance, which is also China's future development direction. So service industry in urban agglomerations of Yangtze River Delta can be used as the typical example of China.
II. Literature Review
4
intensive labor input, and labor productivity in this sector remains the same. In the circumstance that the labor force can be freely flowing, rising wage with unchanged unit cost in manufacturing industry because of its labor productivity's increase will lead to rising wage with increased cost in service industry. Since labor productivity in service industry is stagnant and the demand for service products has a small elasticity to income but a high elasticity to price, the increased cost is difficult to recover. More labors are needed to maintain the relative output share of service industry, that is, balanced development between manufacturing and service sector. The cost of service industry will keep increasing and lead to increase of service price, decrease of service quality and deterioration of financial status. Eventually, it will reduce overall productivity of the economy and slowdown the economic development. Based on their calculation on data of 14 countries in EU from 1970 to 1987, Bernard and Jones (1996) found that there is a divergence between labor productivity in manufacturing industry and total factor productivity, but a convergence between labor productivity in service industry and total factor productivity. One explanation for this difference is that manufacturing industry mainly produces tradable products and it is possible that each country could achieve professionalism and comparative advantage. While service industry mainly produces non-tradable products, so the technology of the same service can be easily spread. Markusen and Strand (2007) argues that the labor productivity in service industry will increase when producer service can be traded as a middle input.
5
Samaniego 2009). The skill-intensiveness of producer service has strengthened service innovation’s high dependency on original knowledge and weakened the tendency of diminishing marginal return of research and development. On the contrary, skill has higher premiums, which raises the relative price of related service (Buera and Kaboski, 2006). Fixler and Siegel (1999) further discovered that demand for labor is increased and labor productivity of service industry is decreased only in the initial stage of producer service industry’s separation from manufacturing industry. After that period, manufacturing industry has a further increased demand for producer service, which can gradually improve labor productivity of service industry.
Studies on the development of service industry and labor productivity in China are similar to foreign research work, which focus on examining whether “Baumol cost disease" exists or not. Qin (2006) uses provincial panel data to do the test and shows that China's actual output of service industry accounts for about 25% of GDP from 1990 to 2004. Service industry absorbs a large amount of labors from the rural regions and contributes to the increase of overall labor productivity and economic growth in China. However, there are signs of "Baumol cost disease". Income elasticity of service products' demand was large while the price elasticity is small. The rigidness of service price is raised, that is, nominal wages in service industry increase rigidly with labor productivity of manufacturing industry, instead of its own, which will result in a decreased demand for labor input. If outflow of rural labors is absorbed by manufacturing industry, the net increasing effect of overall labor productivity will vanish and the process of economy’s servitization will be difficult to continue. Cheng (2004) examines 1978-2000 provincial data and finds that labor productivity of China's service industry is lagging behind, which is the main reason of a relatively fast increase in its employment. The income elasticity of demand in most service industries is less than 1 and demand for service is price inelastic, which will easily cause "cost disease" under the background that service price has been rising in the past few years.
On the study of influence factors of China's service development and labor productivity, Yang and Xu (2004) find that the output elasticity of capital is larger than that of labor, while the former slowly decreases and the latter slowly increases by years by using non-homogeneous production function. Chen and Liu (2008) discover that there is a positive correlation between service demand and labor productivity of service industry. Gu and Li (2006) further show that there exists remarkable difference of technical efficiency in service industry among east, middle and west of China, which is an important reason for the regional imbalance of labor productivity in China's service industry. Difference of marketization process and labors' quality is an important reason for regional difference of technical efficiency in China's service industry.
6
Ciccone and Hall (1996) argue that density of economic activity is a more appropriate variable compared with urban size. They establish correlationship between population density and labor productivity of different states in United States according to geographical externality and diversity of inputs. After considering the endogeneity of agglomeration economy, they find that labor productivity is increased by 6% when employment density of a district is doubled.
Density of economic activity can also have an effect on service concentration in cities. Moomaw (1981) argues that manufacturing department has more productive advantages than non-manufacturing counterpart in large or medium cities. Therefore, big cities are more appropriate for the development of service industry. Krugman (1991) points out that the service industry such as finance and insurance is a highly concentrated industry and localization is a significant feature when he studies the automobile manufacturing industry. Fujita, Krugman and Venables (1999) also agree that financial service has a high concentration effect.
High density of economic activity may bring external diseconomy on the other hand. Carlino (1979) argues that population size has negative influence on productivity, which means there is diseconomy of agglomeration. Jones (1995) observes that OECD countries' economic growth rate is disproportionate with its amount of labor and there is no or even negative correlation between them in some countries. Futagami and Ohkusa (2003) find that there is a U-shaped relationship between market scale measured by population size and economic growth rate. Henderson (2003) discovers that urbanization is disadvantageous to the economic growth of high-income countries. These studies indicate that when the economic activities exceed one certain density, it may cause diseconomy of conglomeration and obstruct economic development.
As to research on China, Wang and Xia (1999) show that urban economy has the feature of increasing returns to scale, but agglomeration cost begins to occur when the city enlarges its scale. Ji, Cai and Yang (2004) argue that industrial sector as a whole does not have obvious agglomeration effect, but the aggregation of secondary industry and tertiary industry does. Fan (2006) estimates that elasticity of labor productivity in non-agricultural industry to density of non-agricultural employment is 8.8% in China. Chen et al. (2008) show that there is a significantly positive correlation between labor productivity and economic density. Cheng and Chen (2005) argue that relative intensity of every service industry except real estate has obvious positive influence on labor productivity. Zhang and Liu (2008) and Liu (2009) find that urban agglomeration economy has an obvious positive effect on growth of GDP per capita and non-agricultural labor productivity.
7
influence of population density and employment density on labor productivity, without considering other aspects of density of economic activity. Research work on China’s service industry is mainly about verifying the existence or non-existence of "service cost disease". Different from above literature, this paper is based on China's experience of service industry’s development that is different from western countries. By using urban data of service agglomeration, it reveals how factors of density of urban economic activity influence labor productivity and how "manufacturing cost disease" begins to exist under the background of increasing labor productivity in China's service industry. Eventually it explains the development deviation between service industry and overall economy.
III. Theoretic Hypothesis
(I) Definition of "mystery of development deviation" between service industry and overall economy: a theoretical model
Suppose an economy consisting of manufacturing industry and service industry④.
We denote labor’s input and output in manufacturing industry by Lm and Ym
respectively. And labor’s input and output in service industry is denoted by Ls and
s
Y respectively. Suppose labor productivity in service industry is s s
Y L
, labor
productivity in manufacturing industry is m m
Y L
and GDP per capita is a Y L
(where Y YmYs and LLmLs). The percentage of service industry in GDP is
s
s m
Y b
Y Y
. According to definitions above, we can derive that
⑤
( 1 m )
s
b
L a
L
(1)
Alternatively, it can be written as:
④
Since the percentage of agriculture and rural population is decreasing in the process of economic development, rural labor forces are transferred into manufacturing and service industry. During the transformation of industrial structure from manufacturing dominance into service dominance, the main problem is the balanced and imbalanced development between manufacturing and service industry. So this paper only considers an economy composed of manufacturing and service industry.
⑤
8
(1 )
s
s
m
s
Y L b
Y L
L L
= (1 )
s
s
m s m
m s s
Y L
Y Y L
L L L
( )
(2)
Firstly, it is easy to know from (1) and (2) that there are two possible situations that service industry’s development level (the percentage of service in GDP) is consistent with overall economic development level (GDP per capita).
1. According to Baumol's hypothesis that service labor productivity ( ) is in
stagnation, increase of GDP per capita coupled with increasing contribution of service
industry’s to GDP can only be satisfied when (1+ m s
L
L )is decreased, which relies on
the increase of labor productivity in manufacturing industry. That is, more labors (Ls)
must be absorbed from manufacturing and agriculture industries to keep the output of service industry stable. This is a development situation of service industry similar to "Baumol cost disease".
2. Suppose that labor productivity in service industry is increasing. To increase
both GDP per capita and service industry’s contribution to GDP, (1+ m s
L
L ) also must
be decreased. Compared with Situation 1, the margin of decrease will be smaller. In addition, the composition of labors transferred from manufacturing industry is also different from Situation 1. In Situation 1, the labors are substituted "workers" because of increasing labor productivity in manufacturing industry. But in Situation 2, the labors are "production servers" who are separated from manufacturing industry to enrich and enlarge the scope and scale of producer service industry because of increasing labor productivity in service industry. This is similar to the development of service industry in developed countries in the last twenty years, that is, the increase of labor productivity in service industry is caused by the development of producer service industry.⑥
Secondly, there are also some possible situations of development deviation between service industry and overall economy as follows:
⑥
Please see Ghani, Grover and Kharas (2011) for experience evidence that labor productivity is higher in service industry than manufacturing industry. Based on World Development Indicator, this paper calculates labor
9
3. If labor productivity in service industry and m s
L
L remain the same, it can be
shown that the proportion of service industry in GDP decrease when GDP per capita increases. Here increase of GDP per capita is resulted from the increase of labor
productivity in manufacturing industry (that is, Ym increases faster than Lm in
s m
s m
Y Y L L
). In this situation, m
s
L
L remaining the same means the labor market
segmentation. In other words, there is restriction for labors to flow from manufacturing industry to service industry. If labor productivity stagnates in service industry but increases in manufacturing industry, the income of manufacturing industry will increase. But different from what Baumol (1967) described, labors will not flow from manufacturing to service industry. Those labors providing advanced producer service with intensive knowledge and skill will be stuck in manufacturing industry and producer service industry is insufficiently developed. Therefore, to relieve the pressure from wage increase in manufacturing industry, added investment on capital and technology equipments is necessary, as well as increased capital-labor proportion.
4. If GDP per capita remains at a certain level and labor productivity in service
industry decreases ( s s
Y
L in (2) decreases), the proportion of service industry in GDP
will decrease no matter m s
L
L is unchanged or increased. If
m
s
L
L is unchanged, it means
there is no flow between two sectors probably because of restriction and increased labor productivity manufacturing industry is mainly driven by more capital and
technology equipments. If m s
L
L increases, it means increase of labor productivity in
10
manufacturing industry attracting more labors from agriculture industry or other regions. The latter one is an evidence of "counter-servitization" after Lewis Turning-Point and quite rare.
5. Suppose that labor productivity in service industry and GDP per capita are fixed.
If m s
L
L increases, the proportion of service industry in GDP will decrease. This is
similar to Situation 4.
6. Suppose that labor productivity in service industry increases, and GDP per capita
remains the same or increases. If the increase margin of m s
L
L is larger than that in
Situation 5, eventually the proportion of service industry in GDP will decrease. There
are two reasons for the increase of m s
L
L . The first reason is that the technological
progress of service industry depends less on labor, but more on intensive investment and updating of capital products, as well as intensive high quality human capital. The second reason is that labor productivity in manufacturing industry is stagnant, but its wage level keeps rising as well with that of service industry caused by increasing labor productivity. In order to reduce cost pressure, the first method is to maintain or enlarge manufacturing scale to absorb more labors. The second method is to absorb human capital with intensive skill and knowledge from service industry to improve the innovation efficiency. The former means slow upgrade of manufacturing industry, while the latter indicates "brain drain" in service industry. Both of them result in accumulatively increase of manufacturing cost and the gradual decrease of profits. In this paper it is called “manufacturing cost disease", which is the counterpart of "Baumol
cost disease".⑦ Therefore, if m s
L
L increases by an enough extent, the proportion of
service industry in GDP will decrease even with increasing labor productivity. Eventually, the effective supply level in service industry is difficult to increase because of low labor input.
In conclusion, the precondition of Situations 3, 4 and 5, which can lead to the development deviation between service industry and overall economy, is that labor productivity in service industry stagnates or decreases. The precondition of Stuation 6 is that labor productivity in service industry increases, which may be resulted from technological progress favoring capital investment, or relative decrease of labor productivity in manufacturing industry. These remain to be examined in the following paragraphs.
To improve the development of service industry and eliminate the deviation, some
⑦
11
actions need to be taken. First, more labors should be absorbed in service industry (the smaller denominator in (2)), which require the break of restrictions on labors’ free flow and improvement of urban service function. Additionally, it is more important to increase the numerator, that is, to improve labor productivity in service industry and increase density of human capital in service industry. If balanced development of manufacturing and service industry means maintaining the same growth rate of output, mere dependence on increasing the proportion of labors in service industry (that is to
decrease m s
L
L ) cannot increase service industry’s contribution to GDP, because the
numerator and denominator become smaller at the same time in (2). Only after more labors absorbed, further increase of labor productivity and high add-value transformation of structure in service industry, the proportion of service industry in GDP may begin to increase. The increase of labor productivity and added value relies on reduction of barriers to producer service industry and promotion of externalizing advanced producer service stages in manufacturing industry. But if balanced
development of service and manufacturing industry means keeping m s
L
L unchanged,
increase of b requests that labor productivity should increase faster in service industry than in manufacturing industry. This calls for more capital investment into service industry, in order to increase intensities of knowledge and skill and undertake more innovation.
(II) Empirical facts: OECD experience and urban data of Yangtze River Delta
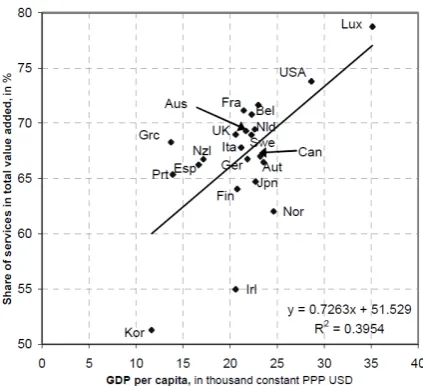
OECD (2005) finds a strong positive relationship between GDP per capita and the share of services in total value added based on the different countries’ data from 2001 and 2002. Figure 1 shows the regression result isy0.7263x51.529. According to
OECD, China’s GDP per capita in 2005 and 2007 is $4,091 and $5,345 respectively. Substituting these into the regression equation above, we can obtain the expected share of services in GDP based on OECD development experience, which is 54.5% and 55.4% respectively and significantly higher than the real data of China: 39.72% and 40.37% respectively.⑧ It means the proportion of service industry in GDP at the same level of GDP per capita in China is lower than what is expected from OECD experience, which further verifies that there exists development deviation between service industry and overall economy in China.
⑧
12
Figure 1: GDP per capita and the share of services in total value added, 2001, 2002
Source: OECD (2005), Enhancing the Performance of the Service Sector
http://www.oecd.org/document/2/0,2340,en_2649_34409_35026178_1_1_1_1,00.html
Now we take the sixteen cities of Yangtze River Delta as an example. It is well known one important change happened in these cities from 2001 to 2007 that they absorbed considerable investment transfer from foreign manufacturing industry. At the same time, many cities tried to increase the share of service industry in GDP, such as Shanghai, Nanjing, Suzhou and so on. It means both manufacturing and service industries develop fast in each city. Figure 2 shows the share of services in GDP in the sixteen cities in Yangtze River Delta goes through rising after falling, but the average level is still around 42% and fluctuation is relatively smooth. On the contrary, economic development measured with GDP per capita keeps increasing. Obviously there exists a development deviation.⑨ Share of service industry in employment shows an obvious decreasing trend, which development of service industry in Yangtze River Delta is not supported by increasing employment. So the yearly increase of labor productivity of service industry in Yangtze River Delta may be originated from slowdown of labor growth. It means the development deviation in Yangtze River Delta must be studied in the situation of increasing labor productivity in service industry. It needs more examination to judge whether it is a case of Situation 6 described above.
⑨
13
0% 10% 20% 30% 40% 50% 60%
0 10 20 30 40 50 60 70 80
2001 2002 2003 2004 2005 2006 2007 2008
GDP Per Capita (Thousand Yuan/Pers Labor Productivity (Te Thousand Yuan/Pers Share of Service Industry in GDP(%)
Share of Service Industry in Employment(%)
Figure 2: Development of sixteen cities of Yangtze River Delta
0 5 10 15 20 25 30 35 40
1999 2000 2001 2002 2003 2004 2005 2006 2007 2008
Labor Productivity in Service Industry (Ten Thousand Yuan/Person)
[image:14.595.134.468.76.254.2]Labor Productivity in Manufacturing Industry (Ten Thousand Yuan/Person)
Figure 3: Comparison of labor productivity between service and manufacturing sector in sixteen cities of Yangtze River Delta
One important premise of the development deviation between service industry and overall economy is that labor productivity (or its increase) is higher in service industry than manufacturing industry. As Figure 3 shows, labor productivity generally is higher in urban service sector than manufacturing sector. The average labor productivity is 191.2 and 136.9 thousand yuan per capita respectively. After 2001, growth rate of labor productivity is also higher in service industry than manufacturing industry and the average level is 20.1% and 11% respectively. All these numbers indicate the existence of the premise of Situation 6. But it is still too early to argue the occurrence of development deviation before the verification that increase of labor productivity in service sector in Yangtze River Delta are more dependent on capital investment.
14
investment and density of non-agricultural population are relatively slow. The growth of these factor densities places a good factor foundation for service sector’s development. But it remains to be verified whether the development of service industry can attract these factors to Yangtze River Delta.
0 5 10 15 20 25
0 1 2 3 4 5 6 7 8 9
2001 2002 2003 2004 2005 2006 2007
Density of Manufacturing Industry (Ten Million Yuan/Square Kilometers)
Density of Foreign Investment (Million Yuan/Square Kilometers)
Density of Non-agricultural Population (Hundred Persons/Square Kilometers)
[image:15.595.135.464.138.331.2]College Students Per Unit Area(Person/Square Kilometers) (shown by vertical axis on the right)
Figure 4: Density of economic activity in the sixteen cities of Yangtze River Delta
When comparing different cities from the aspect of service add-value, Shanghai, Suzhou, Hangzhou, Nanjing and Wuxi were in the top five in 2007.⑩ The top five on labor productivity in service sector are Suzhou, Wuxi, Changzhou, Ningbo and Shaoxing. These cities all have relatively higher economic activity density. (1) The population density, especially non-agricultural population density is large. In 2007, non-agricultural population density in Shanghai was 1,888 per square kilometer, followed by Nanjing, Wuxi and Suzhou. The average level of the top three is four times of Yangzhou, which is the median. (2)The density level of human resources is also high. The top three of college students per square kilometer are Nanjing, Shanghai and Changzhou, whose average is five times of Zhoushan the median. (3)The top three of manufacturing output per square kilometer are Shanghai, Wuxi and Suzhou. Their average level is 3.3 times of Zhenjiang, which is the median. (4) Shanghai, Suzhou and Wuxi are also the top three in attracting foreign investment. Their average level was 3.4 times of Zhenjiang, which is the median. In conclusion, cities with higher level of service development have better performances in other aspects such as population density, human resource agglomeration, manufacturing development and foreign investment attraction.
(III) The hypothesis on the change of labor productivity in service industry: the factor of economic activity density
In order to estimate labor productivity in service industry determined by different factors, this paper uses C-D function to do the decomposition as follow
Y AL K (3)
⑩
15
Divided by L on both sides, we have
Y (K) 1
A L
L L
Take logarithms of both sides, we get:
ln( / )Y L ln Aln(K L/ )( 1 ln) L (4)
From (4), we know that the change of labor productivity can be examined from three
aspects: technology, capital stock per capita and employment. If 1 , it means
there exist decreasing returns to scale in service industry. Higher density of economic activity may lower growth rate of labor productivity in service industry. But if
1
, labor input in service industry has increasing returns to scale.
Since service has the characteristics of intangibility, perishability and simultaneity, service suppliers need to position themselves close to service receivers. And the competition among service suppliers is characterized by decreasing transportation and transaction costs, as well as contacting with as many customers as possible. Even though service can be outsourced with the help of information technology, companies which are outsourced to still try to position in a nearby region. This proximity choice increases density of economic activity in that region and creates conditions for spillover of information, knowledge and technology.
16
population11, density of human capital, density of manufacturing industry, density of foreign investment and so on. These different densities have different influences on labor productivity in service industry.
First let us check the relationship between density of non-agricultural population and labor productivity in service industry. The region with high density of non-agricultural population will have a large market for consumer service, which is beneficial for different services to promote mutually and evolve together. At the same time, it also creates demand for producer service. Eventually service industry will develop into scale economy, with significant spillover of information, knowledge and skill, as well as high possibility of Hicks-neutral technical progress.12 But there are some side effects if density of non-agricultural population is too high. When it exceeds the absorptive capacity of industry, congestion effect will appear such as traffic jam, rising house price and environment pollution. High living and business costs will make high-quality human resources flow out and decrease the spillover effect of knowledge and skill. Among the sixteen cities in Yangtze River Delta, density of non-agricultural population of Suzhou and Ningbo ranks fifth and twelfth, while its labor productivity of service industry ranks second and fifth respectively. On the contrary, density of non-agricultural population of Nanjing and Zhenjiang ranks second and seventh, but its labor productivity ranks ninth and thirteenth respectively. 13 Therefore, some hypotheses can be proposed:
Hypothesis 1: The increased density of non-agricultural population has a positive effect on labor productivity in service industry, but this promoting effect will decrease when the density reaches to a certain extent. In other words, the influence of increasing density of non-agricultural population on growth of labor productivity approximates an inverted U-shape.
The increased density of non-agricultural population is usually accompanied by the increase of density of high-quality human capital. It is not only beneficial for information communication and skill learning, which will increase effective border of potential skill in service industry, but also helpful to promote the upgrade and evolution of consumer service because of high incomes of high-quality labors.14 When manufacturing industry migrated outside the city, high-quality labors remained in the city begin to offer advanced producer service, which will help producer service in manufacturing industry to move to the high-end of value chain by outsourcing. Finally, the scale economy of service industry will further develop and its labor productivity will increase. Advanced producer service is knowledge-intensive and skill-intensive activity with huge potential in knowledge and technology innovation. When density of human capital reaches to a certain degree, producer service industry is likely to have
11 The authors replace traditional polulation density with density of non-agricultural population because there is a large population in China and high population density is often observed for historical reasons, which can’t entirely reflect density of economic activity in that region. In general, a region with high density of non-agricultural poulation shows obvious agglomeration effect.
12 According to Duranton and Puga (2004), those people who have a better expectation of themselves will gather in big cities, so cities will have more high-quality talents, which is good for the communication and spread of knowledge.
17
increasing returns to scale. As a result, the second hypothesis can be proposed:
Hypothesis 2: There is a positive correlation between growth of density of human capital and growth of labor productivity in service industry. After density of human capital reaches to certain level, growth of labor productivity will be accelerated. In other word, the relationship between them exhibits U-shape.
Districts with higher density of manufacturing industry tend to have higher labor productivity in service industry. The reasons include that a large amount of producer service is needed as middle input in manufacturing industry. Districts with larger manufacturing scale will have larger scale of employment and income, as well as larger scale and scope of demand for consumer and producer service. Moreover, scale and scope of public service is also lager with more local fiscal revenue. In above-mentioned situations, labor productivity in service industry will increase with a fixed density of non-agricultural population. With the increase of wage and land cost, manufacturing industry moves out the city and leaves space for service industry’s development. Then the city will attract more non-agricultural labors, especially high-quality human resource. The manufacturing industry of those districts with high labor productivity in service industry such as Wuxi, Suzhou, Ningbo and Jiaxing is developing rapidly and steadily, and the number of city population scale is redoubled. However, one phenomenon is noticeable. In the process of China joining the global value chain with low cost factors, manufacturing industry focuses on processing stage and has a low demand for advanced producer service. Therefore, low end manufacturing industry moves out of the city and is replaced with product manufacturing industry of high technology, which will absorb many labors and high-quality human resources. Consequently, demand for advanced producer service is insufficient and the increase of labor productivity in service industry will slow down. On the basis of Hypothesis 1 and 2, we propose that:
Hypothesis 3: Growth of density of manufacturing industry will significantly promote the growth of labor productivity in service industry. Under the background of joining global value chain from low end, the promotion effect will be decreased after density of manufacturing industry reaches to some degree. In other word, there is an inverted U-shape relationship between growth of manufacturing density and labor productivity in service industry.
18
R&D, design, system integration and channel service, etc. All these derived demands will expand the scale and scope of service industry. When non-agricultural population is unchanged or growing at a low rate, labor productivity in service industry will increase. Due to the pressure of rising factor costs such as labor, land and energy, local governments may move manufacturing industry out of the urban area and look for advanced producer service, such as foreign R&D centers and venture capital institutions, etc. It will further increase labor productivity of service industry in this region. Based on above analyses, the forth hypothesis can be proposed:
Hypothesis 4: Growth of density of foreign manufacturing investment is positively correlated with growth of labor productivity in service industry. When advanced producer service becomes the major component of foreign investment, labor productivity in service industry will further increase.
IV. Specification of Variables and Descriptive Statistics
(I) Specification of Variables
In order to test the hypotheses above, we use panel data of the sixteen cities in Yangtze River Delta from 2001 to 2007 in order to investigate the relationship between different indexes of density of economic activity and labor productivity in service industry. 15The basic model is as follow:
it it it it k it
ln(Y / L ) i ln(k / L ) ( 1) lnLit
ditu (5)it it 0 it it k
ln(Y / L ) ln(k / L ) ( 1) lnLit
dit vit (6)In equation (6) vit i uit, where the subscript i stands for city and t stands for
time. Equation (5) is the fixed effect model, and equation (6) is the random effect model. The difference between them is the correlation between the unobserved effect
i
and explanatory variables. Variable dit stands for the index of economic activity
density except capital per capita and employment population in service industry. The econometric model can be written as:
1 2 1 2 3 4 it
lnsyp i lnkpj lnl lnuapd lndxs lnmdp lnapfi u
16
(7)
The specification of variables in the model is as following:17
1. Labor productivity in service industry (syp, 10,000 yuan per person), which is
/ L
Y in the model. According to the definition of labor productivity in service industry,
15 The sixteen countries are Shanghai, Nanjing, Wuxi, Changzhou, Suzhou, Nantong, Yangzhou, Zhenjiang, Taizhou, Hangzhou, Ningbo, Jiaxing, Huzhou, Shaoxing, Zhoushan and Taizhou. The use of panel data can deal with unobservable individual effect and time effect. And the panel data contain more information, which may decrease the possibility of collinearity.
16 In a similar way, the function of random effect is:
0 1 2 1 2 3 4 it
lnsyp lnkpj lnl lnuapd lndxs lnmdp lnapfiv
19
data is obtained from real GDP of tertiary industry in each city divided by employment population in tertiary industry in year-end. Here we also use weighted average of consumer price index and price index for investment in fixed assets to replace GDP deflator. The former is a close substitute of the latter in reality.18
2. Fixed capital stock in service industry per capita (kpj, yuan per person). This index can be obtained from capital stock divided by employment population in service industry. The basic calculation method in related literature is perpetual inventor system
created by Goldsmith in 1951, with the basic formula of Kt It (1 t)Kt1.
19
The
key point is to choose appropriate indexes such as investment of current year It,
capital stock of base year and the rate of depreciation t when calculating capital
stock using the formula. According to the research of Zhang and Zhang (2003), we use gross fixed capital formation to represent the investment of current year. Capital stock of the basic year is that of service industry in each city in 2001. Referring to the method of Hall and Jones (1999), the capital stock equals fixed capital formation of basic year divided by the sum of depreciation rate (equal to 6% in this paper) and the average geometric growth rate of fixed capital stock in the following six years after base year.20 The determination of price index of fixed capital investment has also referred to the price indexes of Shanghai, Jiangsu and Zhejiang.21
3. Employment population in service industry (l, ten thousand persons). We can get related data directly from employment population in tertiary industry at year end in statistical yearbook.
4. Density of non-agricultural population (uapd, person per square kilometer). Related data can be obtained from non-agricultural population in each city divided by land area. Density of non-agricultural population reflects intensity of economic activity in one region and the scale of the market. According to the hypothesis, we also calculate square of density of non-agricultural population.
5. Density of human capital (dxs, person per square kilometer). We use the number of college students per unit of area to represent this variable.22
18 Since the data are hard to obtain, each city’s GDP deflator is replaced by GDP deflators of the province where the city is located.
19 This system has been accepted widely by OECD countries. Its economic meaning is that capital stock is equal to net capital stock of the last year (total capital stock minus depreciation of capital) plus investment of that year. 20 The data of industrial growth are quite good while the data of fixed capital stock’s growth are not so accurate because of unavailability. In order to reduce the estimated error, the authors used growth rate of tertiary industry to replace the average geometric growth rate of fixed capital stock. By calculating, the authors find that the growth rate of tertiary industry of three provinces in the last 7 years is approximately 13%. So the fixed capital stock in base year equals invsetment in base years divided by 19%.
21 Data of fixed assets in service industry in related cities are explained here. In the statistical yearbooks, the data of fixed assets in service industry are not comprehensive. In this paper, data of fixed asset investment of 2006 and 2007 are obtained by summing total investment in fixed assets of different industries, according to "Yangtze River Delta & Pearl River Delta and Hong Kong & Macao SAR Statistical Yearbook”. From 2001 to 2005, some data of investment of tertiary-industry can be found in the above yearbook and the rest is filled by other data from statistical yearbook of each city. But there are still some unavailable data, which finally are estimated by using variation tendency and simulation of total investment curve. The investment data of Taizhou and Zhoushan are seriously absent, so we have excluded them in the regression. Otherwise the gross fixed capital stock will significantly depart from real value when using perpetual inventory method.
20
6. Density of manufacturing industry (mdp, ten thousand yuan per square kilometer), that is the add-value of manufacturing in per unit of area. This variable reflects the development and concentration degree of manufacturing industry in one area. Calculation of it is also referred to the price indexes of three provinces.
7. Density of foreign investment (apfi, ten thousand yuan per square kilometer), that is the amount of foreign capital used in one region. This variable reflects the degree of the region’s usage of foreign investment. We convert foreign investment into the value of RMB according to the average exchange rate between USD and RMB.
(II) Descriptive Statistics
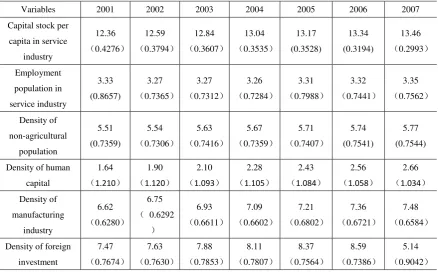
[image:21.595.73.512.352.624.2]According to the setting of the model, we take the logarithm of all variables in order to cancel dimension and reflect elasticity of different factors. Table 1 gives descriptive statistical analysis of variables. From the table, we can see that the variables such as capital stock per capita in service industry, density of non-agricultural population and density of manufacturing industry all show increasing tendency. But compared with 2001, employment population in service industry in 2002 has decreased by a wide margin, and then it remains at a lower level until 2005.
Table 1: Statistical description of variables (2001-2007)
Variables 2001 2002 2003 2004 2005 2006 2007
Capital stock per capita in service
industry
12.36
(0.4276)
12.59
(0.3794)
12.84
(0.3607)
13.04
(0.3535)
13.17 (0.3528)
13.34 (0.3194)
13.46
(0.2993)
Employment population in service industry 3.33 (0.8657) 3.27
(0.7365)
3.27
(0.7312)
3.26
(0.7284)
3.31
(0.7988)
3.32
(0.7441)
3.35
(0.7562)
Density of non-agricultural population 5.51 (0.7359) 5.54
(0.7306)
5.63
(0.7416)
5.67
(0.7359)
5.71
(0.7407)
5.74 (0.7541)
5.77 (0.7544)
Density of human capital
1.64
(1.210)
1.90
(1.120)
2.10
(1.093)
2.28
(1.105)
2.43
(1.084)
2.56
(1.058)
2.66
(1.034)
Density of manufacturing
industry
6.62
(0.6280)
6.75
( 0.6292
)
6.93
(0.6611)
7.09
(0.6602)
7.21
(0.6802)
7.36
(0.6721)
7.48
(0.6584)
Density of foreign investment
7.47
(0.7674)
7.63
(0.7630)
7.88
(0.7853)
8.11
(0.7807)
8.37
(0.7564)
8.59
(0.7386)
5.14
(0.9042)
Notes: In the table are the average values of different years with standard error in the brackets.
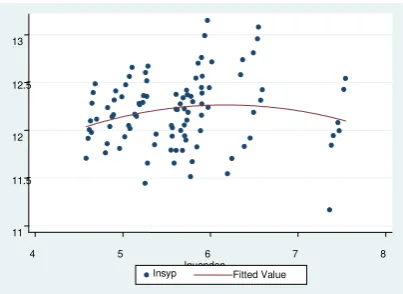
In order to illustrate the influence of different variables on labor productivity in service industry intuitively, Figure 5 to 8 show the scatter diagrams of labor productivity in service industry with density of non-agricultural population, density of human capital, density of manufacturing industry and density of foreign investment respectively.
21
[image:22.595.195.403.277.424.2]Figure 5: Scatter diagram of relationship between labor productivity and density of non-agricultural population
[image:22.595.197.400.450.598.2]Figure 6: Scatter diagram of relationship between labor productivity and density of human capital
Figure 7: Scatter diagram of relationship between labor productivity and density manufacturing industry
11 11.5 12 12.5 13
4 5 6 7 8
lnuapden lnsyp Fitted Value
11 11.5 12 12.5 13
0 1 2 3 4 5
lndxs
lnsyp Fitted Value
11 11.5 12 12.5 13
6 7 8 9
lnmdp
22
Figure 8: Scatter diagram of relationship between labor productivity and density of foreign investment
It is easy to find that labor productivity in service industry is positively correlated with density of manufacturing industry and density of foreign investment respectively. But the correlation between density of non-agricultural population and labor productivity in service industry is not significant. With the increase of non-agricultural population density, labor productivity in service industry experiences decreasing after the increase in the early stage. These results still need further verification.
V. Estimation and Verification of Hypotheses
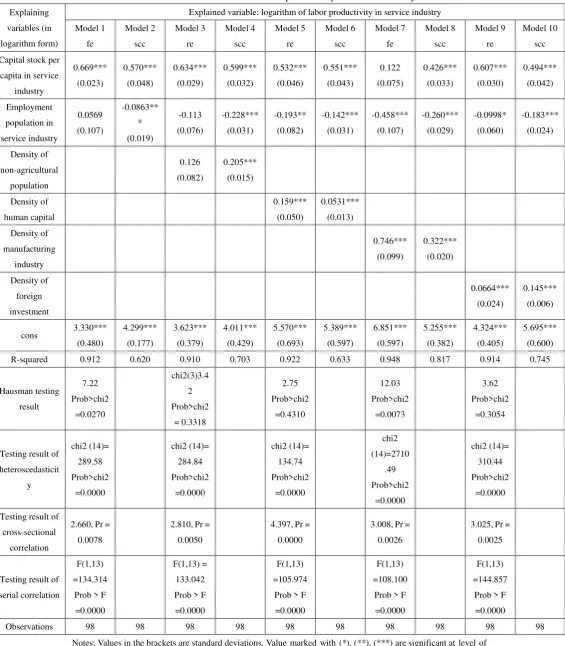
Based on panel data of 16 cities in Yangtze River Delta from 2001 to 2007, this paper uses Hausman test to compare fixed versus random affect.From the model, we find existence of cross-sectional heteroscedasticity, cross-sectional correlation and first order autocorrelation. So the authors adopt SCC regression method of Driscoll-Kraay standard error to solve the problem. Table 2 and 3 show fixed effect and random effect respectively and specific results of SCC test.
11 11.5 12 12.5 13
2 3 4 5 6 7
lnapfi
23
Table 2: Estimation result of labor productivity in service industry
Explaining variables (in logarithm form)
Explained variable: logarithm of labor productivity in service industry Model 1 fe Model 2 scc Model 3 re Model 4 scc Model 5 re Model 6 scc Model 7 fe Model 8 scc Model 9 re Model 10 scc Capital stock per
capita in service industry 0.669*** (0.023) 0.570*** (0.048) 0.634*** (0.029) 0.599*** (0.032) 0.532*** (0.046) 0.551*** (0.043) 0.122 (0.075) 0.426*** (0.033) 0.607*** (0.030) 0.494*** (0.042) Employment population in service industry 0.0569 (0.107) -0.0863** * (0.019) -0.113 (0.076) -0.228*** (0.031) -0.193** (0.082) -0.142*** (0.031) -0.458*** (0.107) -0.260*** (0.029) -0.0998* (0.060) -0.183*** (0.024) Density of non-agricultural population 0.126 (0.082) 0.205*** (0.015) Density of human capital 0.159*** (0.050) 0.0531*** (0.013) Density of manufacturing industry 0.746*** (0.099) 0.322*** (0.020) Density of foreign investment 0.0664*** (0.024) 0.145*** (0.006)
cons 3.330***
(0.480) 4.299*** (0.177) 3.623*** (0.379) 4.011*** (0.429) 5.570*** (0.693) 5.389*** (0.597) 6.851*** (0.597) 5.255*** (0.382) 4.324*** (0.405) 5.695*** (0.600)
R-squared 0.912 0.620 0.910 0.703 0.922 0.633 0.948 0.817 0.914 0.745
Hausman testing result 7.22 Prob>chi2 =0.0270 chi2(3)3.4 2 Prob>chi2 = 0.3318 2.75 Prob>chi2 =0.4310 12.03 Prob>chi2 =0.0073 3.62 Prob>chi2 =0.3054
Testing result of heteroscedasticit y chi2 (14)= 289.58 Prob>chi2 =0.0000 chi2 (14)= 284.84 Prob>chi2 =0.0000 chi2 (14)= 134.74 Prob>chi2 =0.0000 chi2 (14)=2710 .49 Prob>chi2 =0.0000 chi2 (14)= 310.44 Prob>chi2 =0.0000
Testing result of cross-sectional
correlation
2.660, Pr = 0.0078
2.810, Pr = 0.0050
4.397, Pr = 0.0000
3.008, Pr = 0.0026
3.025, Pr = 0.0025
Testing result of serial correlation
F(1,13) =134.314
Prob > F =0.0000
F(1,13) = 133.042 Prob > F =0.0000
F(1,13) =105.974
Prob > F =0.0000
F(1,13) =108.100
Prob > F =0.0000
F(1,13) =144.857
Prob > F =0.0000
Observations 98 98 98 98 98 98 98 98 98 98
24
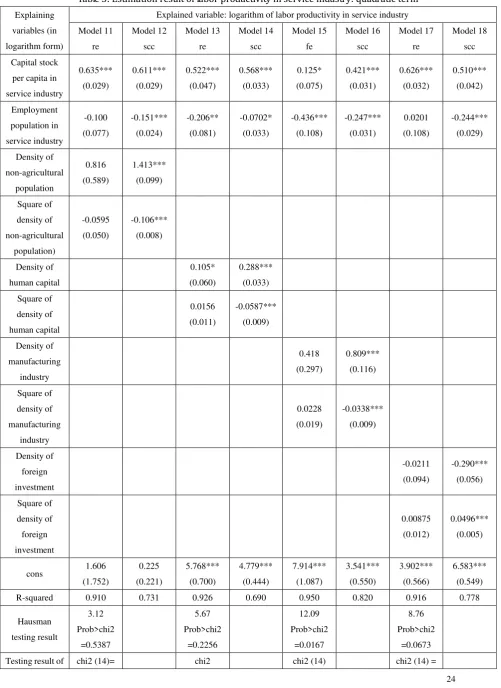
Table 3: Estimation result of labor productivity in service industry: quadratic term
Explaining variables (in logarithm form)
Explained variable: logarithm of labor productivity in service industry Model 11 re Model 12 scc Model 13 re Model 14 scc Model 15 fe Model 16 scc Model 17 re Model 18 scc Capital stock
per capita in service industry 0.635*** (0.029) 0.611*** (0.029) 0.522*** (0.047) 0.568*** (0.033) 0.125* (0.075) 0.421*** (0.031) 0.626*** (0.032) 0.510*** (0.042) Employment population in service industry -0.100 (0.077) -0.151*** (0.024) -0.206** (0.081) -0.0702* (0.033) -0.436*** (0.108) -0.247*** (0.031) 0.0201 (0.108) -0.244*** (0.029) Density of non-agricultural population 0.816 (0.589) 1.413*** (0.099) Square of density of non-agricultural population) -0.0595 (0.050) -0.106*** (0.008) Density of human capital 0.105* (0.060) 0.288*** (0.033) Square of density of human capital 0.0156 (0.011) -0.0587*** (0.009) Density of manufacturing industry 0.418 (0.297) 0.809*** (0.116) Square of density of manufacturing industry 0.0228 (0.019) -0.0338*** (0.009) Density of foreign investment -0.0211 (0.094) -0.290*** (0.056) Square of density of foreign investment 0.00875 (0.012) 0.0496*** (0.005)
cons 1.606
(1.752) 0.225 (0.221) 5.768*** (0.700) 4.779*** (0.444) 7.914*** (1.087) 3.541*** (0.550) 3.902*** (0.566) 6.583*** (0.549)
R-squared 0.910 0.731 0.926 0.690 0.950 0.820 0.916 0.778
Hausman testing result 3.12 Prob>chi2 =0.5387 5.67 Prob>chi2 =0.2256 12.09 Prob>chi2 =0.0167 8.76 Prob>chi2 =0.0673
25 heteroscedastici
ty
274.89 Prob>chi2
=0.0000
(14)=644.9 5 Prob>chi2
= 0.0000
=1415.89 Prob>chi2 =0.0000
357.49 Prob>chi2
=0.0000
Testing result of cross-sectional
correlation
2.833, Pr = 0.0046
4.602, Pr = 0.0000
2.621, Pr = 0.0088
2.706, Pr = 0.0068
Testing result of serial correlation
F(1,13)=12 4.536 Prob > F =0.0000
F(1,13)= 77.798 Prob > F
=0.0000
F(1,13)= 96.940 Prob > F =0.0000
F(1,13)=14 6.294 Prob>F=0.
0000
Observations 98 98 98 98 98 98 98 98
Notes: Values in the brackets are standard deviations. Value marked with (*), (**), (***) are significant at level of 10%, 5% and 1% respectively. In this table, “fe” and “re” stand for the result of fixed and random effect respectively, and “scc” for SCC test.
Model 1 and 2 inspect the influence of capital stock per capita and employment population in service industry on labor productivity in service industry. The results reveal that there is a positive correlation between capital stock per capita and labor productivity in service industry. When per capita capital increases by 1%, labor productivity in service industry increases by 0.661%. There is a negative correlation between employment population in service industry and labor productivity with the elastic coefficient of -0.0863. According to equaiton (5), we know that labor’s output elastic coefficient is 0.3027 and 1, which means that the development of
service industry in Yangtze River Delta is mainly driven by capital investment. However, service industry still has the feature of decreasing returns to scale when the level of service technology is certain.
When checking density of economic activity’s influence on labor productivity, the authors try to avoid multicollinearity among variables by introducing variables into the regression equation one by one, which include density of non-agricultural population (and its square), density of human capital, density of manufacturing industry and density of foreign investment. The results show that most of four hypotheses proposed above can be verified with the details below:
(1) The relationship between density of non-agricultural population and labor productivity in service industry is shown in Model 4 and 12. Labor productivity in service industry is positively correlated with density of non-agricultural population but negatively correlated with its square. It means that with the increasing density of non-agricultural populatio, labor productivity in service industry goes up first and decreases when the density reaches to a certain level. The influence of density of non-agricultural population on labor productivity in service industry does take on an inverted U-shape.
26
significantly positively correlated with human capital density but significantly negatively correlated with its square. This means that when density of human capital reaches to a certain level, its influence on labor productivity in service industry takes on an inverted U-shape, which contradicts Hypothesis 2. Combining this with the result of Model 2, we can further conclude that though continuous decreasing of labor inputs in service industry at the present stage increases labor productivity (by decreasing the
denominator of s s
Y
L ), high labor productivity supported by human capital means the
service industry with intensive knowledge and skill has been well supported. Since service industry has decreasing returns to scale as a whole, the relationship between density of human capital and labor productivity in service industry will inevitably exhibit reverted U-shape. It implies that skill-intensive service industry has not obtained increasing revenues with rising density of human capital. Inadequate innovation in service industry and insufficient competition caused by entry barriers in China are important reasons.
(3) Density of manufacturing industry has an obviously positive effect on labor productivity in service industry, as shown in Model 8. But the coefficient of its square is negative in Model 16. This implies that when the density of manufacturing industry reaches to some level, its influence on labor productivity in service industry becomes negative, which verifies Hypothesis 3. The reason is that development of manufacturing and service industry benefits each other on one hand and competes for limited resources on the other hand. Under the performance evaluation system and economic policy at present, government’s officials tend to attract manufacturing investment because of its obvious and instant contribution to GPD and employment. Local government’s excessive support for manufacturing industry will makes service industry underdeveloped.
(4) Density of foreign investment has a positive correlation with labor productivity in service industry, as shown in Models 10 and 18. At the present stage attraction of investment is focused on manufacturing industry in Yangtze River Delta, which actually creates service demand in some way, including producer service of foreign investment accompanied with manufacturing investment. The small coefficient of first order indicates that it has a weak influence. The regression result of its square shows obviously positive correlation with labor productivity, which means labor productivity in service industry will be further increased after density of foreign investment reaches to a certain degree.
27
manufacturing industry and density of non-agricultural population. The weak group includes density of human capital and density of foreign investment. It means that service industry’s development at the present stage is more determined by the development of industrialization but less by urbanization supported by high-quality human capital.
VI. Conclusion and further discussion
Based on the theoretical models and testing results, generally density of economic activity in Yangtze River Delta can promote labor productivity in service industry. However, the increase of labor productivity in service industry is mostly driven by capital investment. Growth rate of employment in service industry is decreasing and output of service industry as a whole has decreasing returns to scale. This means that more and more non-agricultural population is entering manufacturing industry to meet its demand for labor during its expansion. Density of manufacturing industry has a strong promotion effect on labor productivity in service industry. Density of non-agricultural population and density of manufacturing industry are both faced with the restraints of inverted U-shape trend. This proves that the scale of manufacturing industry has become larger and absorbed more non-agricultural population. One part of high-quality human capital has been concentrated in knowledge-intensive and skill-intensive service industries, but it raises labor productivity with declining margin. Density of foreign investment can increase labor productivity, which takes on U-shape feature. With the increased level of opening-up in service industry to foreign investment, density of foreign investment will improve the growth of labor productivity. However, increase of labor productivity in service industry is more dependent on entry, competition and growing-up of service industries with intensive knowledge and human capital.
These judgments have offered explanations for the “mystery of development deviation”. Increasing of labor productivity in service industry causes "manufacturing cost disease" and leads to the development deviation between service industry and overall economy. To be specific, growth of labor productivity in service industry relies on investment. Flow of non-agricultural population into manufacturing industry enlarges its scale and increase GDP per capita (ain Equation (1)). The continuous increase of labor productivity will raise wage level in service industry, as well as manufacturing industry later. In order to eliminate the cost pressure, manufacturing industry will continue to enlarge its scale by attracting more non-agricultural labors to maintain the advantage of low cost. In contrast, low level development of knowledge-intensive and skill-intensive service industries supported by high-quality human capital has a limited contribution to the growth of labor productivity in service
industry. Finally, employment in service industry decreases, making m s
L
L increase. In