Munich Personal RePEc Archive
An Analysis of the Underlying Causes of
the Poor Performance of Recent
Immigrants Using the 2006 Census
PUMF and Some Observations on Their
Implications for Immigration Policy
Grady, Patrick
Global Economics Ltd.
Global Economics Ltd.
An Analysis of the Underlying Causes of the Poor Performance
of Recent Immigrants Using the 2006 Census PUMF and Some
Observations on Their Implications for Immigration Policy
By
Patrick Grady
Abstract:
This paper examines the poor performance of recent immigrants to Canada in the labour market as revealed in the Statistics Canada Census 2006 Public Use Microdata File (PUMF). It presents the data which shows that immigrants from less developed countries are doing much worse than immigrants from industrialized countries. Using regression analysis it shows that key explanatory variable for their poor performance are the location of their education, their visible minority status, their language skills, and the level of GDP in their countries of origin. A profiling of immigrants who have done better than non-immigrant Canadians suggests that the performance of immigrants could be
improved by utilizing information from the Census on the characteristics of immigrants who succeed in labour markets to improve the selection criteria and distribution of points used in the current scoring system to chose immigrants.
JEL Classification Codes:J23 – Labour demand; J24 – Human Capital; Skills; Occupational Choice; Labor Productivity; J61 – Geographic mobility, immigrant workers.
Introduction
The aggregate data from the 2006 census (Statistics Canada, 2008) confirmed that the
deterioration of the performance of recent immigrants, arriving since 1990 following the
big increase in the number of immigrants admitted after 1987, is ongoing. But it also left
many questions unanswered about why some recent immigrants are doing better than
others.
Recently, more disaggregated data on the economic performance of immigrants was
made available to researchers in the 2006 Census Public Use Microdata File (PUMF). It
contains 844,476 records, presenting much relevant census data for individuals
representing a sample of 2.7 per cent of the Canadian population. This includes data on
the employment income earned by immigrants and some of its important underlying
determinants.
This paper uses the disaggregated Census data to explore the differential economic
performance of recent immigrants based on their countries or regions of origin using both
descriptive and statistical methods. Since the Census does not provide a breakdown of
immigrants into economic class, family class and refugees, it is necessary to lump all of
The Census 2006 PUMF Data
The data on the employment earnings of recent immigrants arriving since 1990 and up to
2004 for the year 2005 are provided in Table 1. Employment income as defined by
Statistics Canada in the Census 2006 PUMF “refers to total income received by persons
15 years of age and over during calendar year 2005 as wages and salaries, net income
from a non-farm unincorporated business and/or professional practice, and/or net farm
self-employment income” (Statistics Canada, 2009, p.75). The data reveals that all of
these immigrants only earned an average of $25,714 in 2005 with immigrants in the
country longer doing better than the most recently arrived. Nevertheless, it is still
striking that on average recent immigrants only earned 69.1 per cent of the amount
earned by non-immigrants in the same year.
The employment income of recent immigrants is used to rank countries and regions from
the highest to lowest in terms of the employment income earned by its emigrants using
Place of Birth information from the Census as a proxy for country or region of origin
(Table 2). It highlights the starkly different performance with income running from highs
of $49,293 for those coming from the United Kingdom and $45,144 for the United States,
Other Southern Asia, the People's Republic of China, Pakistan, West Central Asia and the
Middle East, Other Eastern Asia, all in descending order, do worse that the average of all
recent immigrants with those immigrants coming from Other Eastern Asia only earning
41 per cent of non-immigrants.
Some of the differences in the employment income of recent immigrants among countries
and regions can probably be explained by the different composition of immigrants. Other
studies have shown in the past that refugee class immigrants earn much less than other
immigrants and that family class earn less than economic class. Unfortunately, the 2006
Census does not contain any data on the class of immigrants that can be used to shed
additional light on the difference in employment income among countries and regions.
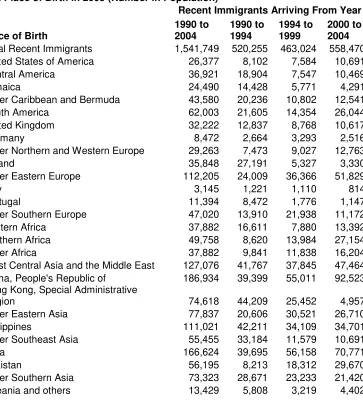
Information on the number of immigrants coming from the various countries and regions
is provided in Tables 5 and 6. Table 5 shows the number in the sample in the Census
2006 PUMF database and Table 6 shows the numbers in the population calculated by
multiplying the sample numbers by the weight 36.99457, which is the number of
individuals in the population represented by each observation in the sample.
It is worth noting that 1,048,024 or more than two-thirds of the immigrants classified by
the Census as being admitted between 1990 and 2004 earned less than $25,714 in 2005,
which is the average employment income earned by recent immigrants in 2005 and
amounts only to 69.1 per cent of the employment income of non-immigrants. This is why
there is such a growing problem of poverty among immigrants in the expanding ethnic
Table 1: Employment Income of Recent Immigrants by Year of Arrival and Place of Birth in 2005 (dollars)
Recent Immigrants Arriving From Year
Place of Birth
1990 to 2004 1990 to 1994 1994 to 1999 2000 to 2004 Total Recent Immigrants 25,714 28,768 27,590 21,314 United States of America 45,144 54,650 39,609 41,867 Central America 22,572 23,691 24,708 19,011
Jamaica 28,219 28,617 28,382 26,664
Other Caribbean and Bermuda 22,480 25,583 20,058 19,558 South America 24,916 27,899 26,423 21,610 United Kingdom 49,293 55,984 48,555 41,812
Germany 34,777 27,597 34,607 42,601
Other Northern and Western Europe 37,291 39,227 40,557 33,848
Poland 31,071 32,669 26,926 24,656
Other Eastern Europe 32,368 35,472 39,780 25,730
Italy 31,600 29,667 31,900 34,091
Portugal 29,789 30,655 27,167 27,452
Other Southern Europe 32,215 41,772 31,603 21,517 Eastern Africa 23,723 26,107 24,947 20,046 Northern Africa 24,001 33,139 33,899 16,004 Other Africa 34,695 47,250 34,600 27,141 West Central Asia and the Middle East 20,033 22,849 24,720 13,817 China, People's Republic of 21,411 22,239 25,963 18,351 Hong Kong, Special Administrative
Region 25,798 29,325 21,257 17,657
Other Eastern Asia 15,245 16,801 15,474 13,784 Philippines 28,147 29,446 29,489 25,249 Other Southeast Asia 22,198 23,116 22,637 18,872
India 25,030 26,981 26,362 22,878
Pakistan 20,198 23,405 25,538 16,015
Other Southern Asia 21,483 25,658 21,151 16,256 Oceania and others 30,658 28,783 27,678 35,309
Table 2: Employment Income of Recent Immigrants by Year of Arrival and Place of Birth in 2005 (dollars)
Sorted in Descending Order for Whole Period
Recent Immigrants Arriving From Year
Place of Birth
1990 to 2004 1990 to 1994 1994 to 1999 2000 to 2004 Total Recent Immigrants 25,714 28,768 27,590 21,314 United Kingdom 49,293 55,984 48,555 41,812 United States of America 45,144 54,650 39,609 41,867 Other Northern and Western Europe 37,291 39,227 40,557 33,848
Germany 34,777 27,597 34,607 42,601
Other Africa 34,695 47,250 34,600 27,141 Other Eastern Europe 32,368 35,472 39,780 25,730 Other Southern Europe 32,215 41,772 31,603 21,517
Italy 31,600 29,667 31,900 34,091
Poland 31,071 32,669 26,926 24,656
Oceania and others 30,658 28,783 27,678 35,309
Portugal 29,789 30,655 27,167 27,452
Jamaica 28,219 28,617 28,382 26,664
Philippines 28,147 29,446 29,489 25,249 Hong Kong, Special Administrative
Region 25,798 29,325 21,257 17,657
India 25,030 26,981 26,362 22,878
South America 24,916 27,899 26,423 21,610 Northern Africa 24,001 33,139 33,899 16,004 Eastern Africa 23,723 26,107 24,947 20,046 Central America 22,572 23,691 24,708 19,011 Other Caribbean and Bermuda 22,480 25,583 20,058 19,558 Other Southeast Asia 22,198 23,116 22,637 18,872 Other Southern Asia 21,483 25,658 21,151 16,256 China, People's Republic of 21,411 22,239 25,963 18,351
Pakistan 20,198 23,405 25,538 16,015
West Central Asia and the Middle East 20,033 22,849 24,720 13,817 Other Eastern Asia 15,245 16,801 15,474 13,784
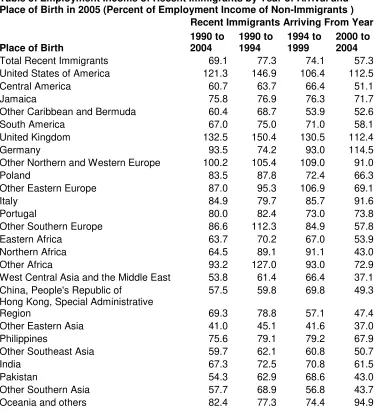
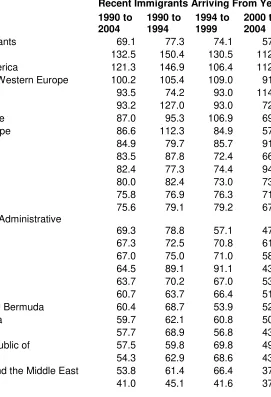
Table 3: Employment Income of Recent Immigrants by Year of Arrival and Place of Birth in 2005 (Percent of Employment Income of Non-Immigrants )
Recent Immigrants Arriving From Year
Place of Birth
1990 to 2004 1990 to 1994 1994 to 1999 2000 to 2004 Total Recent Immigrants 69.1 77.3 74.1 57.3 United States of America 121.3 146.9 106.4 112.5
Central America 60.7 63.7 66.4 51.1
Jamaica 75.8 76.9 76.3 71.7
Other Caribbean and Bermuda 60.4 68.7 53.9 52.6
South America 67.0 75.0 71.0 58.1
United Kingdom 132.5 150.4 130.5 112.4
Germany 93.5 74.2 93.0 114.5
Other Northern and Western Europe 100.2 105.4 109.0 91.0
Poland 83.5 87.8 72.4 66.3
Other Eastern Europe 87.0 95.3 106.9 69.1
Italy 84.9 79.7 85.7 91.6
Portugal 80.0 82.4 73.0 73.8
Other Southern Europe 86.6 112.3 84.9 57.8
Eastern Africa 63.7 70.2 67.0 53.9
Northern Africa 64.5 89.1 91.1 43.0
Other Africa 93.2 127.0 93.0 72.9
West Central Asia and the Middle East 53.8 61.4 66.4 37.1 China, People's Republic of 57.5 59.8 69.8 49.3 Hong Kong, Special Administrative
Region 69.3 78.8 57.1 47.4
Other Eastern Asia 41.0 45.1 41.6 37.0
Philippines 75.6 79.1 79.2 67.9
Other Southeast Asia 59.7 62.1 60.8 50.7
India 67.3 72.5 70.8 61.5
Pakistan 54.3 62.9 68.6 43.0
Other Southern Asia 57.7 68.9 56.8 43.7 Oceania and others 82.4 77.3 74.4 94.9
Table 4: Employment Income of Recent Immigrants by Year of Arrival and Place of Birth in 2005 (Percent of Employment Income of Non-Immigrants) Sorted in Descending Order for Whole Period
Recent Immigrants Arriving From Year
Place of Birth
1990 to 2004 1990 to 1994 1994 to 1999 2000 to 2004 Total Recent Immigrants 69.1 77.3 74.1 57.3 United Kingdom 132.5 150.4 130.5 112.4 United States of America 121.3 146.9 106.4 112.5 Other Northern and Western Europe 100.2 105.4 109.0 91.0
Germany 93.5 74.2 93.0 114.5
Other Africa 93.2 127.0 93.0 72.9
Other Eastern Europe 87.0 95.3 106.9 69.1 Other Southern Europe 86.6 112.3 84.9 57.8
Italy 84.9 79.7 85.7 91.6
Poland 83.5 87.8 72.4 66.3
Oceania and others 82.4 77.3 74.4 94.9
Portugal 80.0 82.4 73.0 73.8
Jamaica 75.8 76.9 76.3 71.7
Philippines 75.6 79.1 79.2 67.9
Hong Kong, Special Administrative
Region 69.3 78.8 57.1 47.4
India 67.3 72.5 70.8 61.5
South America 67.0 75.0 71.0 58.1
Northern Africa 64.5 89.1 91.1 43.0
Eastern Africa 63.7 70.2 67.0 53.9
Central America 60.7 63.7 66.4 51.1
Other Caribbean and Bermuda 60.4 68.7 53.9 52.6 Other Southeast Asia 59.7 62.1 60.8 50.7 Other Southern Asia 57.7 68.9 56.8 43.7 China, People's Republic of 57.5 59.8 69.8 49.3
Pakistan 54.3 62.9 68.6 43.0
Table 5: Recent Immigrants Reporting Employment Income by Year of Arrival and Place of Birth in 2005 (Number in Sample)
Recent Immigrants Arriving From Year
Place of Birth
1990 to 2004 1990 to 1994 1994 to 1999 2000 to 2004 Total Recent Immigrants 41,675 14,063 12,516 15,096 United States of America 713 219 205 289
Central America 998 511 204 283
Jamaica 662 390 156 116
Other Caribbean and Bermuda 1,178 547 292 339
South America 1,676 584 388 704
United Kingdom 871 347 237 287
Germany 229 72 89 68
Other Northern and Western Europe 791 202 244 345
Poland 969 735 144 90
Other Eastern Europe 3,033 649 983 1,401
Italy 85 33 30 22
Portugal 308 229 48 31
Other Southern Europe 1,271 376 593 302
Eastern Africa 1,024 449 213 362
Northern Africa 1,345 233 378 734
Other Africa 1,024 266 320 438
West Central Asia and the Middle East 3,435 1,129 1,023 1,283 China, People's Republic of 5,053 1,065 1,487 2,501 Hong Kong, Special Administrative
Region 2,017 1,195 688 134
Other Eastern Asia 2,104 557 825 722
Philippines 3,001 1,141 922 938
Other Southeast Asia 1,499 897 313 289
India 4,504 1,073 1,518 1,913
Pakistan 1,519 222 495 802
Other Southern Asia 1,982 775 628 579
Oceania and others 363 157 87 119
Table 6: Recent Immigrants Reporting Employment Income by Year of Arrival and Place of Birth in 2005 (Number in Population)
Recent Immigrants Arriving From Year
Place of Birth
1990 to 2004 1990 to 1994 1994 to 1999 2000 to 2004 Total Recent Immigrants 1,541,749 520,255 463,024 558,470 United States of America 26,377 8,102 7,584 10,691 Central America 36,921 18,904 7,547 10,469
Jamaica 24,490 14,428 5,771 4,291
Other Caribbean and Bermuda 43,580 20,236 10,802 12,541 South America 62,003 21,605 14,354 26,044 United Kingdom 32,222 12,837 8,768 10,617
Germany 8,472 2,664 3,293 2,516
Other Northern and Western Europe 29,263 7,473 9,027 12,763
Poland 35,848 27,191 5,327 3,330
Other Eastern Europe 112,205 24,009 36,366 51,829
Italy 3,145 1,221 1,110 814
Portugal 11,394 8,472 1,776 1,147
Other Southern Europe 47,020 13,910 21,938 11,172 Eastern Africa 37,882 16,611 7,880 13,392 Northern Africa 49,758 8,620 13,984 27,154 Other Africa 37,882 9,841 11,838 16,204 West Central Asia and the Middle East 127,076 41,767 37,845 47,464 China, People's Republic of 186,934 39,399 55,011 92,523 Hong Kong, Special Administrative
Region 74,618 44,209 25,452 4,957
Other Eastern Asia 77,837 20,606 30,521 26,710 Philippines 111,021 42,211 34,109 34,701 Other Southeast Asia 55,455 33,184 11,579 10,691
India 166,624 39,695 56,158 70,771
Pakistan 56,195 8,213 18,312 29,670
Other Southern Asia 73,323 28,671 23,233 21,420 Oceania and others 13,429 5,808 3,219 4,402
Analysis of Data Aggregated by Country or Region of Origin
It is not sufficient just to point out the poor economic performance of recent immigrants
to Canada. It is also necessary to try to identify the determinants of the poor performance.
A convenient survey of recent studies is provided by Garnett Picot and Arthur Sweetman
(2005). They attribute the decline in entry earnings and increasing low-income rates to:
the changing characteristics of immigrants, including country of origin, language, and
education, which appears to have accounted for about a third of the increase in the
earnings gap; the decreasing returns to foreign work experience, which accounts for
another third; and the decline in the labour-market outcome of all new labour-force
entrants including immigrants. They also discuss a possible reduction in the return on
education and quality differences in education. To put it simply, Canadian employers do
not value foreign experience and heavily discount the value of foreign education. A lack
of fluency in English or French has also been identified as a problem (Grondin, 2005).
And more recent research focusing on outcomes in the early 2000s, attributed much of
the recent decline to the high concentration of recent immigrants in the IT and
engineering professions, which were adversely affected by the high-tech downturn (Picot,
and GDP per capita in 2005 in Place of Birth (as a a proxy for country or region of
origin).
The interpretation of the visible minority and GDP per capita variables is more
problematic. Visible minority status raises particularly controversial questions: Why
should visible minority status matter? Does it capture discrimination or racism in
Canada? Or is it just a proxy for some characteristics of the source countries from which
a large percentage of the immigrants coming to Canada are visible minorities?
The GDP per capita variable can be viewed as providing structural information on the
economy from whence the immigrants came. The higher the GDP per capita, the more
developed the economy, and the more similar in economic structure it is to Canada.
Immigrants coming from a highly developed country should have education and work
experience that is more directly applicable to Canada. The education is higher quality
according to published international rankings. And the technology and capital stock
utilized by workers from these countries is usually more advanced and state of the art.
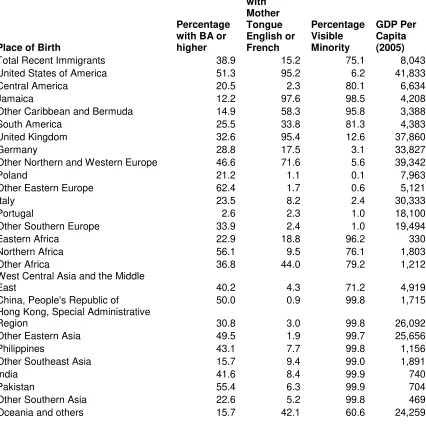
A high proportion of recent immigrants have Bachelors or higher degrees (39 per cent).
The average GDP per capita of the source countries for recent immigrants in 2005 is only
$8,043, which is less than a quarter of Canadian GDP per capita in the same year
($35,056). Among the source countries and regions shown in Table 7, only the United
Table 7: Some Possible Determinants of Poor Economic Performance by Recent Immigrants Arriving from 1990 to 2004
Place of Birth
Percentage with BA or higher Percentage with Mother Tongue English or French Percentage Visible Minority GDP Per Capita (2005) Total Recent Immigrants 38.9 15.2 75.1 8,043 United States of America 51.3 95.2 6.2 41,833
Central America 20.5 2.3 80.1 6,634
Jamaica 12.2 97.6 98.5 4,208
Other Caribbean and Bermuda 14.9 58.3 95.8 3,388
South America 25.5 33.8 81.3 4,383
United Kingdom 32.6 95.4 12.6 37,860
Germany 28.8 17.5 3.1 33,827
Other Northern and Western Europe 46.6 71.6 5.6 39,342
Poland 21.2 1.1 0.1 7,963
Other Eastern Europe 62.4 1.7 0.6 5,121
Italy 23.5 8.2 2.4 30,333
Portugal 2.6 2.3 1.0 18,100
Other Southern Europe 33.9 2.4 1.0 19,494
Eastern Africa 22.9 18.8 96.2 330
Northern Africa 56.1 9.5 76.1 1,803
Other Africa 36.8 44.0 79.2 1,212
West Central Asia and the Middle
East 40.2 4.3 71.2 4,919
China, People's Republic of 50.0 0.9 99.8 1,715 Hong Kong, Special Administrative
Region 30.8 3.0 99.8 26,092
Other Eastern Asia 49.5 1.9 99.7 25,656
Philippines 43.1 7.7 99.8 1,156
Other Southeast Asia 15.7 9.4 99.0 1,891
India 41.6 8.4 99.9 740
Pakistan 55.4 6.3 99.9 704
Other Southern Asia 22.6 5.2 99.8 469
Oceania and others 15.7 42.1 60.6 24,259
It is revealing to examine graphically the relationship between the employment income of
recent immigrants and GDP per capita in the country or region of origin (Chart 1). This
chart illustrates very well the positive relationship between these two variables. It also
shows which countries or regions such as the United States (observation 2) and the
United Kingdom (observation 7) lie farthest to the right and above the line and thus do
best. The countries and regions whose immigrants have the lowest employment income
and which have the lowest GDP per capita are clustered below the line in the lower left.
10,000 15,000 20,000 25,000 30,000 35,000 40,000 45,000 50,000
0 10,000 20,000 30,000 40,000 50,000
2 3 4 5 6 7 8 9 10 11 12 13 14 1516 17 18 19 20 21 22 23 24 25 26 27
GDP Per Capita US$
E m p lo ym e n t In co m e P e r C a p it a C A $
A more sophisticated tool for exploring the relative impact of the various factors is
multiple linear regression. It is a statistical technique that disentangles the relationship of
each of the four specified factors to average employment income for recent immigrants Box 1: Correspondence of Numeric Data Point with Place of Origin
Labels
2. USA 3. Cen. Amer. 4. Jamaica 5. Other Carib. 6. S. America 7. UK
8. Ger.
9. Other N&W Eur. 10. Poland
11. Other E Eur. 12. Italy
13. Portugal 14. Other S Eur. 15. E Africa 16. N Africa 17. Other Africa
18. W Cen. Asia & ME 19. China
20. Hong Kong 21. Other E Asia 22. Philippines 23. Other SE Asia 24. India
mother tongue English or French and percentage visible minority, are statistically highly
significant (Table 8). But percentage with BA or higher and GDP per capita are not.
Interestingly, if the variable for percentage visible minority is dropped, GDP per capita
also becomes statistically highly significant, but percentage with BA or higher does not.
And if percentage with BA or higher is eliminated, but percentage visible minority is
retained, GDP per capita turns out to be not significant. GDP per capita and percentage
visible minority status are highly collinear, but percentage visible minority status seems
to be much more closely related to employment income, at least when the data is
aggregated by country or region.
These regression results raise more questions than they answer. If visible minority status
per sedoes indeed reduce employment income, then what is the appropriate policy
response? And if it is a proxy for some other labour market relevant features of the
source countries or regions such as lower quality education, less relevant work
experience, or poorer language skills, then further research will be required to establish
the relationship. This can be done using more of the variables in the 2006 Census PUMF
Table 8: Results for Ordinary Linear Regression of Employment Income Earned in 2005 by Recent Immigrants Arriving from 1990 to 2004 By Country or Regional Group
Intercept
Percentage with BA or higher Percentage with Mother Tongue English or French Percentage Visible Minority GDP Per Capita
(2005) Adj. R2 30061.04 (11.40)** 41.64853 (0.49) 126.8165 (4.92)** -110.3150 (-4.88)** 0.022975 (0.31) 0.774951 21090.1 (7.82)** 32.84757 (0.49) 106.3553 (2.93)** 0.258725 (3.17)** 0.541676 31382.58 (14.57)** 123.9739 (4.88)** -109.5581 (-4.87)** 0.028706 (0.39) 0.777273
Analysis of Individual Micro Data
The most common approach utilized in Canada to explain the employment income of
recent immigrants has been to estimate reduced form equations with employment income
as the dependent variable and with human capital and other characteristics of the
immigrants as the explanatory variables (Abdurrahman and Skuterud, 2005, p.644;
Frenette and Morissette, 2003, p.1,17,18; Nadeau and Seckin, 2010, p.8). The dependent
variable is usually specified in logarithmic form so that the coefficients can be interpreted
as elasticities but a level form can also be used. The human capital variables utilized
usually relate to education, language and work experience. Other characteristics relate to
The regression results are shown in Table 9. Separate equations are estimated for men
and women because of the different likely impact of the explanatory variables given
differences in labour market behaviour. The first thing worth noting about the equations
is that, judging from the R2of 0.115 to 0.145, the factors considered only explain a small
proportion of the variance of employment income. However, this is not unusual in
carrying out empirical analysis with large cross sectional data bases like the Census,
which do not yield the same high R2(in excess of 0.9) as is usually the case in time series
analysis where there is often a high degree of multicollinearity of all the variables. What
is most relevant here is the t-statistics indicating the significance of the individual
explanatory variables and the F statistic showing the high overall significance of the two
estimated equations.
The first set of explanatory variables (after the constant term usually included in all
regressions to reflect the average value of the dependent variable which is unrelated to
the explanatory variables) are zero-one dummy variables reflecting the age group of the
immigrant. The coefficients show that immigrants aged 35-44 earn $3,430.90 more than
those aged 25-34 (the benchmark group) if they are men and $3,127.55 if they are
women; men aged 45-54 earn $1,462.61 more and women aged 45-54 earn $1,773.45
with the reference group being those responding none. The coefficients show that
employment income earned by immigrants goes up with education and that they are
highly significant for women for all levels of education, but for men only for college
programs of 2 years duration and above. However, these coefficients do not provide a
complete estimate of the impact of education on earnings. For the first time in the 2006
Census a question was included on the location of education to get a better handle on the
extent to which foreign education was being discounted in the labour market. It
“indicates the province, territory (in Canada) or country (outside Canada) where the
highest certificate, diploma or degree was obtained” and “is only reported for individuals
who had completed a certificate, diploma or degree above the secondary (high) school
level” (Statistics Canada, 2009, p.51). The location of study variable was used to
construct a dummy variable to indicate if the education was obtained outside of North
America or Europe where most of the world’s highest quality educational institutions are
located. This variable was then multiplied by the dummy variables for the highest level of
education. Their coefficients show the extent to which education outside of North
America and Europe is discounted by employers. For men, the coefficients are most
significant for Medical, Dental, Optometry or Veterinary Degree, and Masters Degrees.
Interestingly the discount is not so large and is not significant for those with a doctorate
This result confirming the lower contribution to earnings of education obtained outside of
North America and Europe is consistent with the findings of Sweetman (2004) on the
importance of educational quality in explaining immigrant wages. He found that
“immigrants from source countries with lower quality educational outcomes, as measured
by international test scores, are observed to receive a lower average return to their
schooling in the Canadian labour market than those from countries with higher quality
results” (Sweetman, 2004, p.4).
The next variable included is a dummy variable for marital status equal to one if married
and zero otherwise. Its coefficients are highly significant for both men and women, but
show opposite effects, which can probably be explained by the incentive that marriage
gives men to earn income and women to fulfill more traditional roles in caring for
children and housekeeping. A married recent immigrant man on average earns $7,966.75
more than an unmarried, and a married recent immigrant woman $1,856.71 less.
The variable for visible minority status is a zero-one dummy variable for each immigrant
who self identified as a member of one or more groups specified in the Employment
Equity Act who are non-Caucasian or non-white, except for Aboriginal Peoples. It
The variable for Canadian work experience is a hypothetical variable calculated as the
difference between the census year reference year 2005 and the year of immigration. For
instance, an immigrant coming in 1990 would be deemed to have roughly15 years of
Canadian experience in 2005, the year that employment income is measured in the 2006
census. The coefficient for this variable is substantial and highly significant for both men
and women. It indicates that ten years of Canadian work experience would add $9,831 to
the employment income of a recent immigrant man and $6,970 to a woman.
The next set of variables relate to language, another key aspect of human capital, and a
variable that has often been identified as a cause of the deterioration of immigrant
earnings in recent years (Grondin, 2005; Picot and Sweetman, 2005; Picot, 2008). The
first variable is a zero-one dummy variable for English mother tongue, which is highly
significant and raised employment income of men by $12,667.50 and women by
$5,428.60. The French mother tongue variable is also significant, but much less so,
raising employment income of men by $3,894.10 and women by $3,309.31. The next
variable is Knowledge of English, which is also highly significant and raises the income
of men by $6,342.03 and women by $2,716.31. It should be noted that these impacts are
reflect an association of knowledge of multiple languages with natural intelligence, which
is an asset in the labour market. It is noteworthy that Knowledge of English is much more
important than Knowledge of French in boosting employment income. For instance, an
immigrant man with a Knowledge of English would on average earn more than an
immigrant man whose Mother Tongue was French and an immigrant woman would only
earn slightly less.
The region where an immigrant chooses to reside also has a large (and except for Atlantic
Canada) a significant effect on earnings. Relative to comparable recent immigrants
residing in Ontario, the benchmark, men earned $9,202.60 less in the Atlantic Provinces,
$12,404.18 less in Quebec, and $6,166.87 less in British Columbia and the Territories.
On the other hand, in the Prairie Provinces men earned $6,162.52 more. Women also
earned $8,711.99 less in the Atlantic Provinces relative to comparable recent immigrants
residing in Ontario, $6,820.17 less in Quebec, and $1,779.00 less in British Columbia and
the Territories. Again in the Prairie Provinces women earned $1,161.50 more.
The GDP per capita variable in the immigrants Place of Birth discussed above was also
utilized an explanatory variable and was highly significant for men (but insignificant and
The final variable is a zero-one dummy variable for citizenship. It represents the
willingness of an immigrant to assimilate and integrate into Canada and might be
correlated with the immigrant’s degree of assimilation and success in the Canadian labour
market (DeVoretz and Pivnenko, 2006; and Nadeau and Seckin 2010). The results show
that citizenship alone is associated with a highly-significant increase in employment
income of $4,341.37 for men and $3,017.42 for women.
Picot and Hou (2008) attribute much of the post-2000 fall in earnings of immigrants to
the Information Technology downturn, and the large concentration of immigrants,
especially men in the IT sector. Unfortunately, the occupational information in the 2006
Census is very aggregate and there is no variable permitting identification of immigrants
Table 9: Regression of Employment Income of Recent Immigrants from 1990 to 2004
Men 25-64 Women 25-64
Variable Coefficient t-Statistic Prob. Coefficient t-Statistic Prob.
Constant 8,537.54 4.22 0.0000 3,518.76 4.02 0.0001
Age 35 to 44 3,430.90 3.98 0.0001 3,127.55 8.15 0.0000
Age 45 to 54 1,462.61 1.50 0.1334 1,773.45 3.98 0.0001
Age 55 to 64 -8,156.27 -6.38 0.0000 -4,379.18 -7.26 0.0000
High School 368.89 0.30 0.7664 1,134.92 2.04 0.0409
Other Trades 2,673.29 1.42 0.1546 2,957.49 3.30 0.0010
Reg. Apprenticeship 3,629.66 1.64 0.1017 4,736.59 3.80 0.0001
College, Program< 1 year 2,535.92 0.72 0.4685 5,051.36 4.21 0.0000 College, Program 1-2 years 4,406.91 2.45 0.0145 6,333.36 8.22 0.0000 College, Program> 2 years 6,625.41 4.04 0.0001 8,298.18 10.97 0.0000 University Cert. or Dipl. 7,420.60 4.77 0.0000 10,488.23 11.45 0.0000
Bachelors Degree 15,377.03 10.06 0.0000 15,892.93 21.28 0.0000
Cert. or Diploma above BA 15,766.19 6.18 0.0000 20,265.86 16.15 0.0000
Medical, Dental, Optometry or
Veterinary Degree 78,920.84 14.65 0.0000 33,764.53 14.68 0.0000
Masters Degree 26,485.84 16.04 0.0000 21,902.41 25.00 0.0000
Doctorate Degree 37,133.64 14.68 0.0000 31,324.38 16.23 0.0000
If education outside North America or Europe:
University Cert. or Dipl. -3,848.80 -3.75 0.0002
Bachelors Degree -2,561.65 -1.77 0.0768 -4,980.42 -6.87 0.0000
Cert. or Diploma above BA -1,080.74 -0.34 0.7351 -10,109.59 -6.30 0.0000
Medical, Dental, Optometry or
Veterinary Degree -29,685.84 -4.29 0.0000 -15,162.49 -5.24 0.0000
Masters Degree -11,367.10 -5.79 0.0000 -10,169.12 -8.91 0.0000
Doctorate Degree -5,514.57 -1.16 0.2480 -1,444.63 -0.39 0.6955
Married 7,966.75 9.57 0.0000 -1,856.71 -5.11 0.0000
Visible Minority -11,086.63 -12.95 0.0000 -2,532.66 -6.03 0.0000 Years of Canadian Work
Experience 983.09 10.69 0.0000 696.98 15.99 0.0000
English Mother Tongue 12,667.50 13.33 0.0000 5,428.60 12.07 0.0000
French Mother Tongue 3,894.10 1.99 0.0465 3,309.31 3.33 0.0009
Knowledge of English 6,342.03 4.13 0.0000 2,716.31 4.35 0.0000
Knowledge of French 4,917.50 1.88 0.0595 2,640.40 2.39 0.0169
A Profile of Recent Immigrants Who Succeed
The Census 2006 PUMF data can also be used to profile those recent immigrants who
have succeeded in the labour market. Any definition of success is, of course, to a certain
extent arbitrary. Nevertheless, for the purposes here, success is defined as reporting
employment income in excess of the average reported by non-immigrants in the 25 to 64
age group of $47,634.58 for men and $27,089.47 for women. By this criterion, only
384,596 out of the 1,541,749 or a quarter of the recent immigrants who came to Canada
from 1990 to 2004, stayed, and were age 25-64 in 2006 could be considered successful.
This means that Canada is admitting many more immigrants than can be successfully
integrated in the Canadian labour market. The obvious implication of this is that Canada
should substantially reduce the targeted immigration levels to the extent that immigration
policy is guided by the country’s economic interests in raising per capita income.
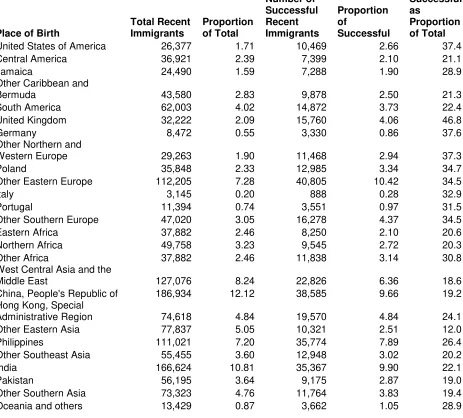
It is interesting to compare the proportion of the immigrants who are classified as
successful compared to the totals coming from the various countries and regions (Table
10). Countries or regions with a higher proportion of successful recent immigrants are the
United States, Jamaica, the United Kingdom, other European countries, other Africa, the
Phillipines, and Oceania and others. Countries with lower proportions are Central
Table 10: A Profile of Successful Recent Immigrants by Country or Region
Place of Birth
Total Recent Immigrants Proportion of Total Number of Successful Recent Immigrants Proportion of Successful Successful as Proportion of Total United States of America 26,377 1.71 10,469 2.66 37.4
Central America 36,921 2.39 7,399 2.10 21.1
Jamaica 24,490 1.59 7,288 1.90 28.9
Other Caribbean and
Bermuda 43,580 2.83 9,878 2.50 21.3
South America 62,003 4.02 14,872 3.73 22.4
United Kingdom 32,222 2.09 15,760 4.06 46.8
Germany 8,472 0.55 3,330 0.86 37.6
Other Northern and
Western Europe 29,263 1.90 11,468 2.94 37.3
Poland 35,848 2.33 12,985 3.34 34.7
Other Eastern Europe 112,205 7.28 40,805 10.42 34.5
Italy 3,145 0.20 888 0.28 32.9
Portugal 11,394 0.74 3,551 0.97 31.5
Other Southern Europe 47,020 3.05 16,278 4.37 34.5
Eastern Africa 37,882 2.46 8,250 2.10 20.6
Northern Africa 49,758 3.23 9,545 2.72 20.3
Other Africa 37,882 2.46 11,838 3.14 30.8
West Central Asia and the
Middle East 127,076 8.24 22,826 6.36 18.6
China, People's Republic of 186,934 12.12 38,585 9.66 19.2 Hong Kong, Special
Administrative Region 74,618 4.84 19,570 4.84 24.1 Other Eastern Asia 77,837 5.05 10,321 2.51 12.0
Philippines 111,021 7.20 35,774 7.89 26.4
Other Southeast Asia 55,455 3.60 12,948 3.02 20.2
India 166,624 10.81 35,367 9.90 22.1
Pakistan 56,195 3.64 9,175 2.87 19.0
Other Southern Asia 73,323 4.76 11,764 3.83 19.4 Oceania and others 13,429 0.87 3,662 1.05 28.9
A comparison of the profile of successful recent immigrants with the total population is
very instructive (Table 11). Apparently, Visible Minority status is slightly more common
among successful recent immigrant men, but less common among successful women.
The extent to which successful recent immigrant men and women both have at least a
Bachelors degree (53.42 per cent for successful men versus 35.77 per cent for all and
50.60 per cent for successful women versus 32.54 per cent for all women) is telling. The
greater prevalence of more advanced degrees – Masters, and Doctorates – is also
significant. But most important of all is that location of the studies of successful recent
immigrants in North America and Europe (53.42 per cent of successful men compared to
35.77 of all men and 50.60 per cent of successful women compared to 32.54 per cent for
all women). This in effect means that more than half of successful immigrants obtained
their highest certificate, diploma or degree above the secondary (high) school level in
North America or Europe with Canada (accounting for 25.46 per cent of the location of
study for men and 30.99 per cent for women) and Europe (22.78 per cent for men and
16.31 per cent for women) being the main locations of the advanced education.
Concerning language knowledge and skills, having an English Mother Tongue was the
characteristic that most distinguished successful recent immigrants from the overall
obtained in North America and Europe. It also shows that recent immigrants from the
United Kingdom, the United States, and Northern and Western Europe are more likely to
[image:32.612.96.486.237.556.2]be successful.
Table 11: Comparison of Successful Recent Immigrants with All Recent Immigrants
Men Women
Successful All Successful All Avg. Emp. Inc. $ 83,002 34,011 48,168 18,433 No.in sample 4,592 19,479 5,806 22,196 No.in pop. 169,879 720,617 214,791 821,132 Visible Minority % 86.59 74.19 68.21 75.97 BA or higher % 56.00 38.91 51.10 35.74 Bachelor's degree % 29.38 23.36 29.92 22.16 Univ.cert./dipl. Above % 5.75 4.13 5.65 3.69 Deg.in medicine, dentistry, veterinary
medicine, or optometry % 1.46 0.89 1.62 1.17
Master's % 18.16 11.55 11.95 7.81
Doctorate % 5.73 2.59 1.96 0.91
Location of Studies North America or
Europe % 53.42 35.77 50.60 32.54
Location of Studies Canada % 25.46 19.01 30.99 19.67 Location of Studies US % 5.18 2.96 3.31 2.01 Location of Studies Europe % 22.78 13.80 16.31 10.86 Location of Studies Other % 32.95 33.82 33.65 33.36 Mother Tongue Eng. Or French % 22.47 15.37 21.18 14.99 Mother Tongue English % 20.91 14.80 20.81 14.89 Mother Tongue French % 4.01 3.60 3.69 3.01 Knowledge of Eng % 85.39 79.17 83.71 77.07 Knowledge of French % 1.07 3.32 1.76 4.31 Knowledge of Both% 12.46 11.94 12.69 10.04
Conclusions
Data from the 2006 Census clearly show the wide range of performance among
immigrants from different countries and regions. Those do better who come from
countries and regions where a larger percentage of the immigrants speak English or
French as a mother tongue, where GDP per capita is higher, or where a lower percentage
of the immigrants coming to Canada is visible minority. The data also show that Canada
is admitting many more immigrants than are successful in the labour market. This
suggests that current immigration policy is not serving to promote Canada’s economic
interests by raising per capita income.
An important finding of this paper based on new information first obtained in the 2006
Census is on the importance of the location of study to the performance of immigrants.
This suggests that the quality of a higher education obtained in North America or Europe
should be specifically taken into consideration in improving the selection of immigrants.
Another notable finding of this paper is on the relationship, at least for men, between the
GDP per capita in the countries or regions of origin of recent immigrants and their
regions are mitigated. This, of course, does not mean that immigrants from countries
with a lower proportion of economic class immigrants should not do worse on average.
This paper also reveals a problematic relationship between visible minority status and
earnings that is even stronger than the relationship with GDP per capita.
By the same token, the importance of Canadian work experience confirmed in this study
also has implications for immigration policy. Taken together with the fact that work
experience in the countries from which the vast majority of immigrants come is given
very little recognition in Canadian labour markets, it implies that the younger immigrants
are when they come to Canada, the better they are likely to do. The system, which was in
effect in effect up to 2005 and beyond, gave full points for age up to 49. And under that
system, it takes so long for selected immigrants to actually land and settle in Canada that
the ability of immigrants to benefit from Canadian work experience over their working
lives is significantly reduced.
The results reported in this paper make it clear that the Government is not using the
available information from the Census on the performance of immigrants from different
unrelated to the economic performance of the immigrants from those countries. As a
result, some observers have speculated that this reflects a tendency of immigration posts
to each process a certain administrative quota of applications based on the size of the
post.
The key question that naturally flows from this paper is what can be done to prevent the
poor economic performance of immigrants from particular countries and regions from
undermining Canadian economic performance more generally. How can immigrants be
better selected with a view to their likely success in Canadian labour markets? And how
many immigrants from each country or region can be admitted that are actually likely to
References
Abdurrahman Aydemir and Mikal Skuterud (2005) “Explaining the deteriorating entry earnings of Canada’s immigrant cohorts, 1966 – 2000,”Canadian Journal of Economics,Vol. 38, No. 2, May, pp.641-672.
DeVoretz, Don J. and Sergiy Pivnenko (2006) “The Economics of Canadian
Citizenship,”Journal of International Migration and Integration, 6(4), pp. 435-468.
Frenette, Marc and René Morissette (2003)Will they ever converge? Earnings of immigrant and Canadian-born, Statistics Canada, Catalogue no. 11F0019MIE.
Grondin, Chantal (2005)Knowledge of Official Languages among New Immigrants: How Important Is It in the Labour Market?Statistics Canada, Catalogue No. 89-624-XWE,
Hou, Feng and Garnett Picot (2004) "Visible Minority Neighbourhoods in Toronto, Montréal and Vancouver,"Canadian Social Trends, No. 72, Spring, pp.8-13.
Nadeau, Serge and Aylin Seckin (2010) “The Immigrant Wage Gap in Canada: Quebec and the Rest of Canada,” University of Ottawa, Research Group on the
Economics of Immigration, http://www.socialsciences.uottawa.ca/grei-rgei/eng/documents/nadeauseckin_.pdf
Picot, Garnett (2008)Immigrant Economic and Social Outcomes in Canada: Research and Data Development at Statistics Canada, Statistics Canada, Catalogue No. 11F0019M — No. 319.
Picot, Garnett, and Arthur Sweetman (2005)The Deteriorating Economic Welfare of Immigrants and Possible Causes: Update 2005, Statistics Canada, Catalogue No. 11F0019MIE2005262 — No. 262.
Picot, Garnett, and Feng Hou (2008)Immigrant Characteristics, the IT Bust, and Their Effect on Entry Earnings of Immigrants,Statistics Canada, Catalogue No. 11F0019MWE2008315 — No. 315.